| Param | Original file | Final file |
|---|---|---|
| Filename | modeM0/AS1A12_053T01_9000005530_40197cztM0_level2.fits | modeM0/AS1A12_053T01_9000005530_40197cztM0_level2_quad_clean.evt |
| Size (bytes) | 395,017,920 | 92,352,960 |
| Size | 376.7 MB | 88.1 MB |
| Events in quadrant A | 3,661,995 | 609,379 |
| Events in quadrant B | 2,773,313 | 651,697 |
| Events in quadrant C | 3,078,934 | 625,851 |
| Events in quadrant D | 4,680,112 | 524,617 |
| Mode M0 | |||
|---|---|---|---|
| Quadrant | BADHDUFLAG | Total packets | Discarded packets |
| A | 0 | 14315 | 3 |
| B | 0 | 11693 | 2 |
| C | 0 | 12538 | 2 |
| D | 0 | 17739 | 2 |
| Mode SS | |||
|---|---|---|---|
| Quadrant | BADHDUFLAG | Total packets | Discarded packets |
| A | 0 | 112 | 0 |
| B | 0 | 112 | 0 |
| C | 0 | 112 | 0 |
| D | 0 | 112 | 0 |
| Mode M9 | |||
|---|---|---|---|
| Quadrant | BADHDUFLAG | Total packets | Discarded packets |
| A | 0 | 20 | 0 |
| B | 0 | 20 | 0 |
| C | 0 | 20 | 0 |
| D | 0 | 21 | 0 |
| Quadrant | Total seconds | Saturated seconds | Saturation percentage |
|---|---|---|---|
| A | 5498 | 267 | 4.856311% |
| B | 5498 | 16 | 0.291015% |
| C | 5498 | 17 | 0.309203% |
| D | 5498 | 602 | 10.949436% |
Noise dominated data is calculated using 1-second bins in cleaned event files. If a bin has >2000 counts, and if more than 50% of those come from <1% of pixels, then it is considered to be noise-dominated and hence unusable.
| Quadrant | # 1 sec bins | Bins with >0 counts | Bins with >2000 counts | High rate bins dominated by noise | Noise dominated (total time) | Noise dominated (detector-on time) | Marked lightcurve |
|---|---|---|---|---|---|---|---|
| A | 7289 | 5499 | 187 | 187 | 2.57% | 3.40% | 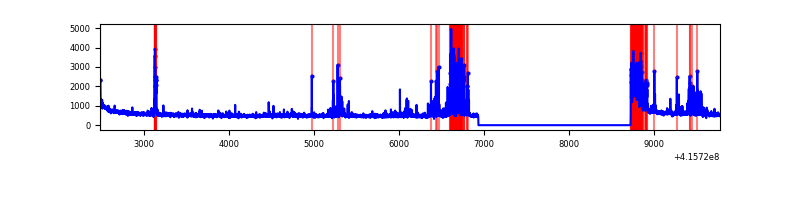 |
| B | 7289 | 5499 | 12 | 12 | 0.16% | 0.22% | 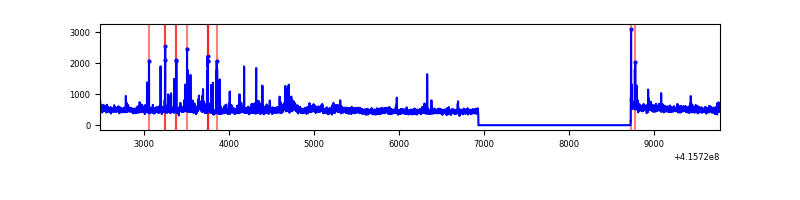 |
| C | 7289 | 5499 | 12 | 12 | 0.16% | 0.22% | 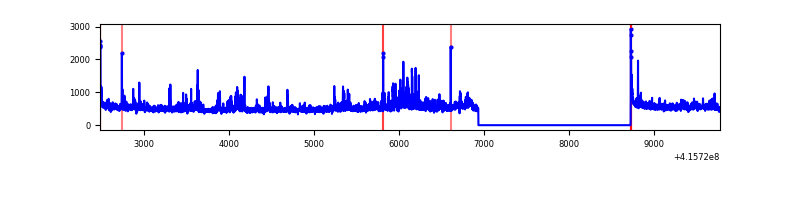 |
| D | 7289 | 5499 | 502 | 502 | 6.89% | 9.13% | 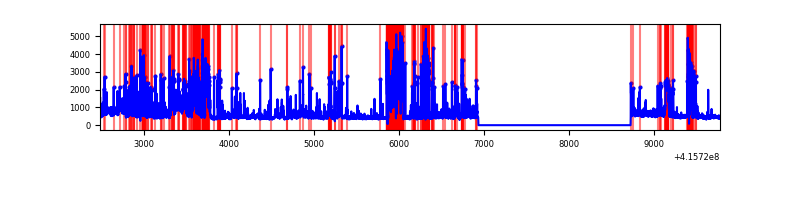 |
Top three noisy pixels from each quadrant. If the there are fewer than three noisy pixels in the level2.evt file, extra rows are filled as -1
| Pixel properties | Quadrant properties | ||||||
|---|---|---|---|---|---|---|---|
| Quadrant | DetID | PixID | Counts | Sigma | Mean | Median | Sigma |
| A | 13 | 248 | 715324 | 5682.72 | 614 | 602 | 125.8 |
| A | 10 | 83 | 499712 | 3968.4 | 614 | 602 | 125.8 |
| A | 2 | 79 | 39261 | 307.38 | 614 | 602 | 125.8 |
| B | 5 | 255 | 95641 | 796.13 | 624 | 609 | 119.4 |
| B | 0 | 230 | 52085 | 431.24 | 624 | 609 | 119.4 |
| B | 0 | 190 | 43854 | 362.28 | 624 | 609 | 119.4 |
| C | 4 | 254 | 241036 | 1693.78 | 610 | 614 | 141.9 |
| C | 15 | 214 | 230071 | 1616.53 | 610 | 614 | 141.9 |
| C | 9 | 187 | 162032 | 1137.19 | 610 | 614 | 141.9 |
| D | 12 | 227 | 1943972 | 13570.67 | 580 | 563 | 143.2 |
| D | 13 | 249 | 148376 | 1032.17 | 580 | 563 | 143.2 |
| D | 2 | 249 | 92123 | 639.36 | 580 | 563 | 143.2 |
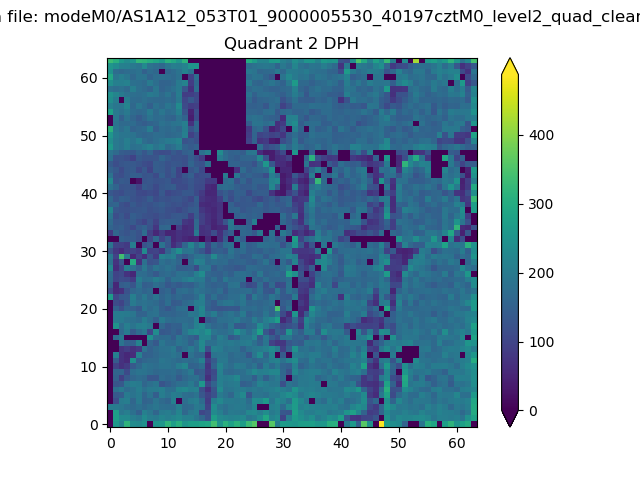
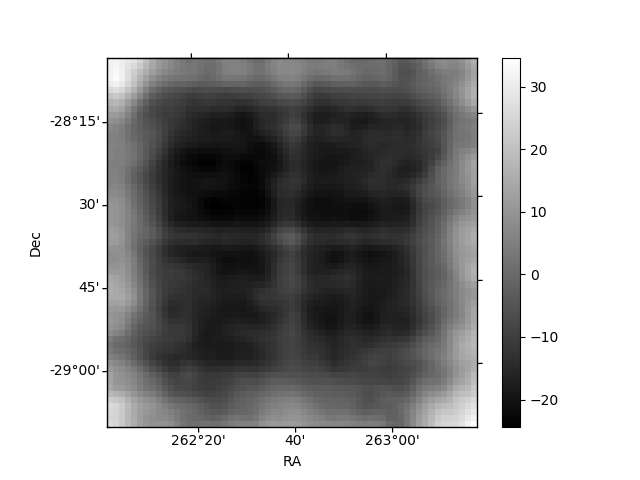
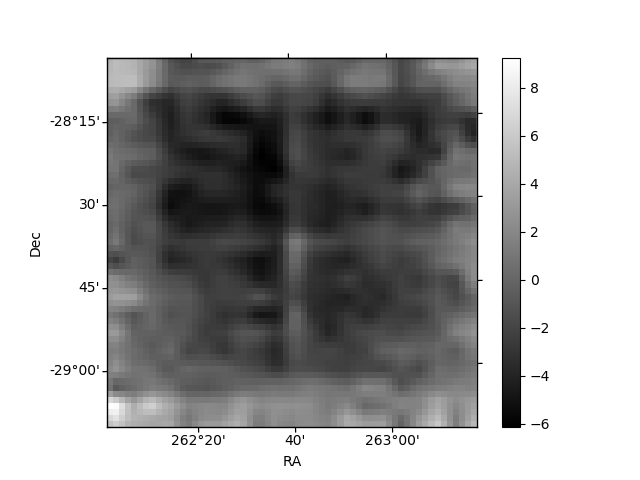
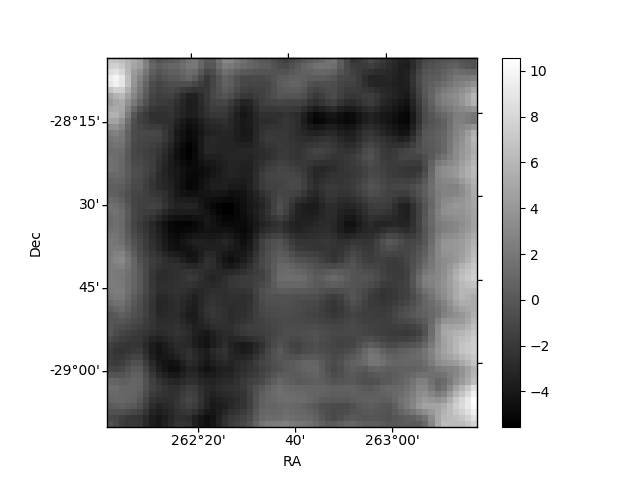
Histogram calculated using DETX and DETY for each event in the final _common_clean file
| Quadrant A | 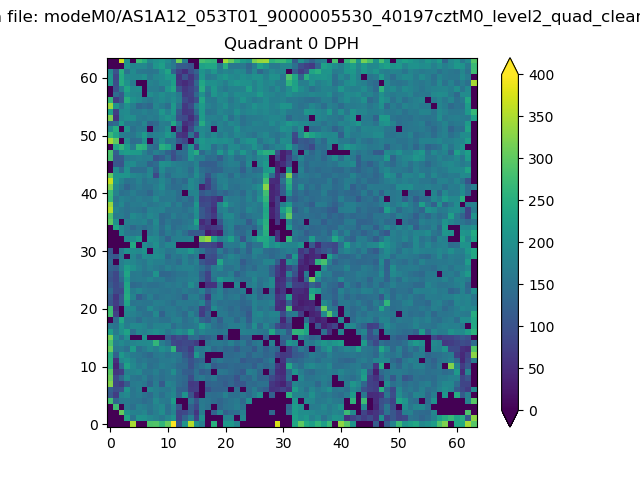 |
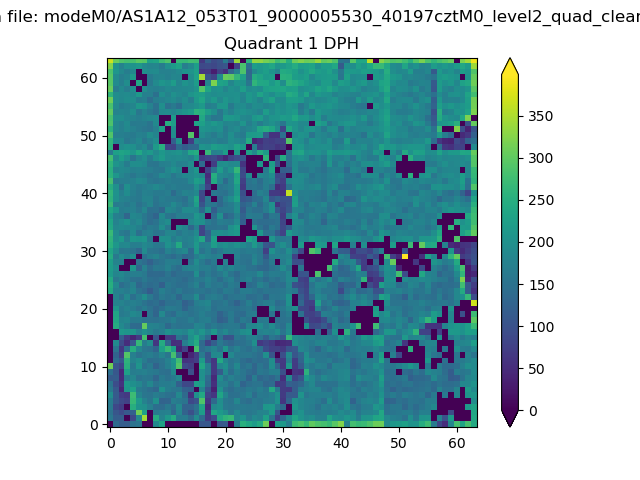 |
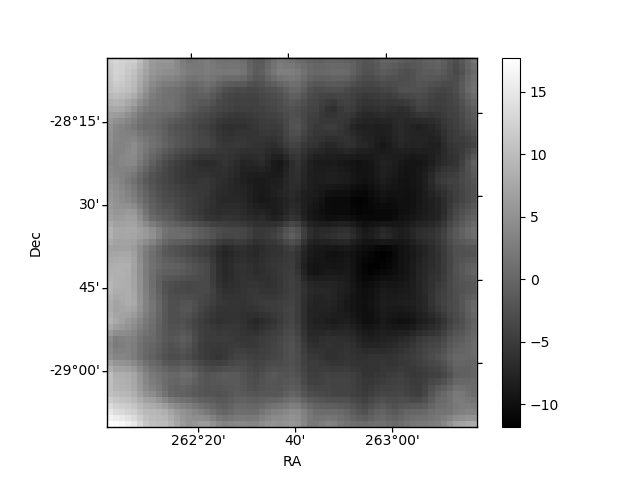
Quadrant B |
|---|---|---|---|
| Quadrant D | 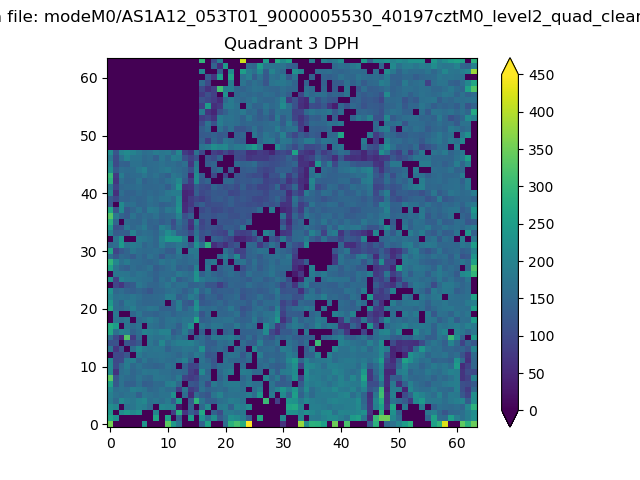 |
 |
Quadrant C |
| Plot type | Count rate plots | Images |
|---|---|---|
| Comparison with Poisson distribution Blue bars denote a histogram of data divided into 1 sec bins. Red curve is a Poisson curve with rate = median count rate of data. |
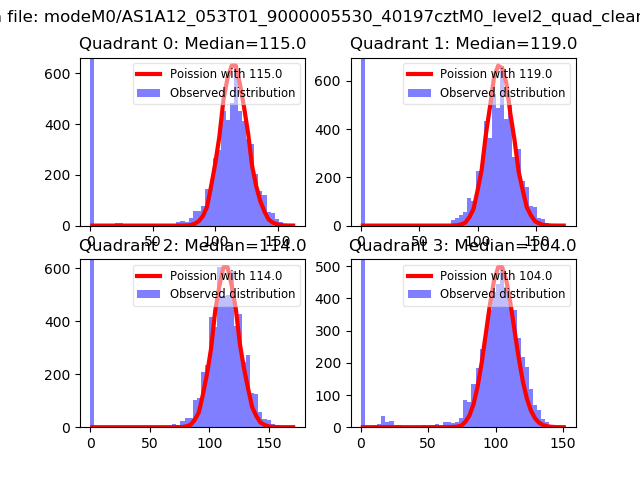 |
 |
| Quadrant-wise count rates Data is divided into 100 sec bins |
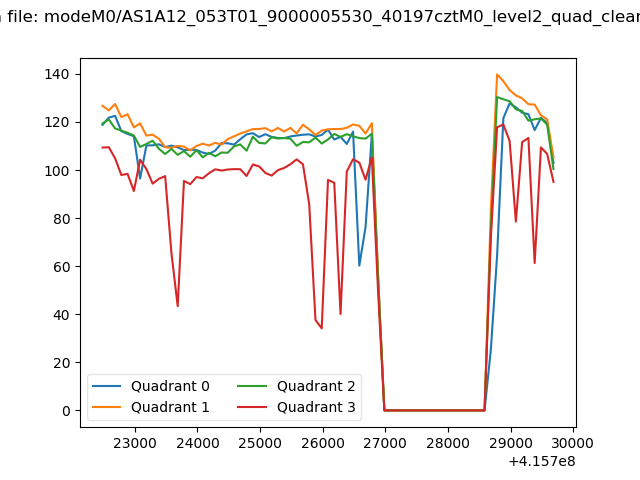 |
|
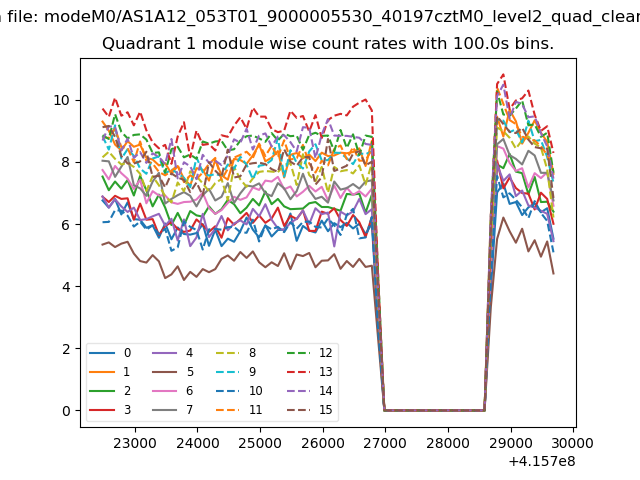
| Module-wise count rates for Quadrant A Data is divided into 100 sec bins |
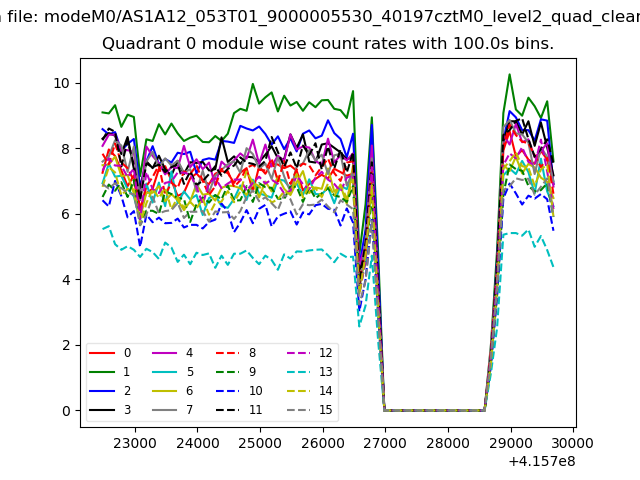 |
 |
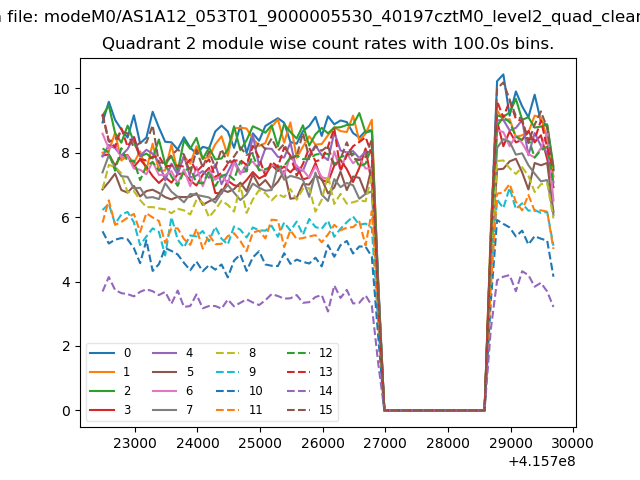
| Module-wise count rates for Quadrant B Data is divided into 100 sec bins |
 |
 |
| Module-wise count rates for Quadrant C Data is divided into 100 sec bins |
 |
 |
| Module-wise count rates for Quadrant D Data is divided into 100 sec bins |
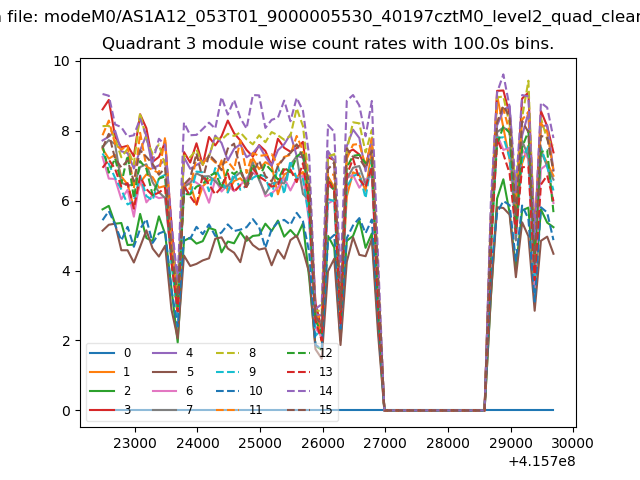 |
 |
| Parameter | Plot |
|---|---|
| CZT HV Monitor | 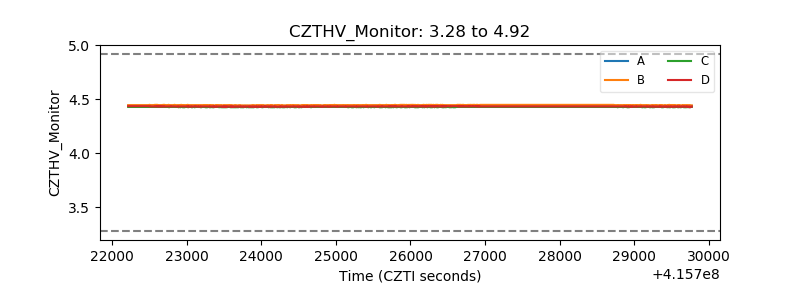 |
| D_VDD | 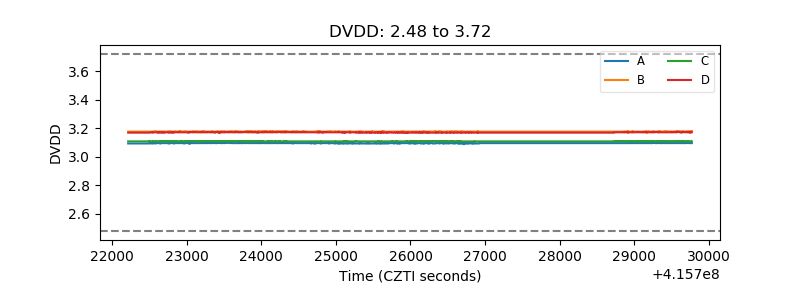 |
| Temperature 1 | 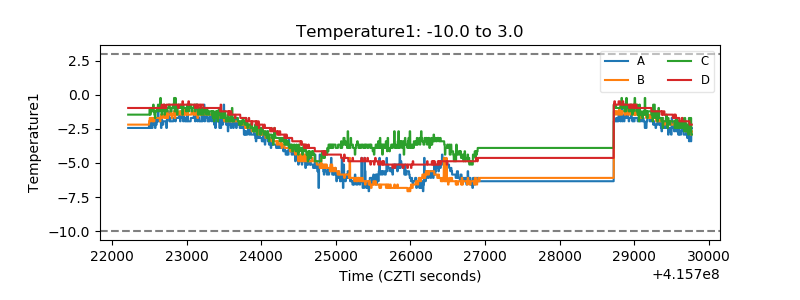 |
| Veto HV Monitor | 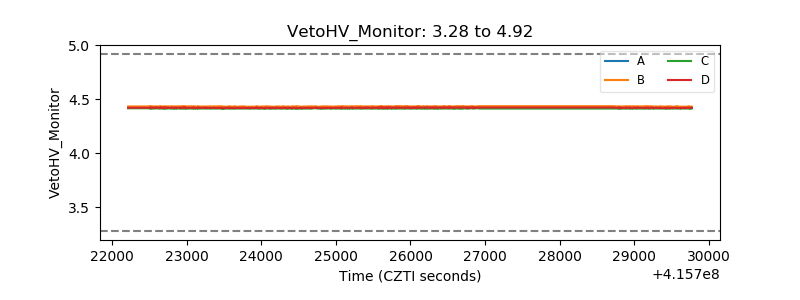 |
| Veto LLD | 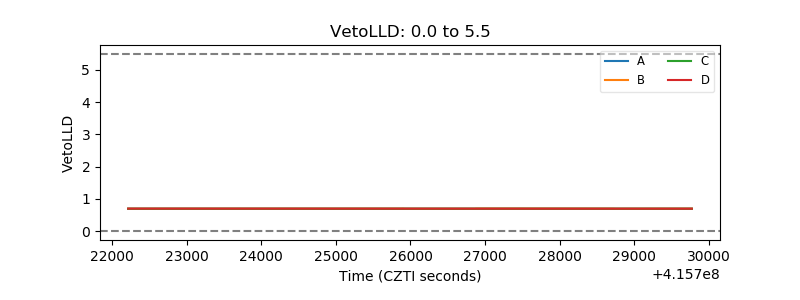 |
| Alpha Counter | 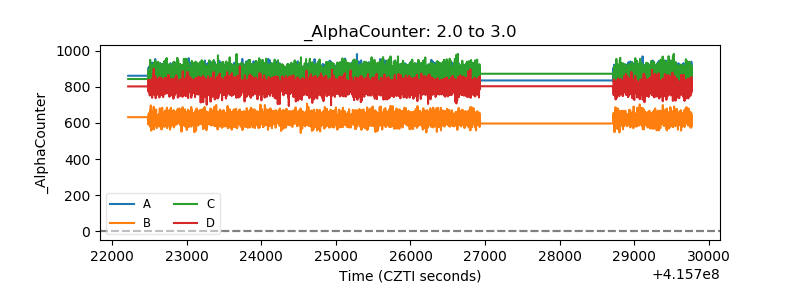 |
| _CPM_Rate | 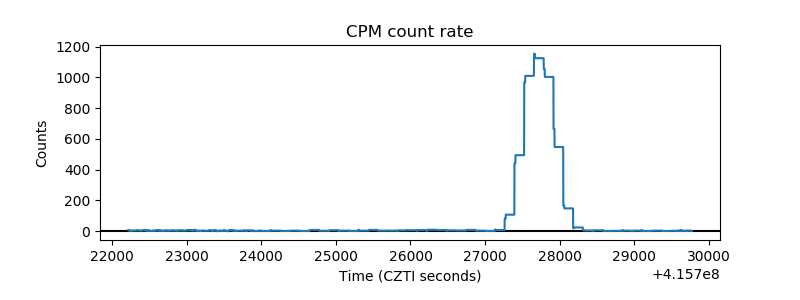 |
| CZT Counter | 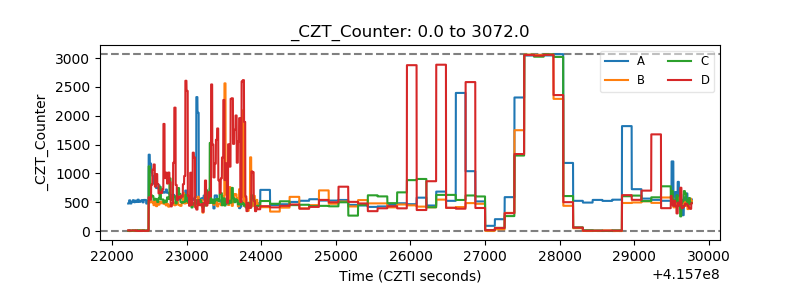 |
| +2.5 Volts monitor | 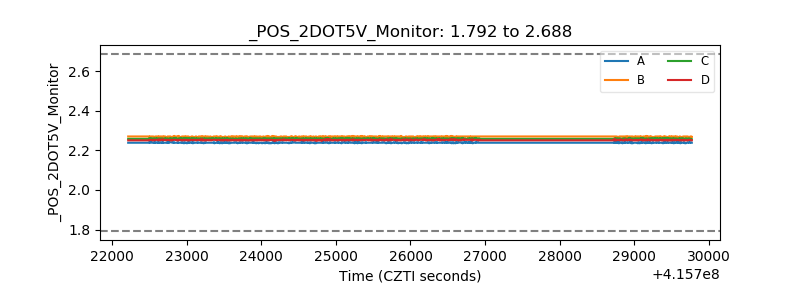 |
| +5 Volts monitor | 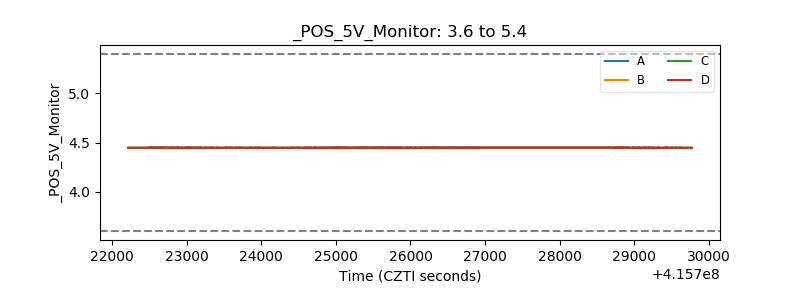 |
| _ROLL_ROT | 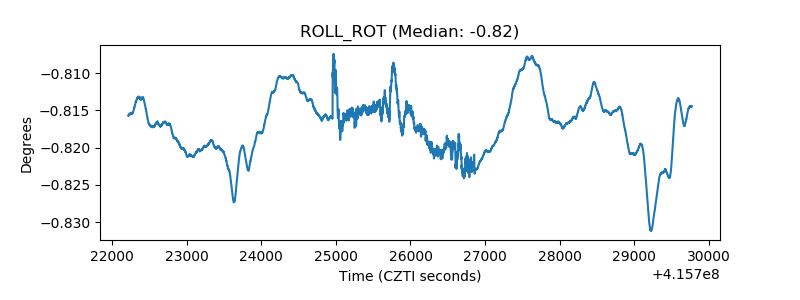 |
| _Roll_DEC | 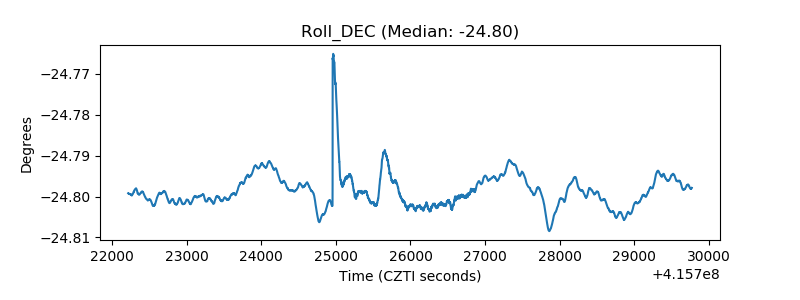 |
| _Roll_RA | 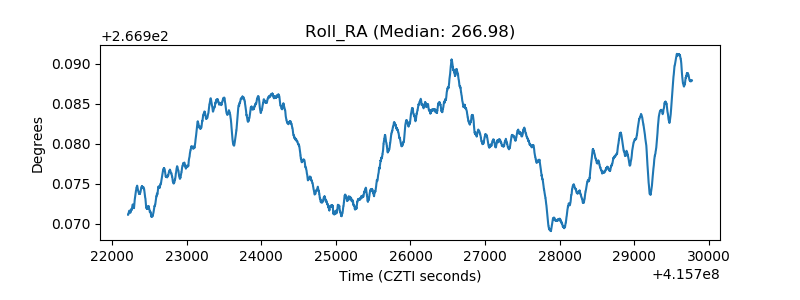 |
| Veto Counter | 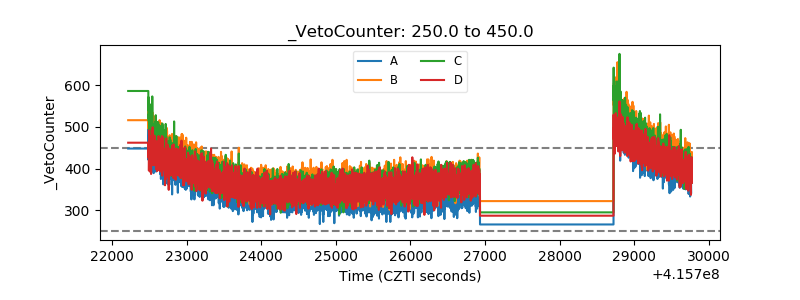 |