| Param | Original file | Final file |
|---|---|---|
| Filename | modeM0/AS1A12_053T01_9000005530_40198cztM0_level2.fits | modeM0/AS1A12_053T01_9000005530_40198cztM0_level2_quad_clean.evt |
| Size (bytes) | 331,634,880 | 92,759,040 |
| Size | 316.3 MB | 88.5 MB |
| Events in quadrant A | 3,290,405 | 621,031 |
| Events in quadrant B | 2,606,109 | 649,125 |
| Events in quadrant C | 2,715,675 | 619,695 |
| Events in quadrant D | 3,259,406 | 555,565 |
| Mode M0 | |||
|---|---|---|---|
| Quadrant | BADHDUFLAG | Total packets | Discarded packets |
| A | 0 | 13061 | 3 |
| B | 0 | 11074 | 2 |
| C | 0 | 11106 | 2 |
| D | 0 | 13272 | 2 |
| Mode SS | |||
|---|---|---|---|
| Quadrant | BADHDUFLAG | Total packets | Discarded packets |
| A | 0 | 106 | 0 |
| B | 0 | 106 | 0 |
| C | 0 | 106 | 0 |
| D | 0 | 106 | 0 |
| Mode M9 | |||
|---|---|---|---|
| Quadrant | BADHDUFLAG | Total packets | Discarded packets |
| A | 0 | 19 | 0 |
| B | 0 | 19 | 0 |
| C | 0 | 19 | 0 |
| D | 0 | 19 | 0 |
| Quadrant | Total seconds | Saturated seconds | Saturation percentage |
|---|---|---|---|
| A | 5191 | 154 | 2.966673% |
| B | 5191 | 21 | 0.404546% |
| C | 5191 | 11 | 0.211905% |
| D | 5191 | 195 | 3.756502% |
Noise dominated data is calculated using 1-second bins in cleaned event files. If a bin has >2000 counts, and if more than 50% of those come from <1% of pixels, then it is considered to be noise-dominated and hence unusable.
| Quadrant | # 1 sec bins | Bins with >0 counts | Bins with >2000 counts | High rate bins dominated by noise | Noise dominated (total time) | Noise dominated (detector-on time) | Marked lightcurve |
|---|---|---|---|---|---|---|---|
| A | 7103 | 5192 | 107 | 107 | 1.51% | 2.06% | 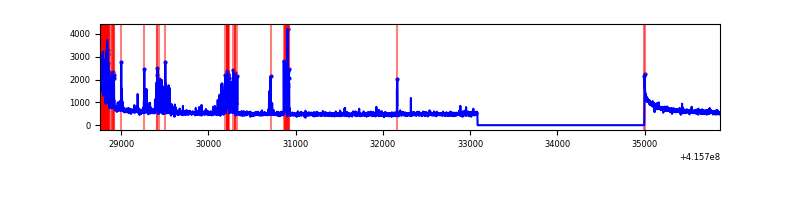 |
| B | 7103 | 5192 | 8 | 8 | 0.11% | 0.15% |  |
| C | 7103 | 5192 | 4 | 4 | 0.06% | 0.08% | 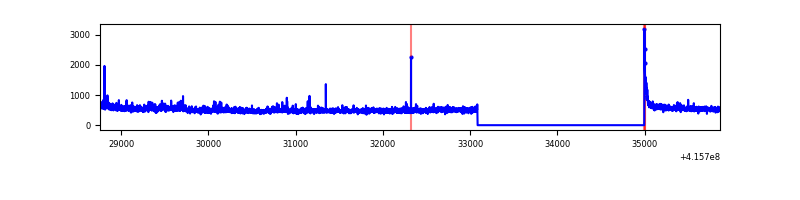 |
| D | 7103 | 5192 | 165 | 165 | 2.32% | 3.18% | 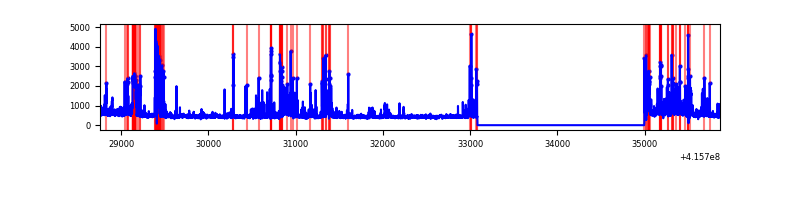 |
Top three noisy pixels from each quadrant. If the there are fewer than three noisy pixels in the level2.evt file, extra rows are filled as -1
| Pixel properties | Quadrant properties | ||||||
|---|---|---|---|---|---|---|---|
| Quadrant | DetID | PixID | Counts | Sigma | Mean | Median | Sigma |
| A | 10 | 83 | 460140 | 3726.68 | 603 | 591 | 123.3 |
| A | 13 | 248 | 443108 | 3588.56 | 603 | 591 | 123.3 |
| A | 15 | 223 | 27240 | 216.11 | 603 | 591 | 123.3 |
| B | 5 | 255 | 90644 | 770.34 | 608 | 592 | 116.9 |
| B | 0 | 230 | 43427 | 366.43 | 608 | 592 | 116.9 |
| B | 0 | 245 | 22029 | 183.38 | 608 | 592 | 116.9 |
| C | 15 | 214 | 216467 | 1573.16 | 593 | 598 | 137.2 |
| C | 4 | 254 | 101601 | 736.07 | 593 | 598 | 137.2 |
| C | 0 | 10 | 38943 | 279.44 | 593 | 598 | 137.2 |
| D | 12 | 227 | 680318 | 4795.76 | 582 | 568 | 141.7 |
| D | 12 | 233 | 88394 | 619.63 | 582 | 568 | 141.7 |
| D | 13 | 249 | 71507 | 500.49 | 582 | 568 | 141.7 |
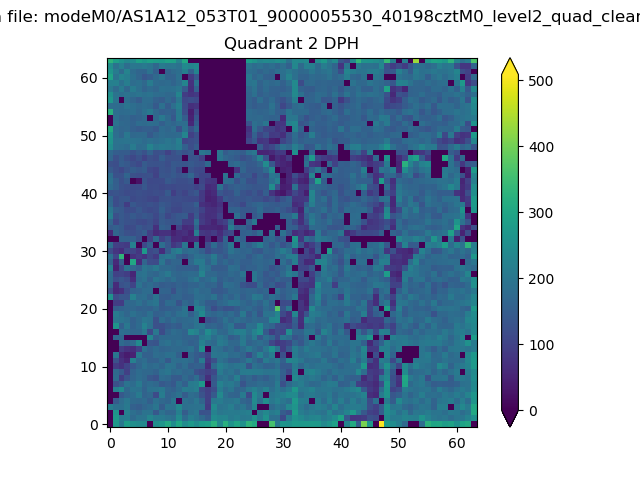
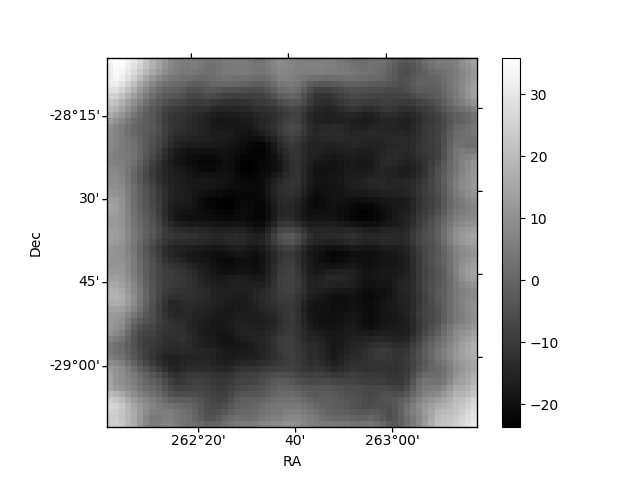
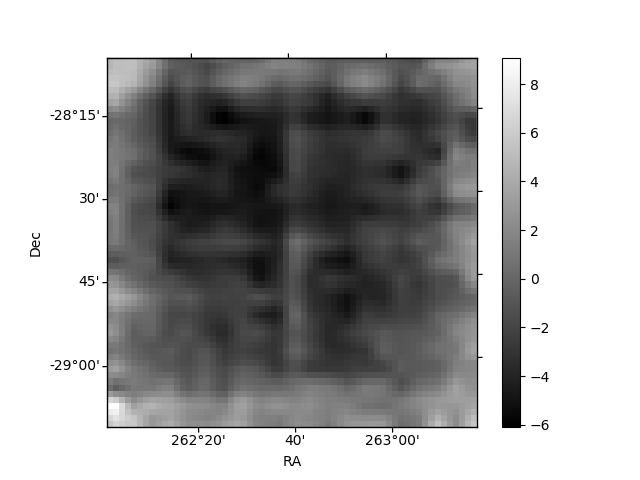
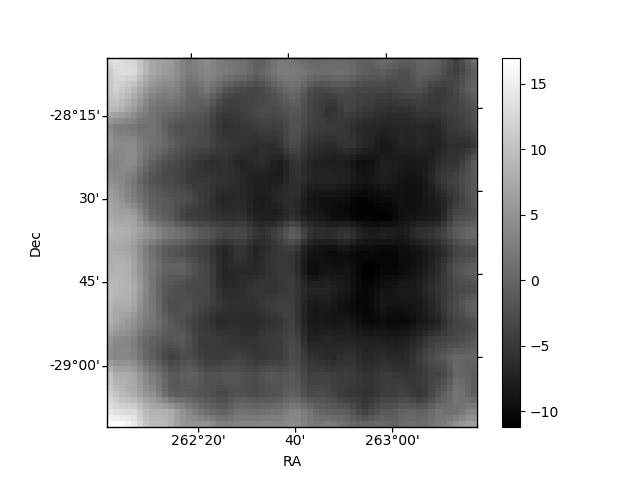
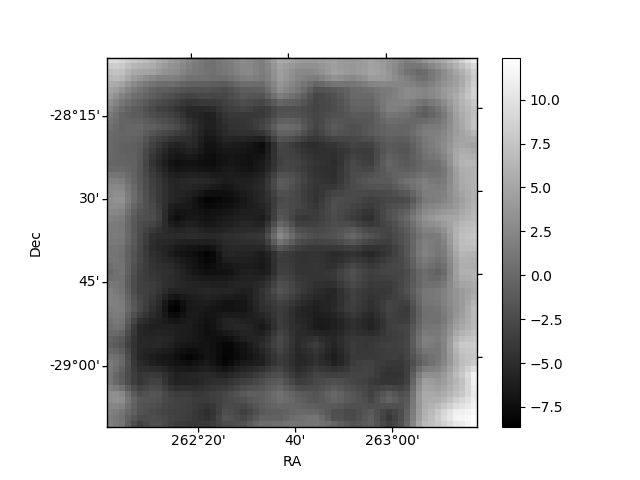
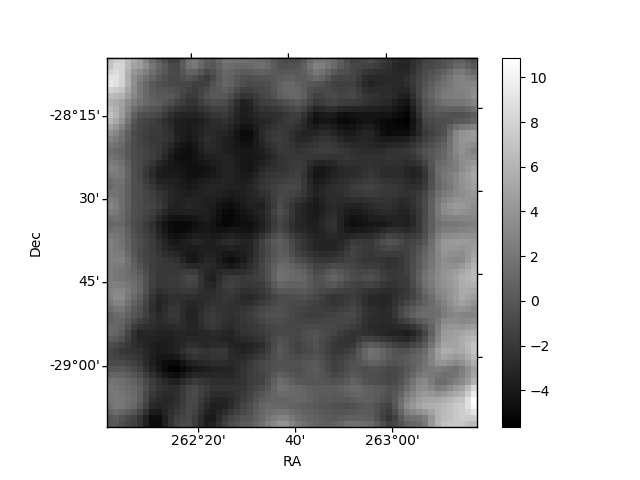
Histogram calculated using DETX and DETY for each event in the final _common_clean file
| Quadrant A | 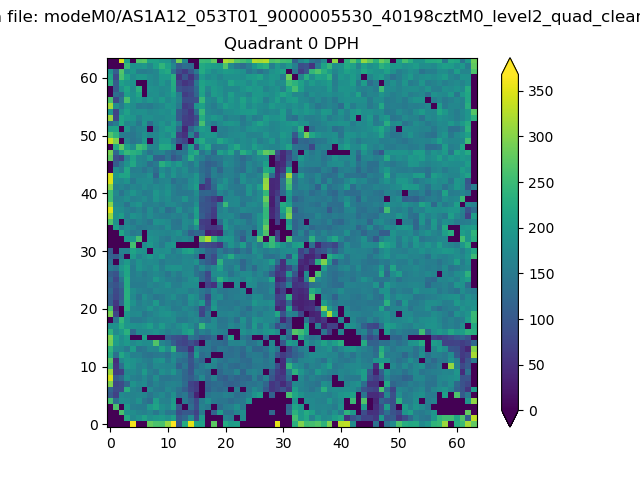 |
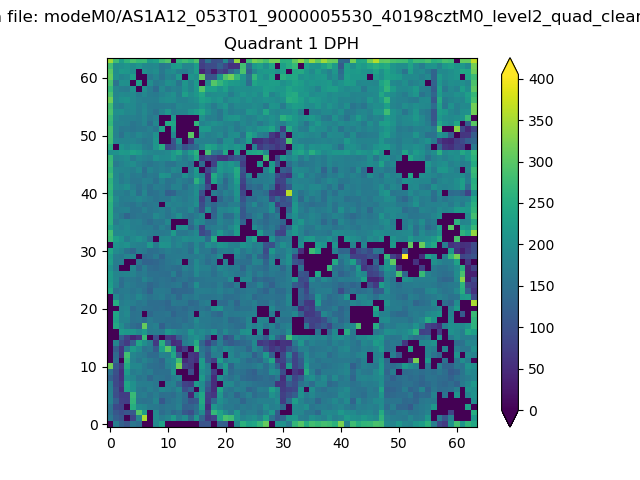 |
Quadrant B |
|---|---|---|---|
| Quadrant D | 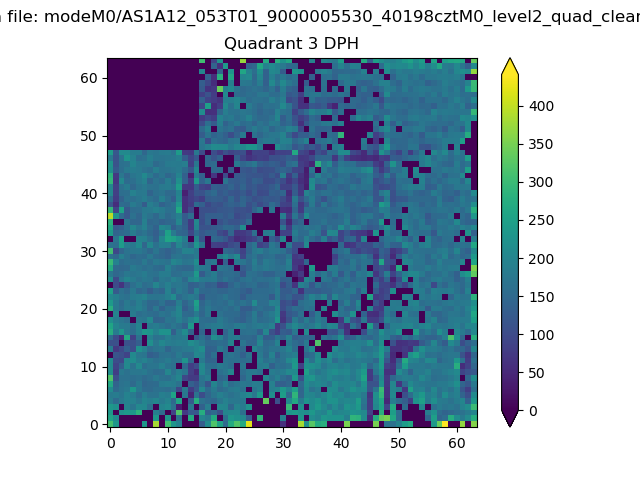 |
 |
Quadrant C |
| Plot type | Count rate plots | Images |
|---|---|---|
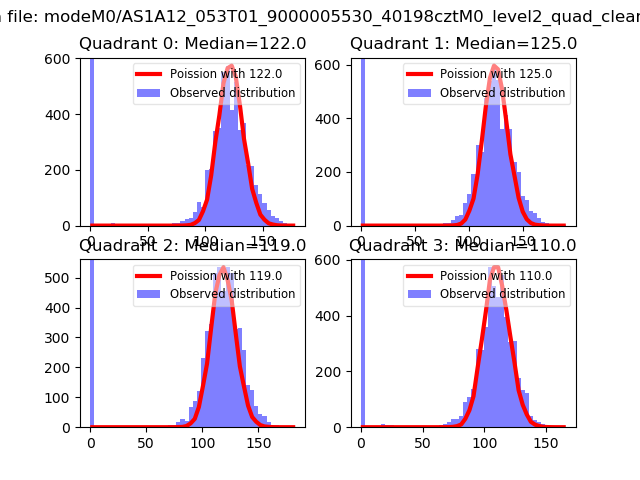
| Comparison with Poisson distribution Blue bars denote a histogram of data divided into 1 sec bins. Red curve is a Poisson curve with rate = median count rate of data. |
 |
 |
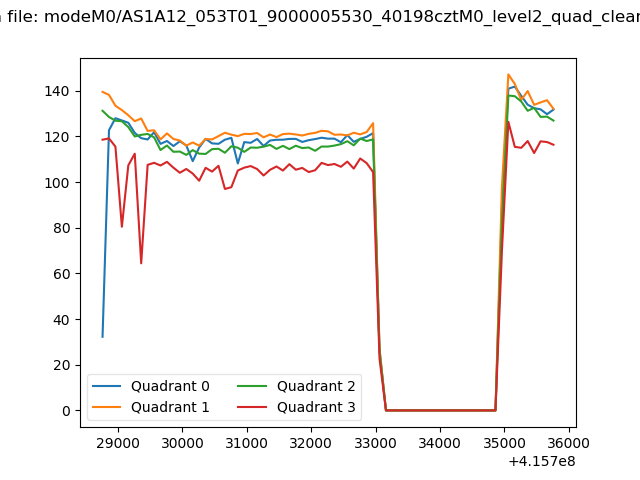
| Quadrant-wise count rates Data is divided into 100 sec bins |
 |
|
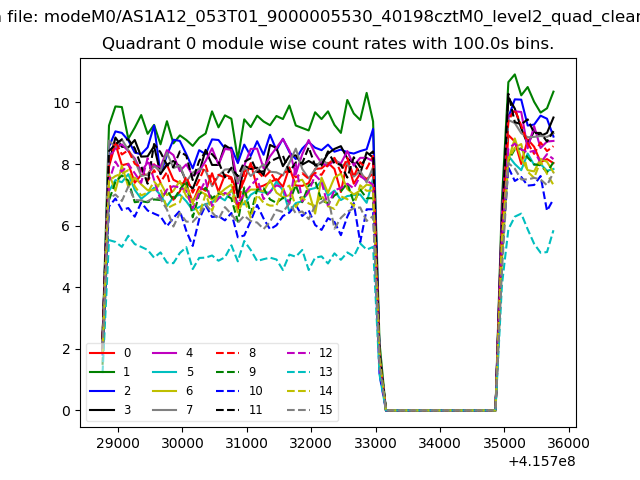
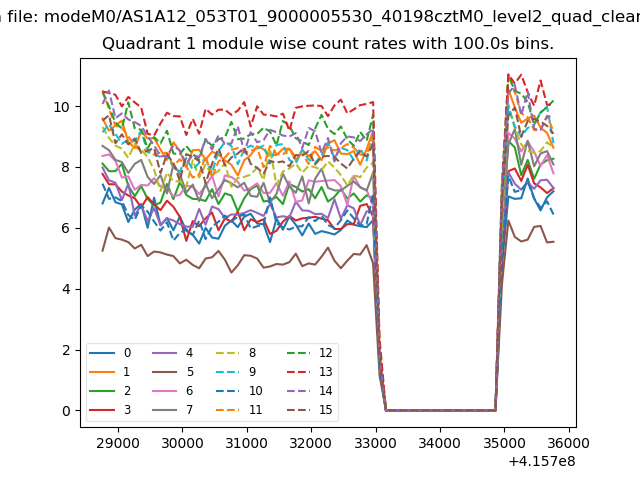
| Module-wise count rates for Quadrant A Data is divided into 100 sec bins |
 |
 |
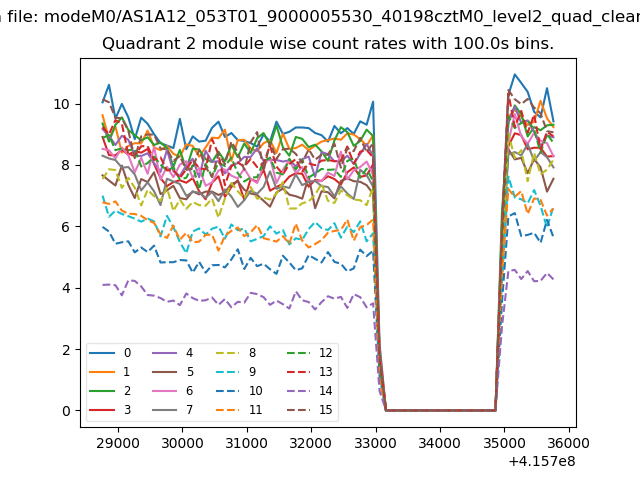
| Module-wise count rates for Quadrant B Data is divided into 100 sec bins |
 |
 |
| Module-wise count rates for Quadrant C Data is divided into 100 sec bins |
 |
 |
| Module-wise count rates for Quadrant D Data is divided into 100 sec bins |
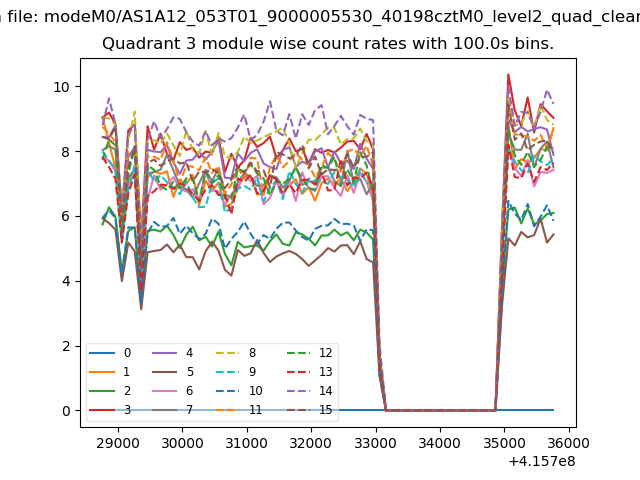 |
 |
| Parameter | Plot |
|---|---|
| CZT HV Monitor | 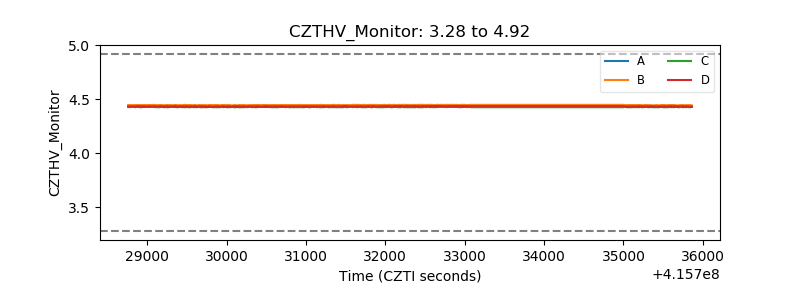 |
| D_VDD | 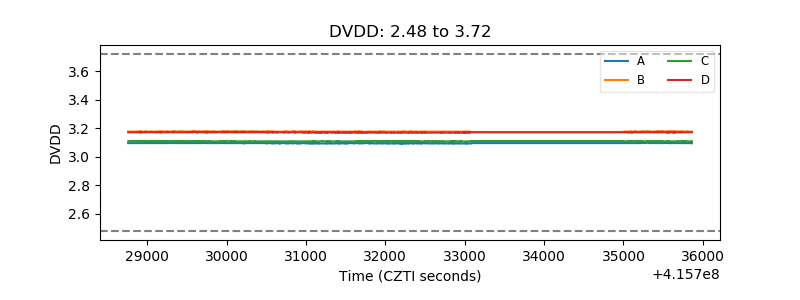 |
| Temperature 1 | 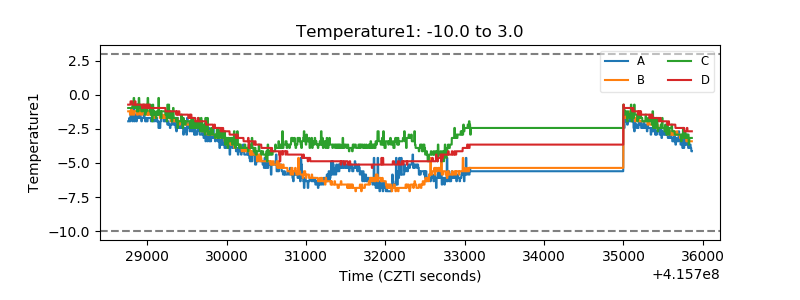 |
| Veto HV Monitor | 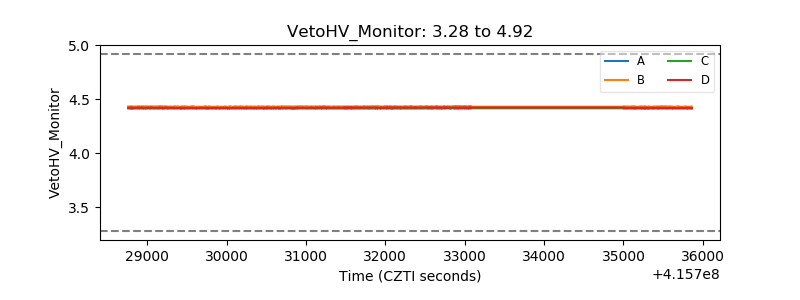 |
| Veto LLD | 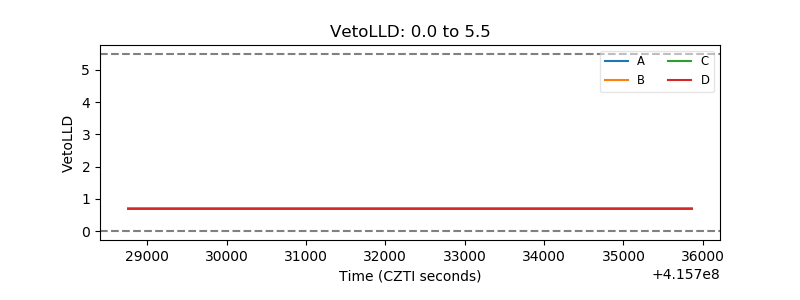 |
| Alpha Counter | 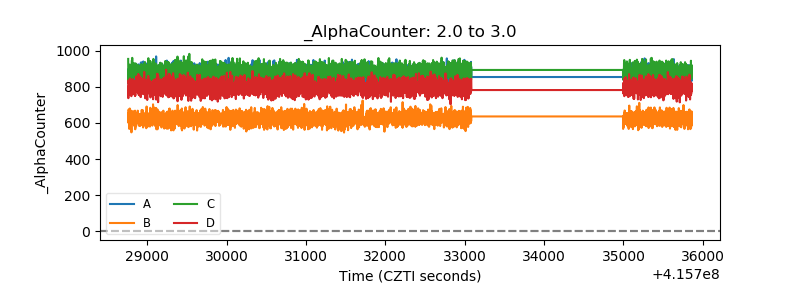 |
| _CPM_Rate | 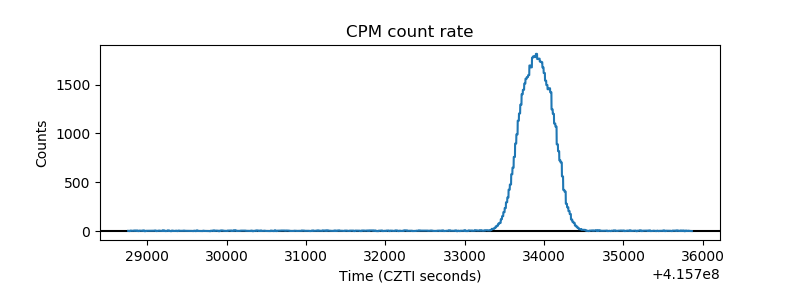 |
| CZT Counter | 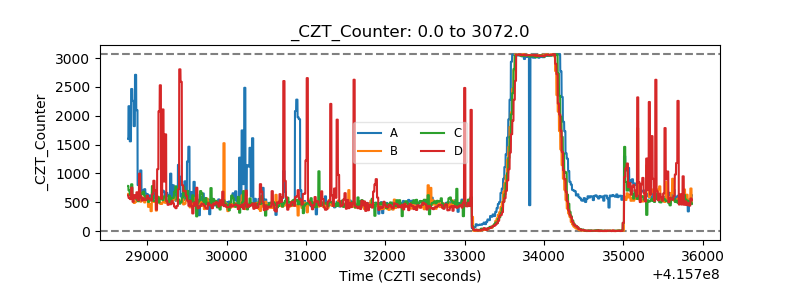 |
| +2.5 Volts monitor | 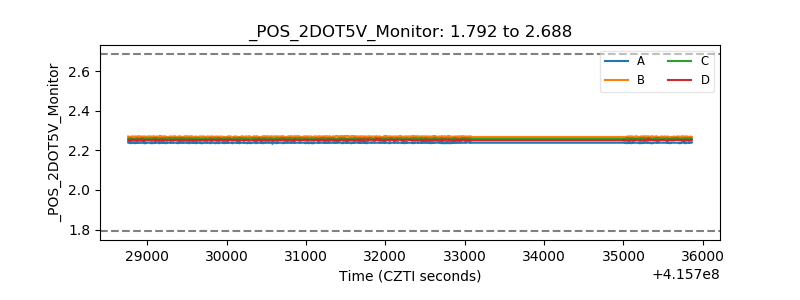 |
| +5 Volts monitor | 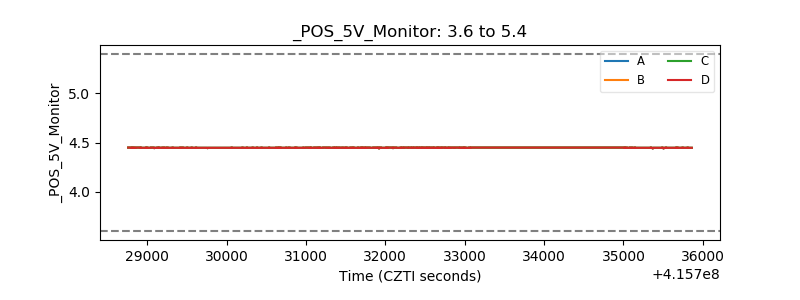 |
| _ROLL_ROT | 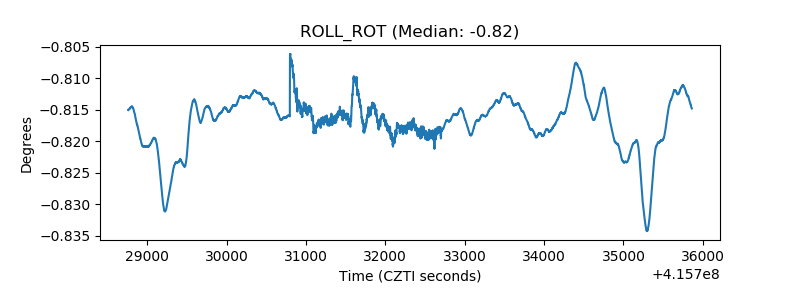 |
| _Roll_DEC | 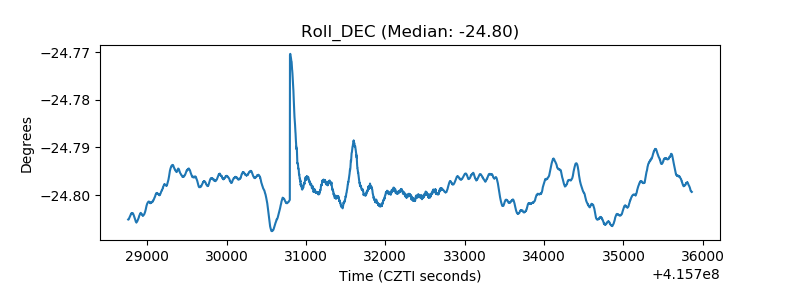 |
| _Roll_RA | 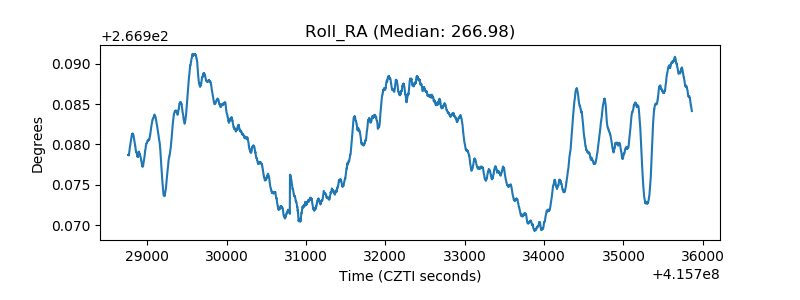 |
| Veto Counter | 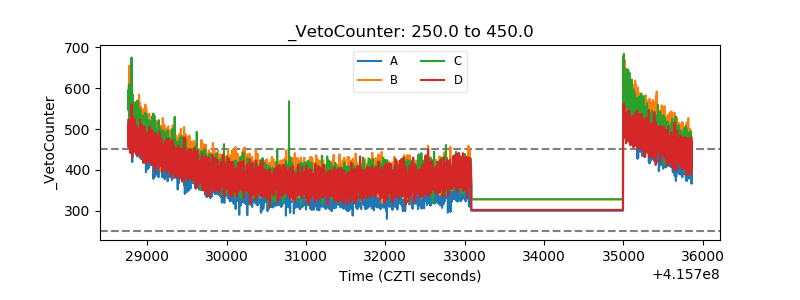 |