| Param | Original file | Final file |
|---|---|---|
| Filename | modeM0/AS1A12_053T01_9000005530_40199cztM0_level2.fits | modeM0/AS1A12_053T01_9000005530_40199cztM0_level2_quad_clean.evt |
| Size (bytes) | 315,964,800 | 91,526,400 |
| Size | 301.3 MB | 87.3 MB |
| Events in quadrant A | 2,820,687 | 627,558 |
| Events in quadrant B | 2,575,445 | 641,812 |
| Events in quadrant C | 2,681,758 | 607,986 |
| Events in quadrant D | 3,234,862 | 548,801 |
| Mode M0 | |||
|---|---|---|---|
| Quadrant | BADHDUFLAG | Total packets | Discarded packets |
| A | 0 | 11430 | 3 |
| B | 0 | 10824 | 2 |
| C | 0 | 10725 | 2 |
| D | 0 | 12877 | 2 |
| Mode SS | |||
|---|---|---|---|
| Quadrant | BADHDUFLAG | Total packets | Discarded packets |
| A | 0 | 102 | 0 |
| B | 0 | 102 | 0 |
| C | 0 | 102 | 0 |
| D | 0 | 102 | 0 |
| Mode M9 | |||
|---|---|---|---|
| Quadrant | BADHDUFLAG | Total packets | Discarded packets |
| A | 0 | 29 | 0 |
| B | 0 | 29 | 0 |
| C | 0 | 29 | 0 |
| D | 0 | 30 | 0 |
| Quadrant | Total seconds | Saturated seconds | Saturation percentage |
|---|---|---|---|
| A | 4920 | 21 | 0.426829% |
| B | 4920 | 39 | 0.792683% |
| C | 4920 | 37 | 0.752033% |
| D | 4920 | 149 | 3.028455% |
Noise dominated data is calculated using 1-second bins in cleaned event files. If a bin has >2000 counts, and if more than 50% of those come from <1% of pixels, then it is considered to be noise-dominated and hence unusable.
| Quadrant | # 1 sec bins | Bins with >0 counts | Bins with >2000 counts | High rate bins dominated by noise | Noise dominated (total time) | Noise dominated (detector-on time) | Marked lightcurve |
|---|---|---|---|---|---|---|---|
| A | 6953 | 4921 | 8 | 8 | 0.12% | 0.16% | 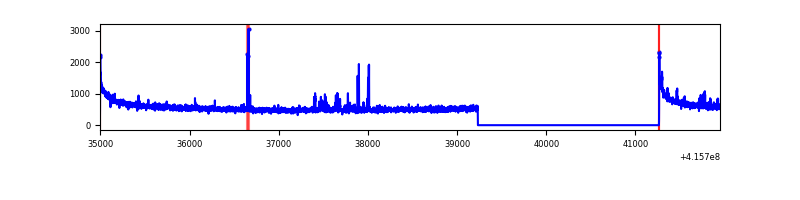 |
| B | 6953 | 4921 | 18 | 18 | 0.26% | 0.37% | 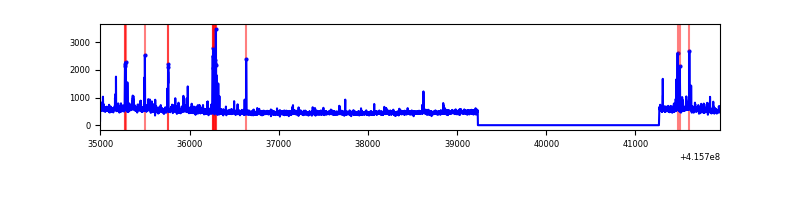 |
| C | 6953 | 4921 | 22 | 22 | 0.32% | 0.45% | 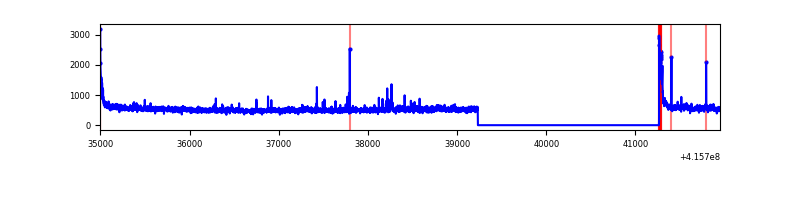 |
| D | 6953 | 4921 | 131 | 131 | 1.88% | 2.66% | 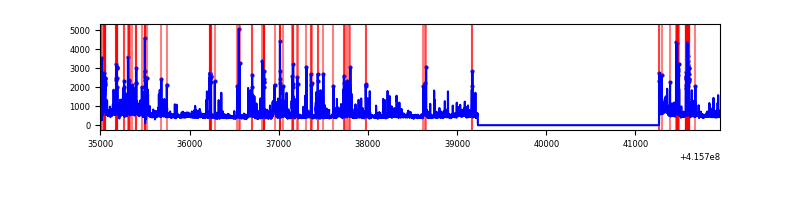 |
Top three noisy pixels from each quadrant. If the there are fewer than three noisy pixels in the level2.evt file, extra rows are filled as -1
| Pixel properties | Quadrant properties | ||||||
|---|---|---|---|---|---|---|---|
| Quadrant | DetID | PixID | Counts | Sigma | Mean | Median | Sigma |
| A | 10 | 83 | 464202 | 3895.39 | 587 | 576 | 119.0 |
| A | 2 | 79 | 66098 | 550.52 | 587 | 576 | 119.0 |
| A | 13 | 248 | 13836 | 111.41 | 587 | 576 | 119.0 |
| B | 5 | 255 | 135015 | 1210.78 | 587 | 573 | 111.0 |
| B | 0 | 230 | 35601 | 315.46 | 587 | 573 | 111.0 |
| B | 4 | 171 | 27058 | 238.52 | 587 | 573 | 111.0 |
| C | 15 | 214 | 205467 | 1544.33 | 573 | 578 | 132.7 |
| C | 0 | 10 | 103051 | 772.38 | 573 | 578 | 132.7 |
| C | 4 | 254 | 76383 | 571.37 | 573 | 578 | 132.7 |
| D | 12 | 227 | 616490 | 4488.34 | 563 | 548 | 137.2 |
| D | 12 | 79 | 100975 | 731.81 | 563 | 548 | 137.2 |
| D | 13 | 249 | 99255 | 719.27 | 563 | 548 | 137.2 |
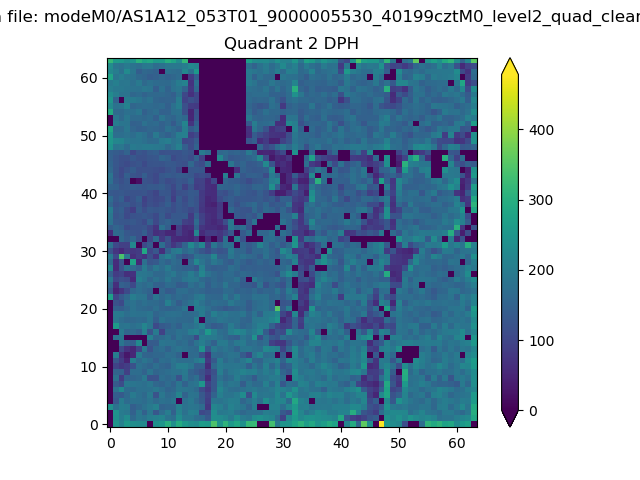
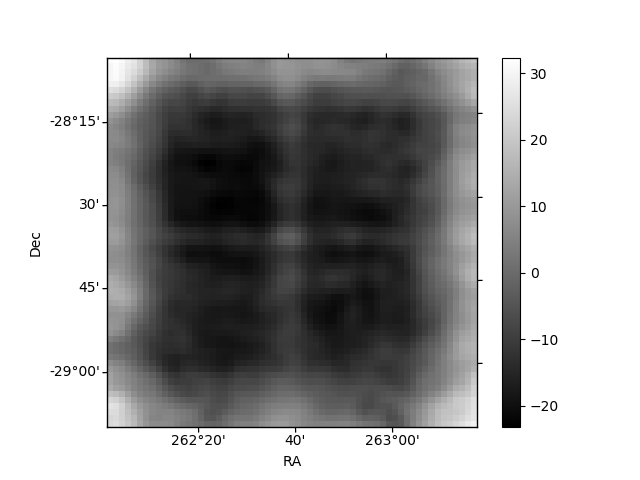
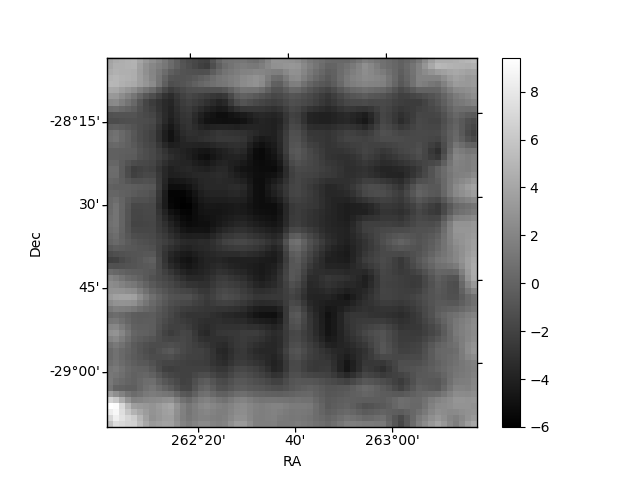
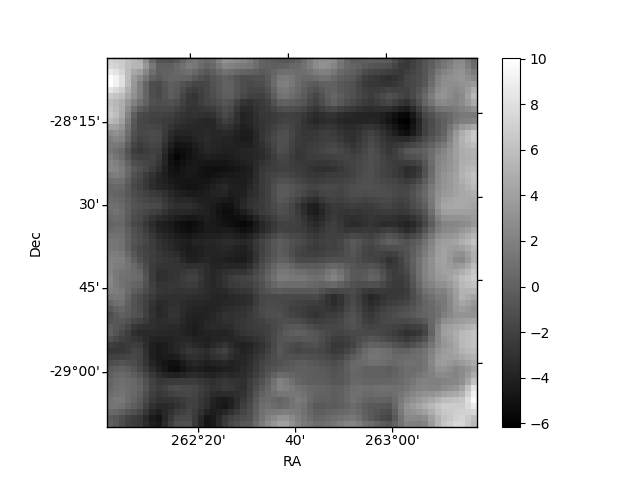
Histogram calculated using DETX and DETY for each event in the final _common_clean file
| Quadrant A | 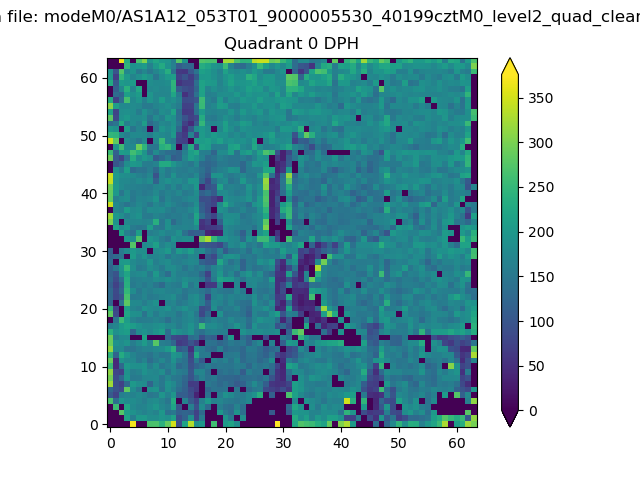 |
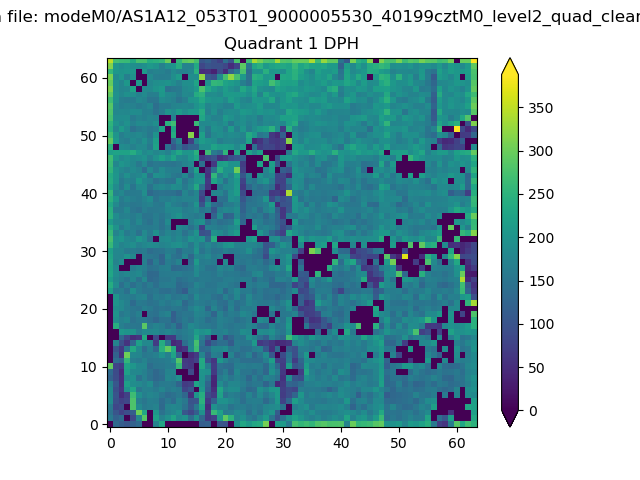 |
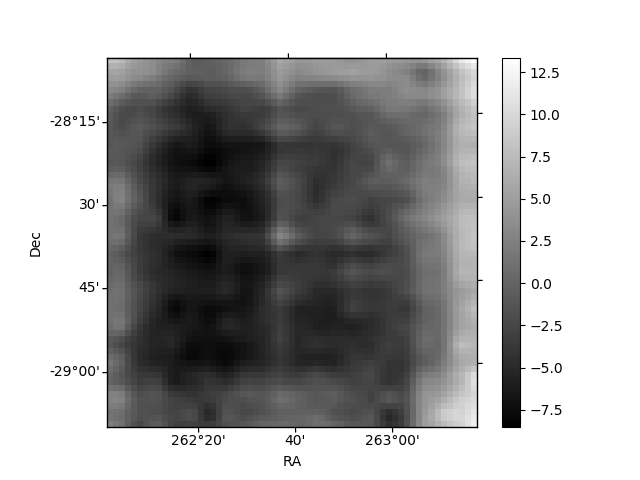
Quadrant B |
|---|---|---|---|
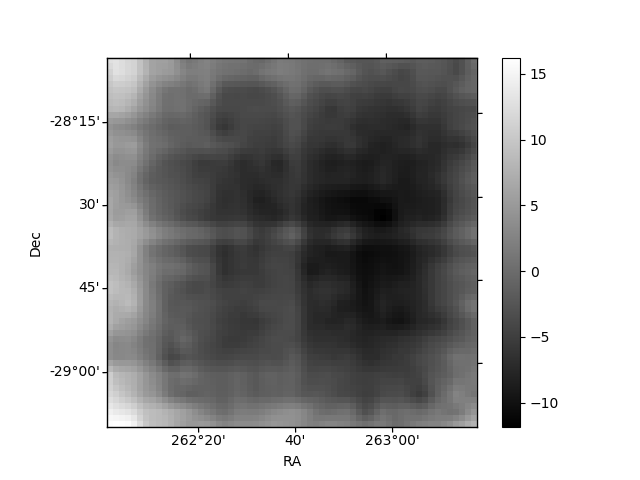
| Quadrant D | 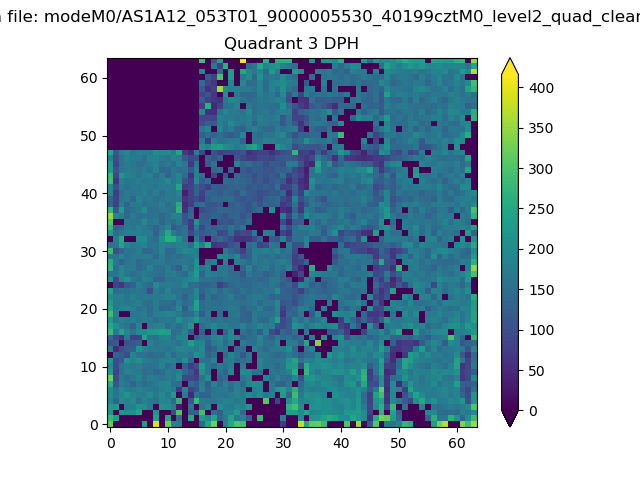 |
 |
Quadrant C |
| Plot type | Count rate plots | Images |
|---|---|---|
| Comparison with Poisson distribution Blue bars denote a histogram of data divided into 1 sec bins. Red curve is a Poisson curve with rate = median count rate of data. |
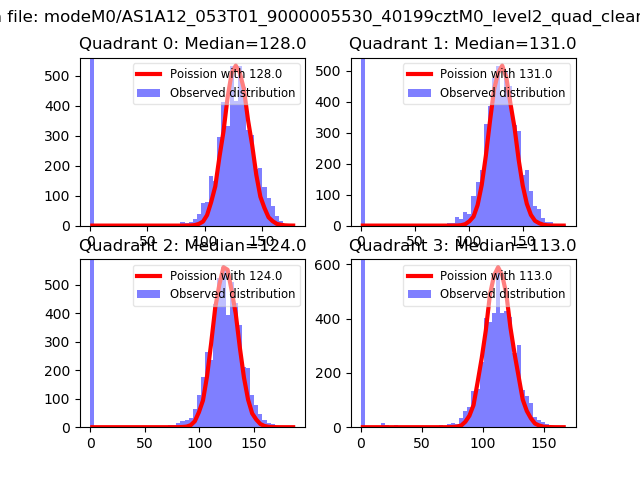 |
 |
| Quadrant-wise count rates Data is divided into 100 sec bins |
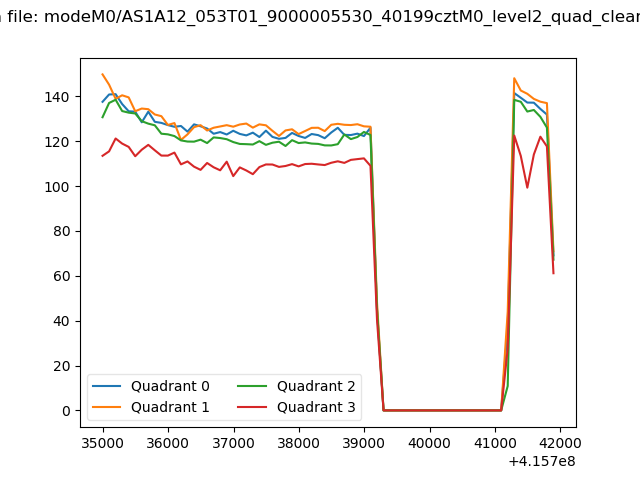 |
|
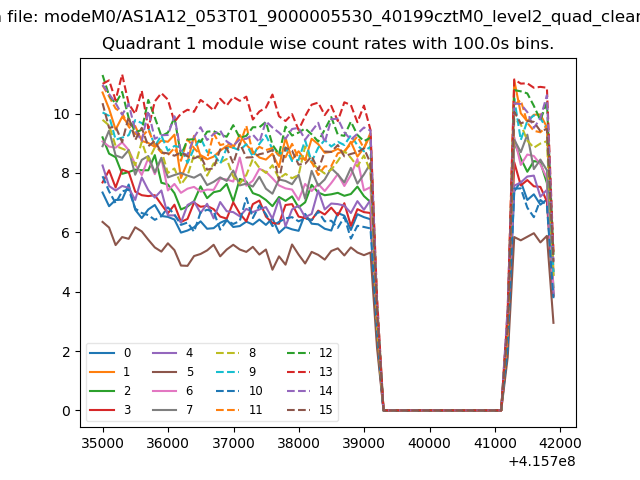
| Module-wise count rates for Quadrant A Data is divided into 100 sec bins |
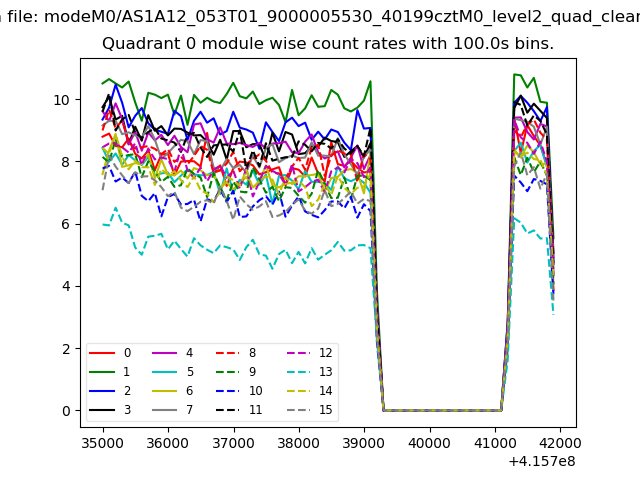 |
 |
| Module-wise count rates for Quadrant B Data is divided into 100 sec bins |
 |
 |
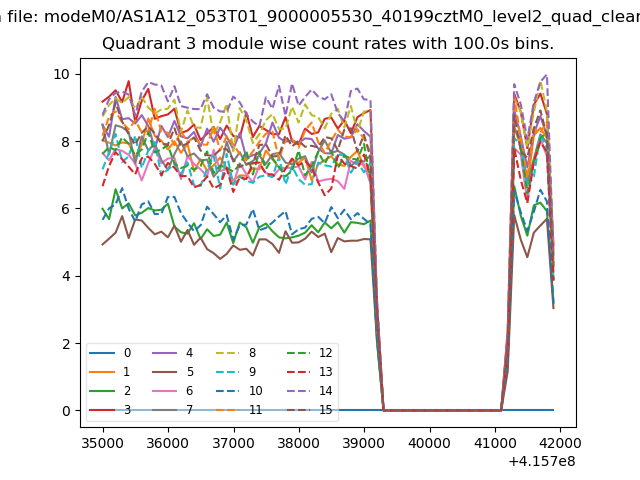
| Module-wise count rates for Quadrant C Data is divided into 100 sec bins |
 |
 |
| Module-wise count rates for Quadrant D Data is divided into 100 sec bins |
 |
 |
| Parameter | Plot |
|---|---|
| CZT HV Monitor | 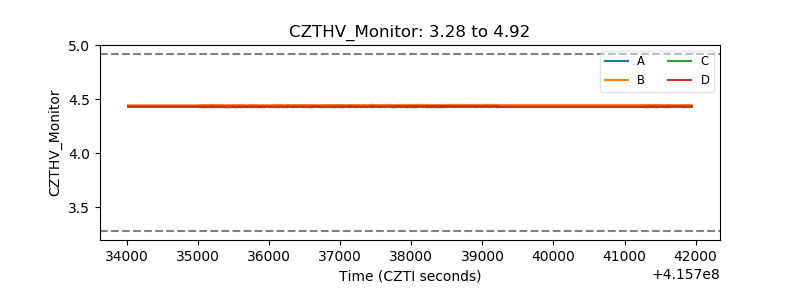 |
| D_VDD | 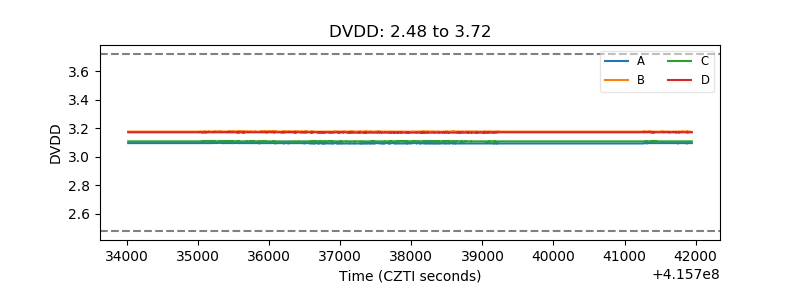 |
| Temperature 1 | 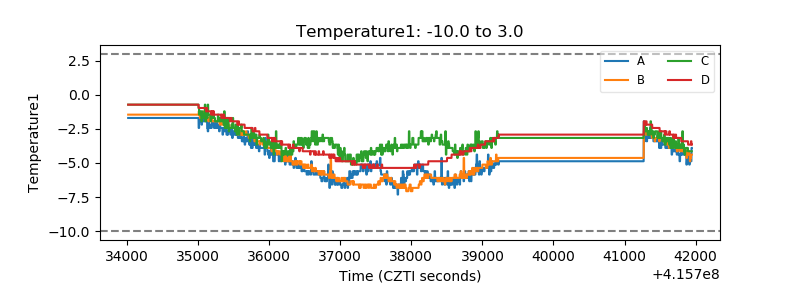 |
| Veto HV Monitor | 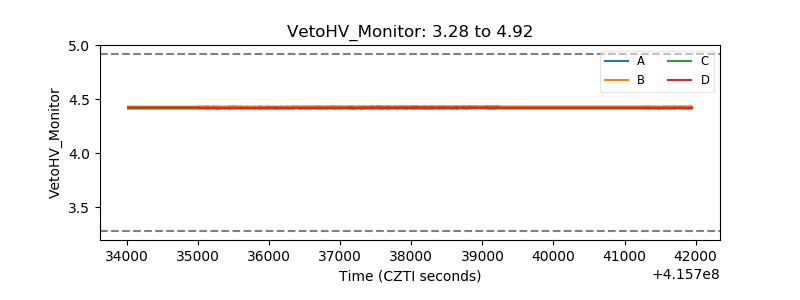 |
| Veto LLD | 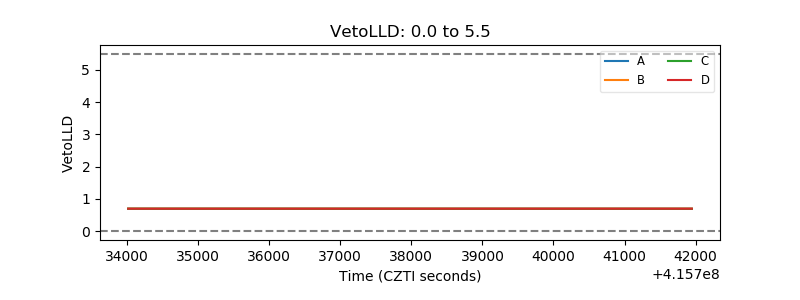 |
| Alpha Counter | 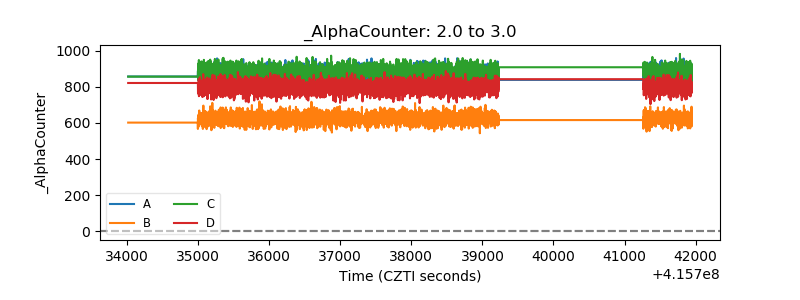 |
| _CPM_Rate | 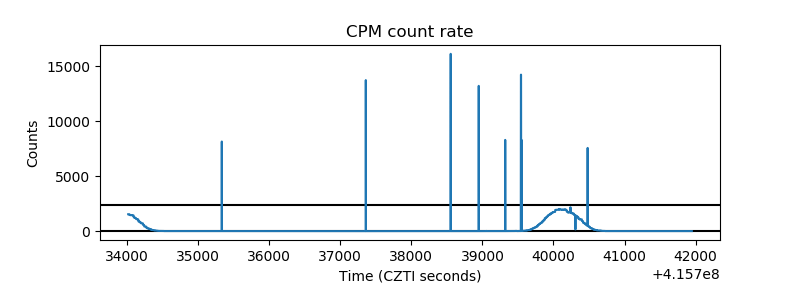 |
| CZT Counter | 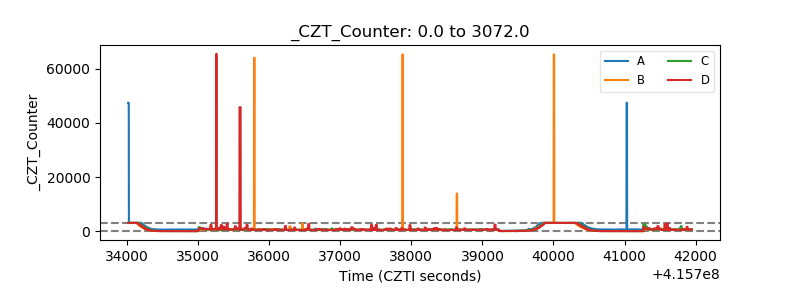 |
| +2.5 Volts monitor | 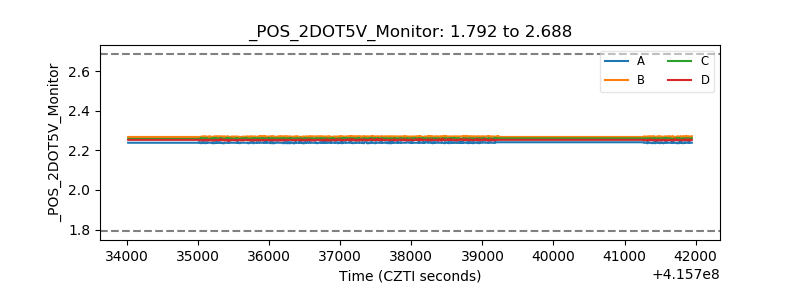 |
| +5 Volts monitor | 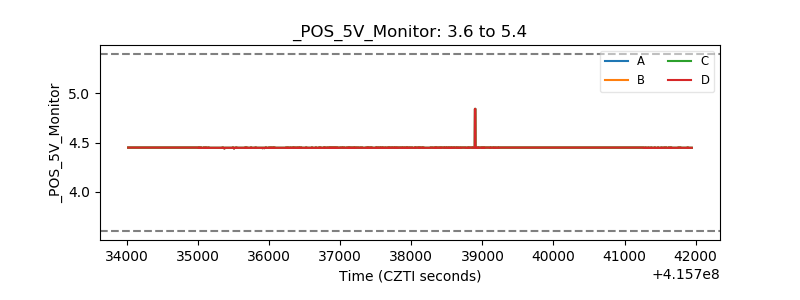 |
| _ROLL_ROT | 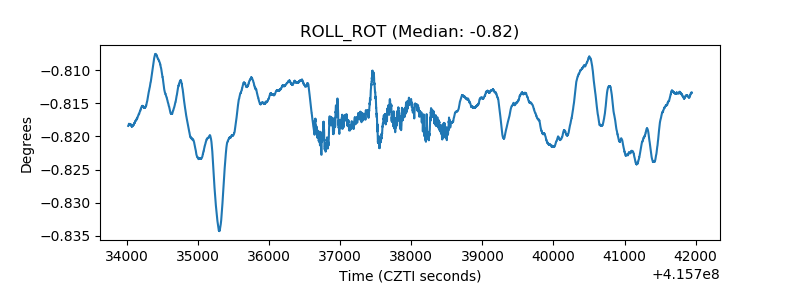 |
| _Roll_DEC | 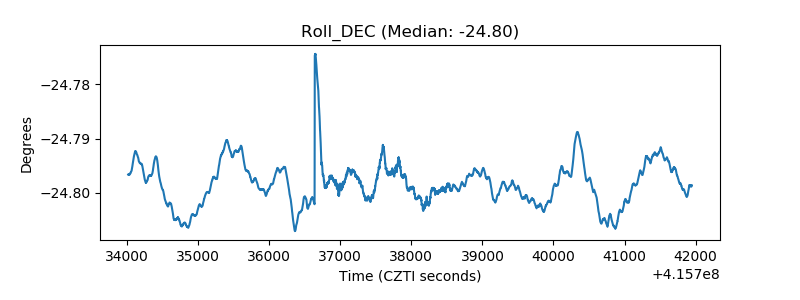 |
| _Roll_RA | 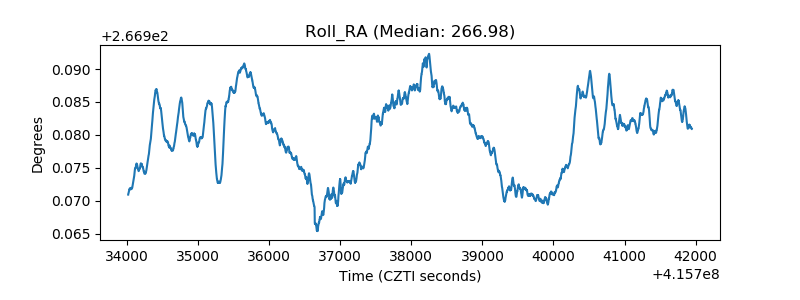 |
| Veto Counter | 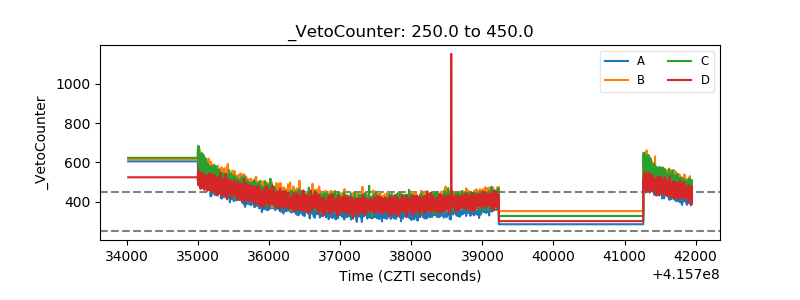 |