| Param | Original file | Final file |
|---|---|---|
| Filename | modeM0/AS1A12_053T01_9000005530_40200cztM0_level2.fits | modeM0/AS1A12_053T01_9000005530_40200cztM0_level2_quad_clean.evt |
| Size (bytes) | 308,724,480 | 89,838,720 |
| Size | 294.4 MB | 85.7 MB |
| Events in quadrant A | 2,828,005 | 612,423 |
| Events in quadrant B | 2,468,023 | 634,243 |
| Events in quadrant C | 2,806,874 | 594,367 |
| Events in quadrant D | 2,947,864 | 540,038 |
| Mode M0 | |||
|---|---|---|---|
| Quadrant | BADHDUFLAG | Total packets | Discarded packets |
| A | 0 | 11385 | 3 |
| B | 0 | 10428 | 2 |
| C | 0 | 11204 | 2 |
| D | 0 | 12080 | 2 |
| Mode SS | |||
|---|---|---|---|
| Quadrant | BADHDUFLAG | Total packets | Discarded packets |
| A | 0 | 98 | 0 |
| B | 0 | 98 | 0 |
| C | 0 | 98 | 0 |
| D | 0 | 98 | 0 |
| Mode M9 | |||
|---|---|---|---|
| Quadrant | BADHDUFLAG | Total packets | Discarded packets |
| A | 0 | 38 | 0 |
| B | 0 | 38 | 0 |
| C | 0 | 38 | 0 |
| D | 0 | 39 | 0 |
| Quadrant | Total seconds | Saturated seconds | Saturation percentage |
|---|---|---|---|
| A | 4841 | 49 | 1.012188% |
| B | 4841 | 13 | 0.268540% |
| C | 4841 | 55 | 1.136129% |
| D | 4841 | 121 | 2.499484% |
Noise dominated data is calculated using 1-second bins in cleaned event files. If a bin has >2000 counts, and if more than 50% of those come from <1% of pixels, then it is considered to be noise-dominated and hence unusable.
| Quadrant | # 1 sec bins | Bins with >0 counts | Bins with >2000 counts | High rate bins dominated by noise | Noise dominated (total time) | Noise dominated (detector-on time) | Marked lightcurve |
|---|---|---|---|---|---|---|---|
| A | 6963 | 4842 | 36 | 36 | 0.52% | 0.74% | 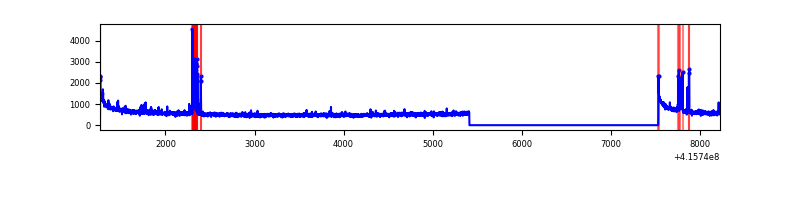 |
| B | 6963 | 4842 | 4 | 4 | 0.06% | 0.08% | 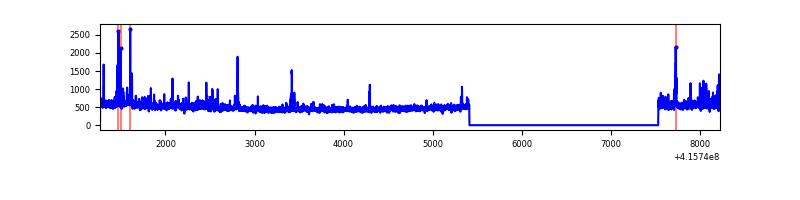 |
| C | 6963 | 4842 | 42 | 42 | 0.60% | 0.87% | 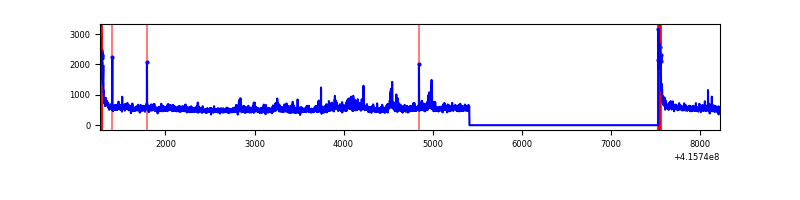 |
| D | 6963 | 4842 | 93 | 93 | 1.34% | 1.92% | 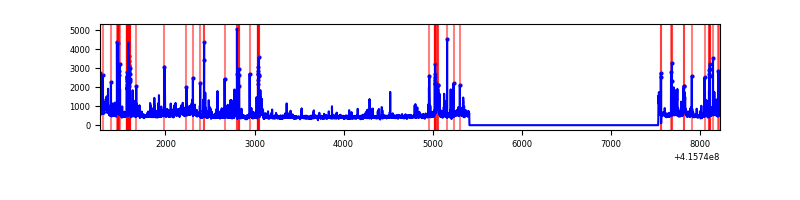 |
Top three noisy pixels from each quadrant. If the there are fewer than three noisy pixels in the level2.evt file, extra rows are filled as -1
| Pixel properties | Quadrant properties | ||||||
|---|---|---|---|---|---|---|---|
| Quadrant | DetID | PixID | Counts | Sigma | Mean | Median | Sigma |
| A | 10 | 83 | 445471 | 3845.3 | 570 | 560 | 115.7 |
| A | 13 | 248 | 106847 | 918.62 | 570 | 560 | 115.7 |
| A | 9 | 143 | 32603 | 276.94 | 570 | 560 | 115.7 |
| B | 4 | 171 | 65437 | 585.39 | 574 | 559 | 110.8 |
| B | 5 | 255 | 57243 | 511.46 | 574 | 559 | 110.8 |
| B | 0 | 229 | 26959 | 238.2 | 574 | 559 | 110.8 |
| C | 15 | 214 | 203910 | 1571.0 | 560 | 567 | 129.4 |
| C | 4 | 254 | 147700 | 1136.73 | 560 | 567 | 129.4 |
| C | 0 | 10 | 138073 | 1062.36 | 560 | 567 | 129.4 |
| D | 12 | 227 | 397559 | 2938.17 | 550 | 535 | 135.1 |
| D | 12 | 79 | 124903 | 920.38 | 550 | 535 | 135.1 |
| D | 1 | 47 | 100852 | 742.4 | 550 | 535 | 135.1 |
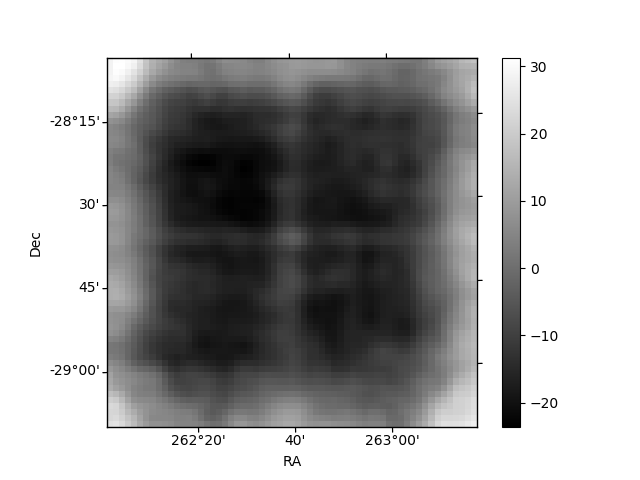
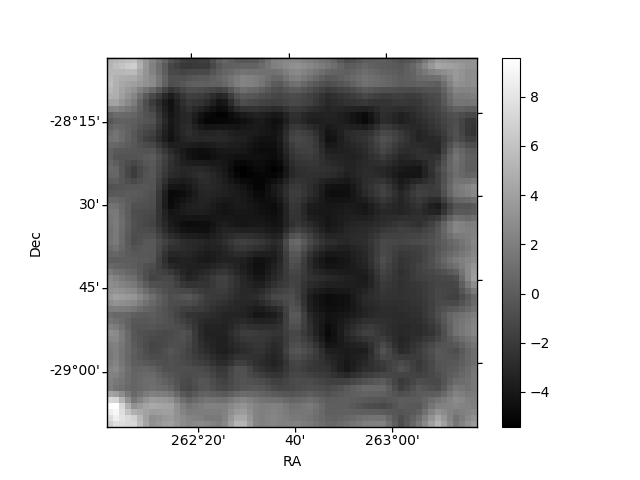
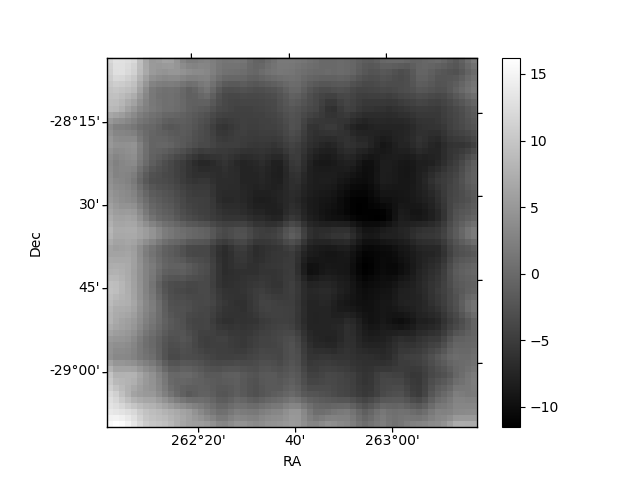
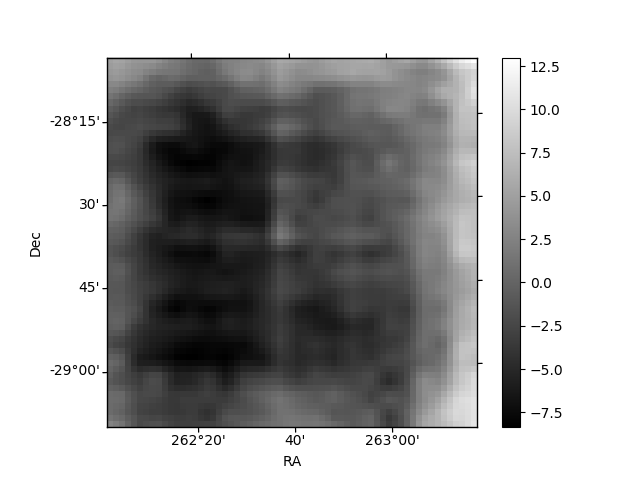
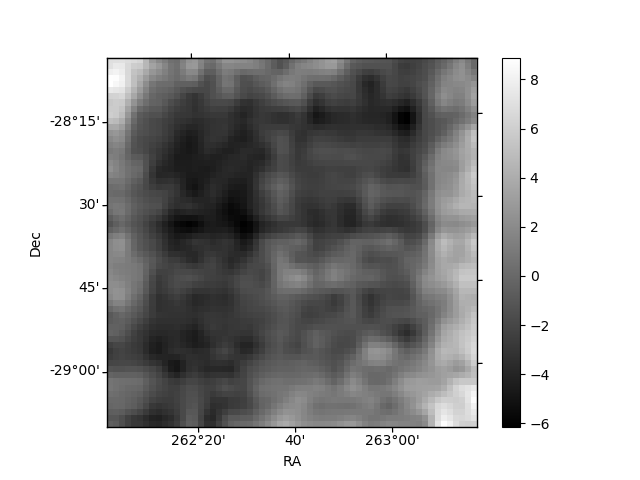
Histogram calculated using DETX and DETY for each event in the final _common_clean file
| Quadrant A | 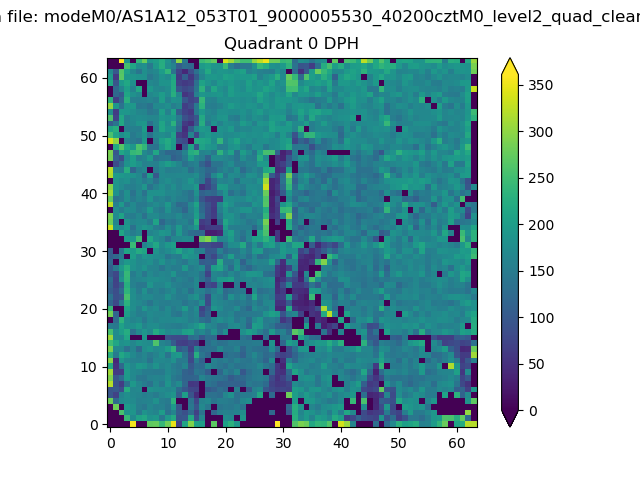 |
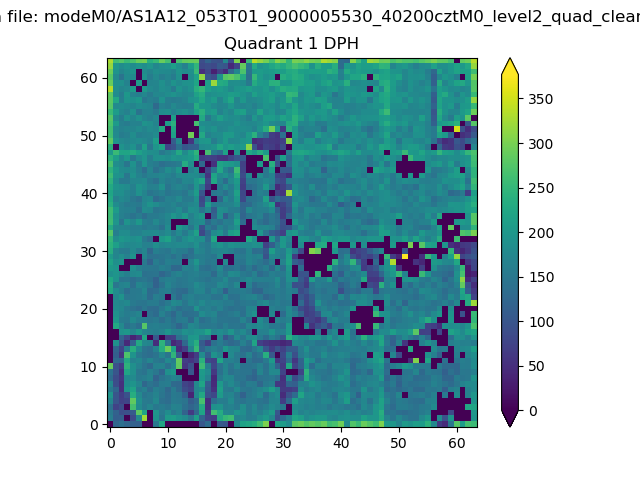 |
Quadrant B |
|---|---|---|---|
| Quadrant D | 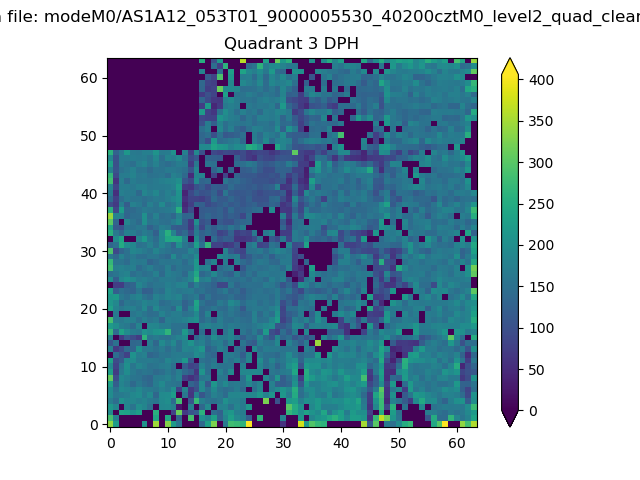 |
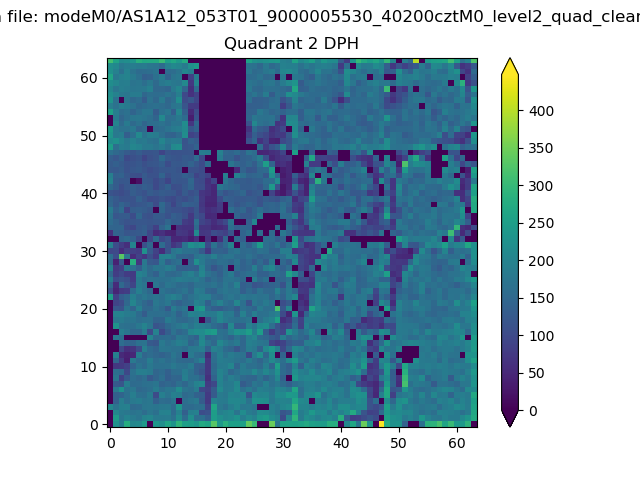 |
Quadrant C |
| Plot type | Count rate plots | Images |
|---|---|---|
| Comparison with Poisson distribution Blue bars denote a histogram of data divided into 1 sec bins. Red curve is a Poisson curve with rate = median count rate of data. |
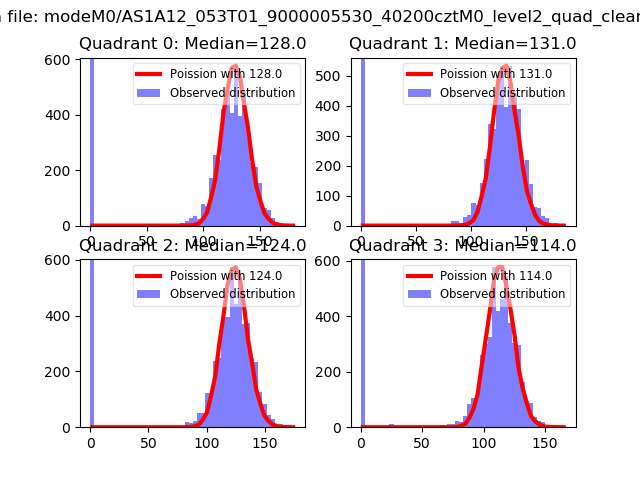 |
 |
| Quadrant-wise count rates Data is divided into 100 sec bins |
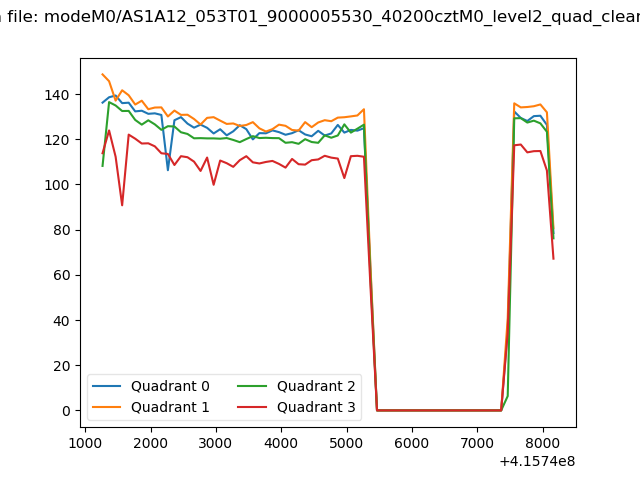 |
|
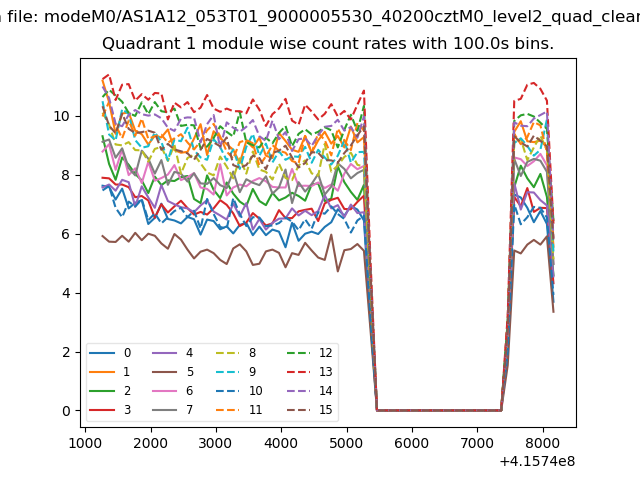
| Module-wise count rates for Quadrant A Data is divided into 100 sec bins |
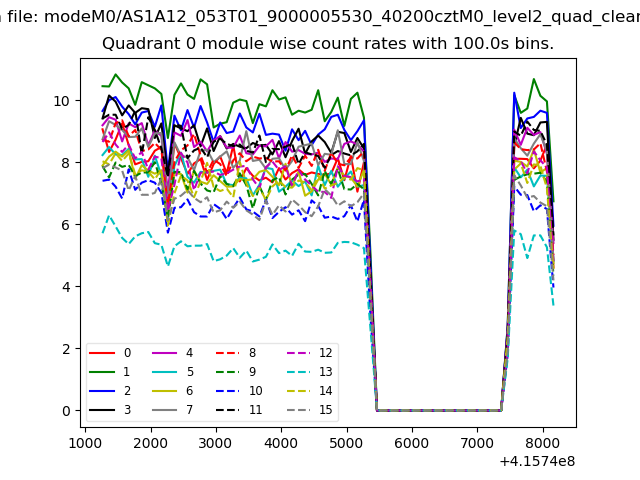 |
 |
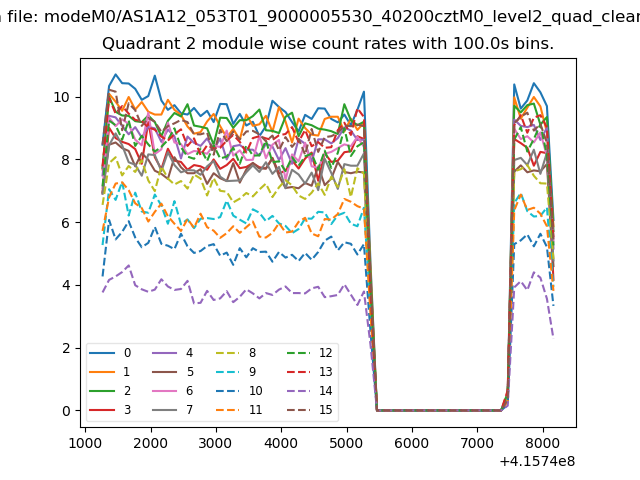
| Module-wise count rates for Quadrant B Data is divided into 100 sec bins |
 |
 |
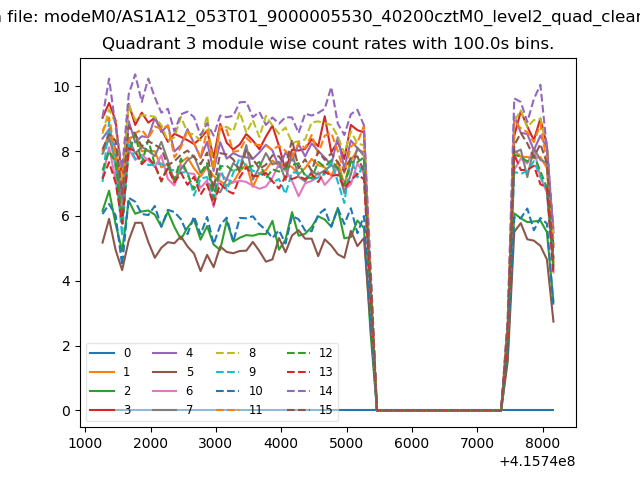
| Module-wise count rates for Quadrant C Data is divided into 100 sec bins |
 |
 |
| Module-wise count rates for Quadrant D Data is divided into 100 sec bins |
 |
 |
| Parameter | Plot |
|---|---|
| CZT HV Monitor | 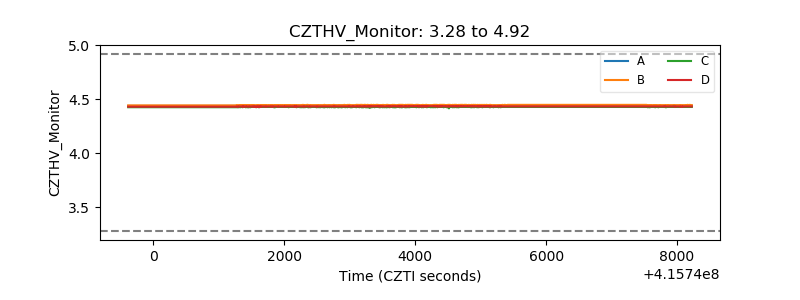 |
| D_VDD | 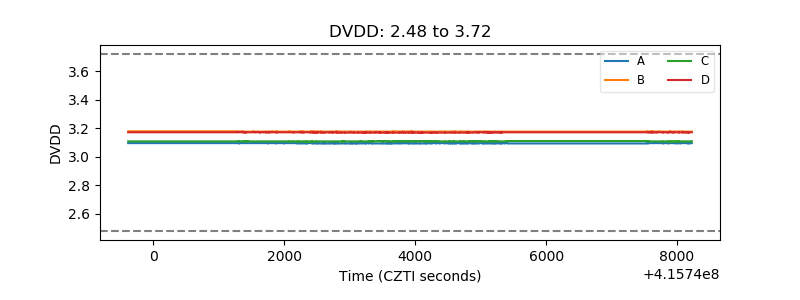 |
| Temperature 1 | 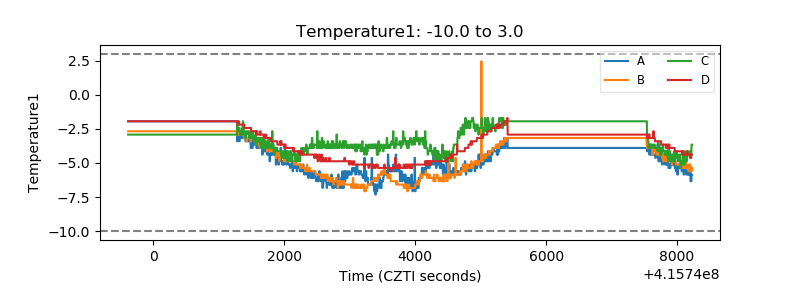 |
| Veto HV Monitor | 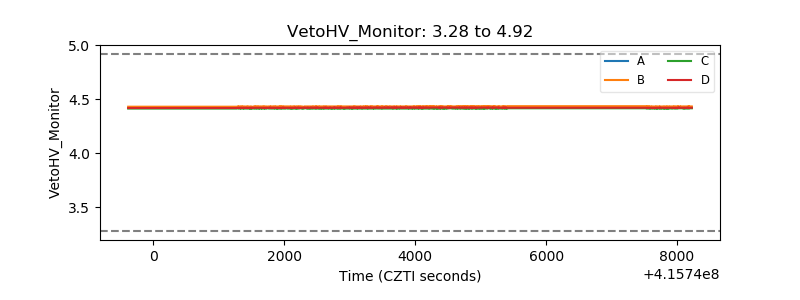 |
| Veto LLD | 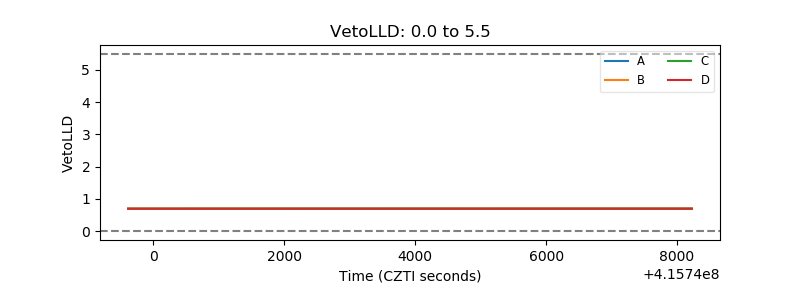 |
| Alpha Counter | 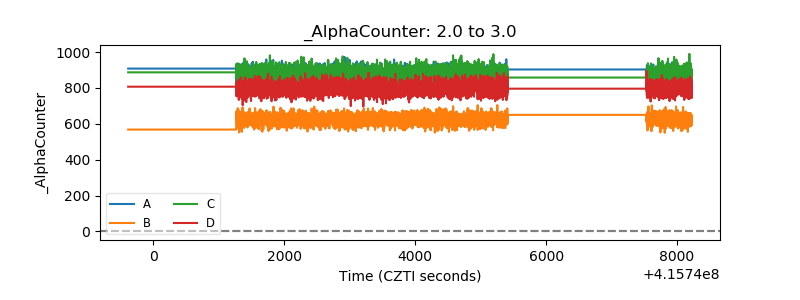 |
| _CPM_Rate | 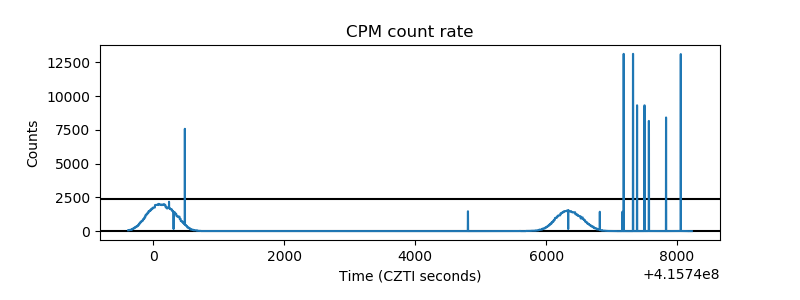 |
| CZT Counter | 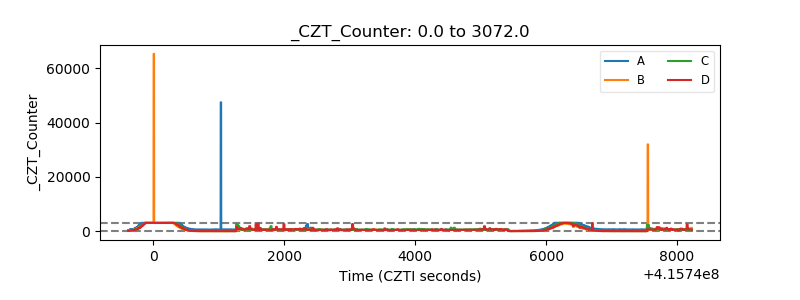 |
| +2.5 Volts monitor | 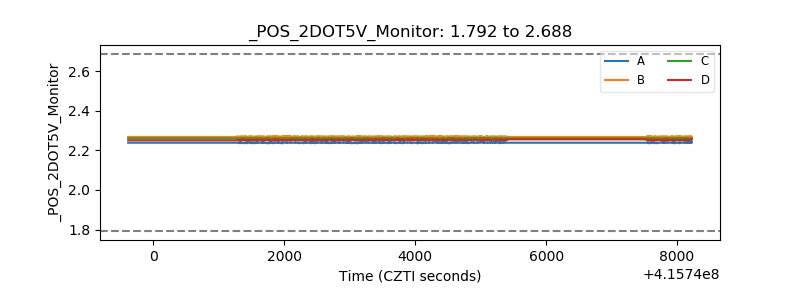 |
| +5 Volts monitor |  |
| _ROLL_ROT | 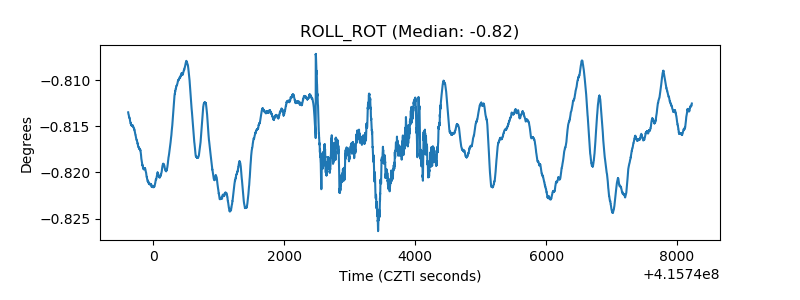 |
| _Roll_DEC | 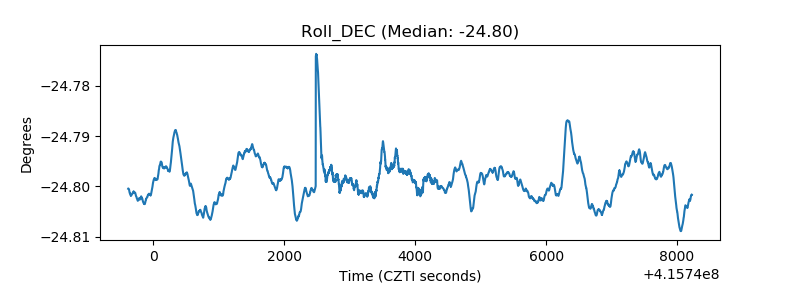 |
| _Roll_RA | 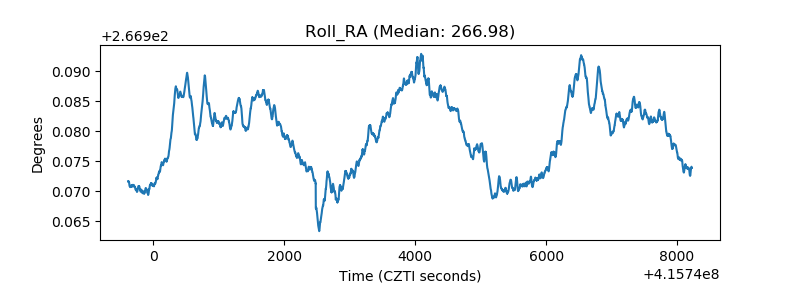 |
| Veto Counter | 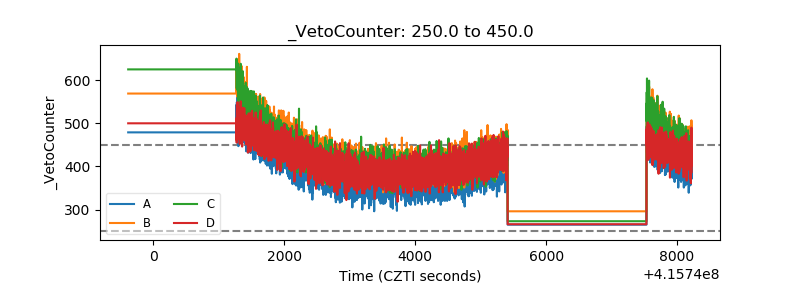 |