| Param | Original file | Final file |
|---|---|---|
| Filename | modeM0/AS1A12_053T01_9000005530_40201cztM0_level2.fits | modeM0/AS1A12_053T01_9000005530_40201cztM0_level2_quad_clean.evt |
| Size (bytes) | 373,158,720 | 84,980,160 |
| Size | 355.9 MB | 81.0 MB |
| Events in quadrant A | 2,848,158 | 589,614 |
| Events in quadrant B | 2,478,599 | 616,725 |
| Events in quadrant C | 2,823,688 | 579,456 |
| Events in quadrant D | 5,281,375 | 444,070 |
| Mode M0 | |||
|---|---|---|---|
| Quadrant | BADHDUFLAG | Total packets | Discarded packets |
| A | 0 | 11467 | 3 |
| B | 0 | 10619 | 2 |
| C | 0 | 11325 | 2 |
| D | 0 | 19022 | 2 |
| Mode SS | |||
|---|---|---|---|
| Quadrant | BADHDUFLAG | Total packets | Discarded packets |
| A | 0 | 100 | 0 |
| B | 0 | 100 | 0 |
| C | 0 | 100 | 0 |
| D | 0 | 100 | 0 |
| Mode M9 | |||
|---|---|---|---|
| Quadrant | BADHDUFLAG | Total packets | Discarded packets |
| A | 0 | 30 | 0 |
| B | 0 | 30 | 0 |
| C | 0 | 30 | 0 |
| D | 0 | 31 | 0 |
| Quadrant | Total seconds | Saturated seconds | Saturation percentage |
|---|---|---|---|
| A | 4896 | 79 | 1.613562% |
| B | 4896 | 24 | 0.490196% |
| C | 4896 | 66 | 1.348039% |
| D | 4896 | 978 | 19.975490% |
Noise dominated data is calculated using 1-second bins in cleaned event files. If a bin has >2000 counts, and if more than 50% of those come from <1% of pixels, then it is considered to be noise-dominated and hence unusable.
| Quadrant | # 1 sec bins | Bins with >0 counts | Bins with >2000 counts | High rate bins dominated by noise | Noise dominated (total time) | Noise dominated (detector-on time) | Marked lightcurve |
|---|---|---|---|---|---|---|---|
| A | 7018 | 4897 | 56 | 56 | 0.80% | 1.14% | 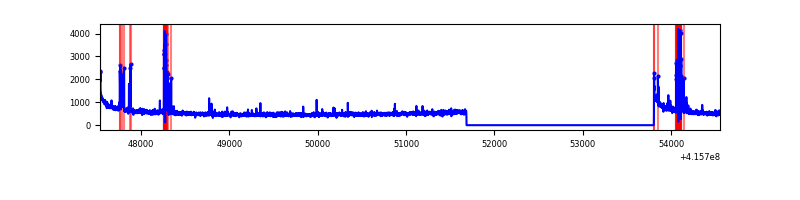 |
| B | 7018 | 4897 | 12 | 12 | 0.17% | 0.25% | 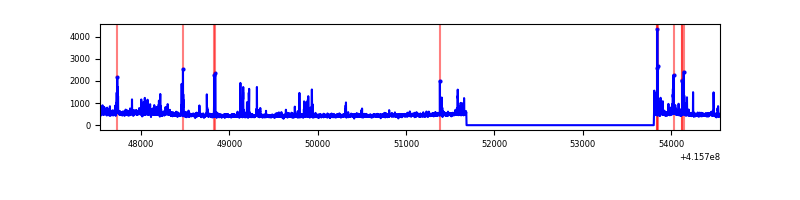 |
| C | 7018 | 4897 | 55 | 55 | 0.78% | 1.12% | 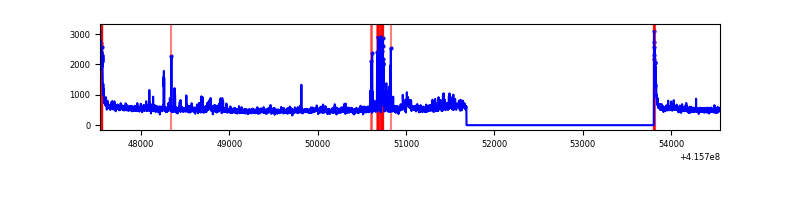 |
| D | 7017 | 4896 | 874 | 874 | 12.46% | 17.85% | 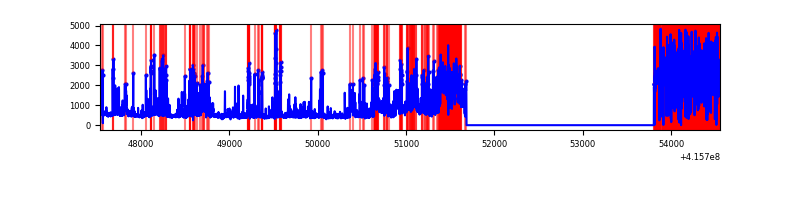 |
Top three noisy pixels from each quadrant. If the there are fewer than three noisy pixels in the level2.evt file, extra rows are filled as -1
| Pixel properties | Quadrant properties | ||||||
|---|---|---|---|---|---|---|---|
| Quadrant | DetID | PixID | Counts | Sigma | Mean | Median | Sigma |
| A | 10 | 83 | 436435 | 3815.37 | 556 | 545 | 114.2 |
| A | 13 | 248 | 199902 | 1744.98 | 556 | 545 | 114.2 |
| A | 9 | 143 | 30797 | 264.8 | 556 | 545 | 114.2 |
| B | 5 | 255 | 149465 | 1371.98 | 561 | 546 | 108.5 |
| B | 4 | 171 | 55438 | 505.72 | 561 | 546 | 108.5 |
| B | 0 | 229 | 25712 | 231.85 | 561 | 546 | 108.5 |
| C | 15 | 214 | 204658 | 1572.98 | 550 | 555 | 129.8 |
| C | 14 | 254 | 145701 | 1118.61 | 550 | 555 | 129.8 |
| C | 4 | 254 | 133043 | 1021.06 | 550 | 555 | 129.8 |
| D | 12 | 227 | 3105521 | 26256.06 | 477 | 463 | 118.3 |
| D | 12 | 218 | 132984 | 1120.58 | 477 | 463 | 118.3 |
| D | 12 | 79 | 78435 | 659.32 | 477 | 463 | 118.3 |
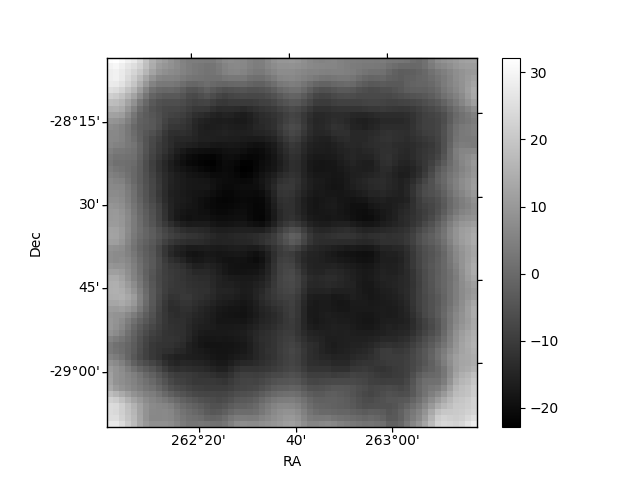
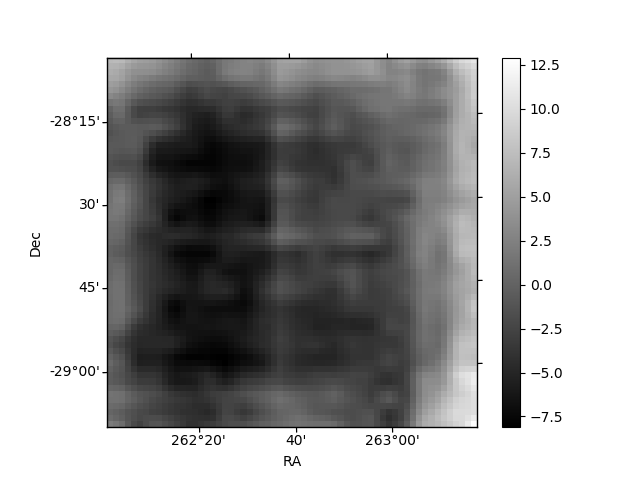
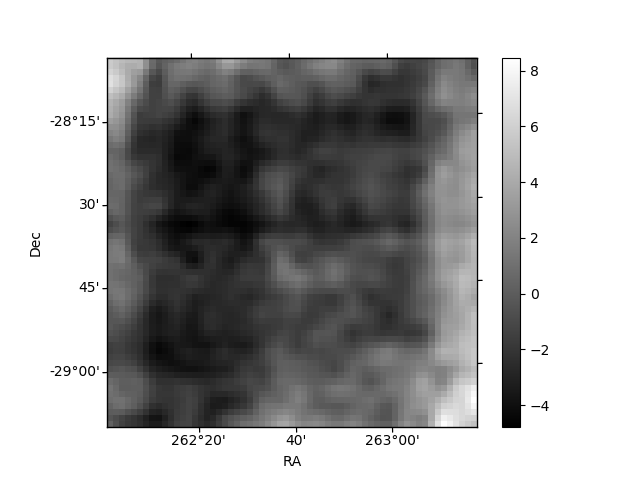
Histogram calculated using DETX and DETY for each event in the final _common_clean file
| Quadrant A | 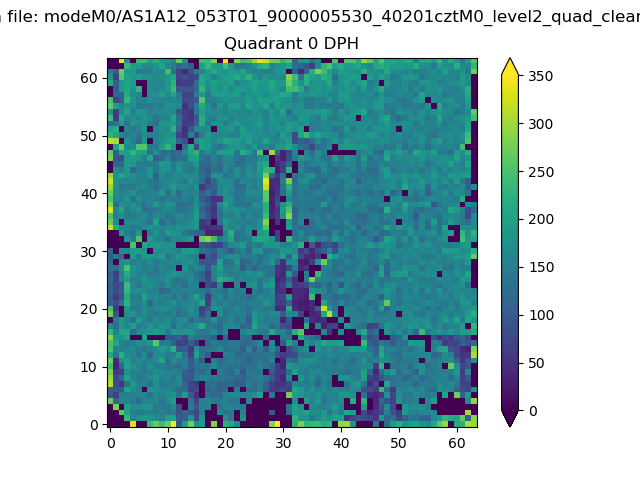 |
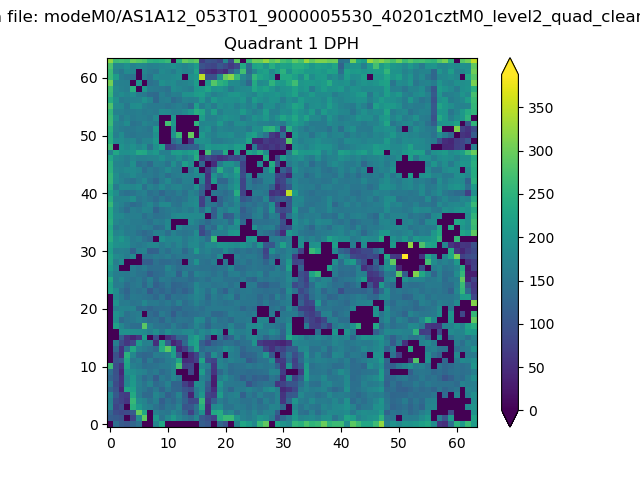 |
Quadrant B |
|---|---|---|---|
| Quadrant D | 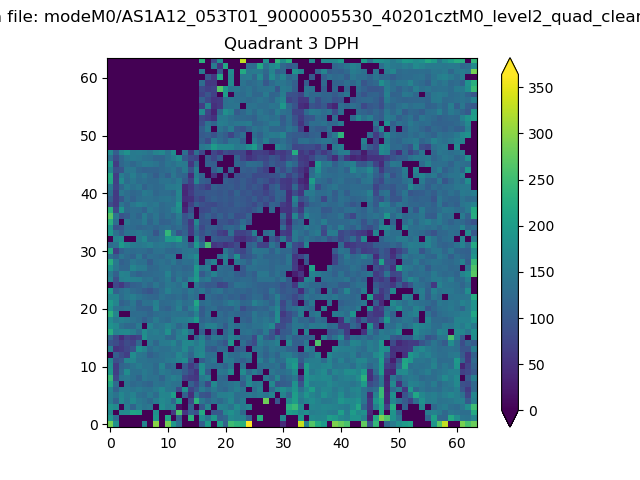 |
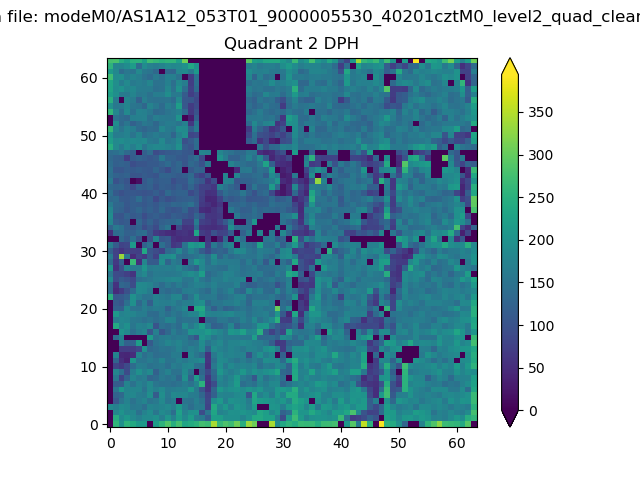 |
Quadrant C |
| Plot type | Count rate plots | Images |
|---|---|---|
| Comparison with Poisson distribution Blue bars denote a histogram of data divided into 1 sec bins. Red curve is a Poisson curve with rate = median count rate of data. |
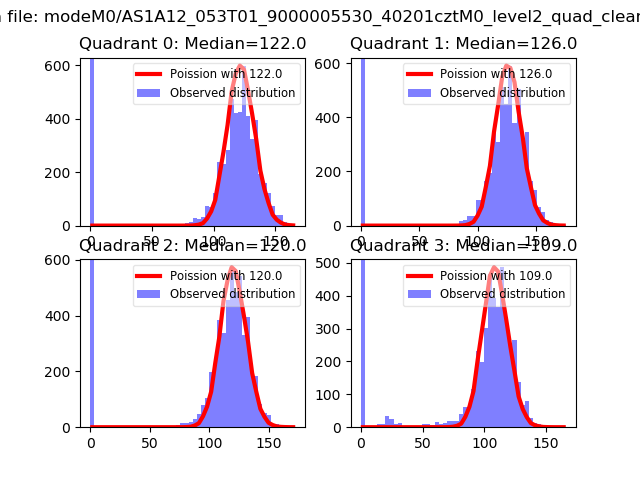 |
 |
| Quadrant-wise count rates Data is divided into 100 sec bins |
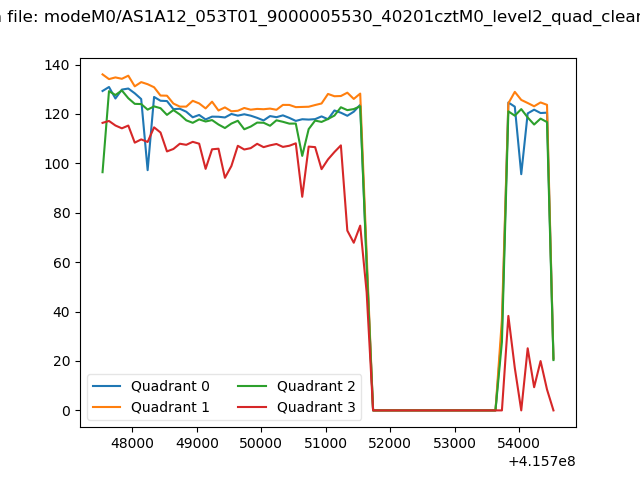 |
|
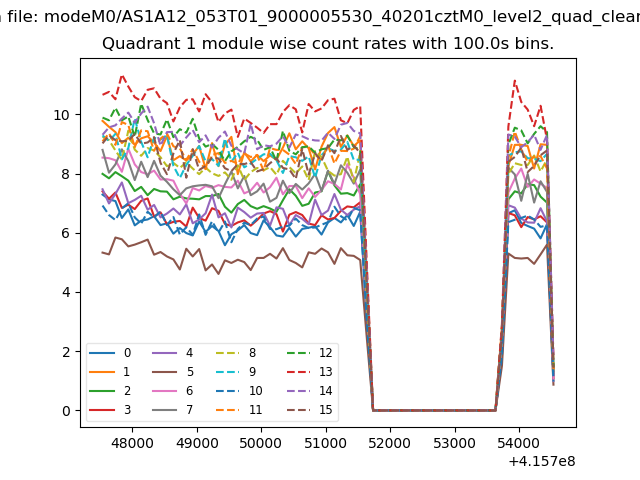
| Module-wise count rates for Quadrant A Data is divided into 100 sec bins |
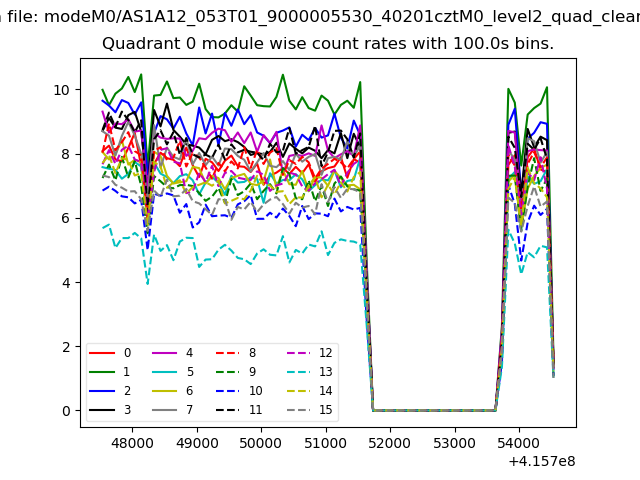 |
 |
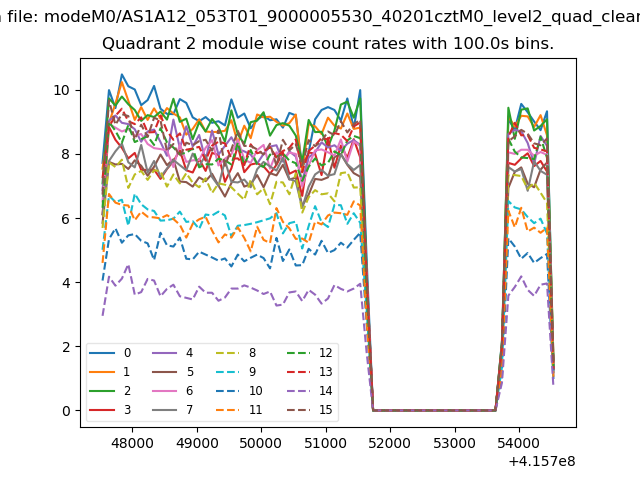
| Module-wise count rates for Quadrant B Data is divided into 100 sec bins |
 |
 |
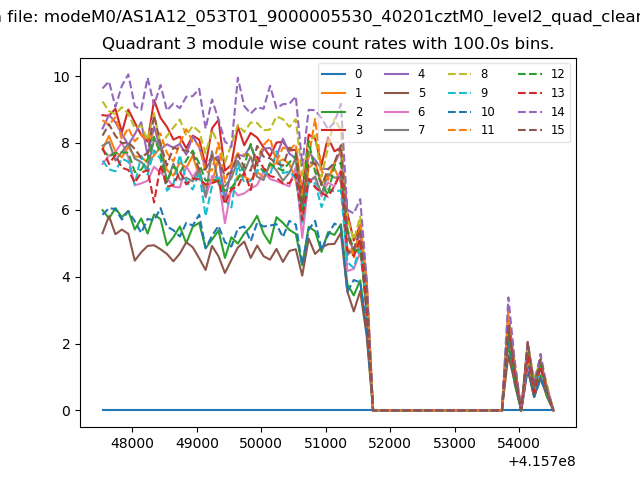
| Module-wise count rates for Quadrant C Data is divided into 100 sec bins |
 |
 |
| Module-wise count rates for Quadrant D Data is divided into 100 sec bins |
 |
 |
| Parameter | Plot |
|---|---|
| CZT HV Monitor | 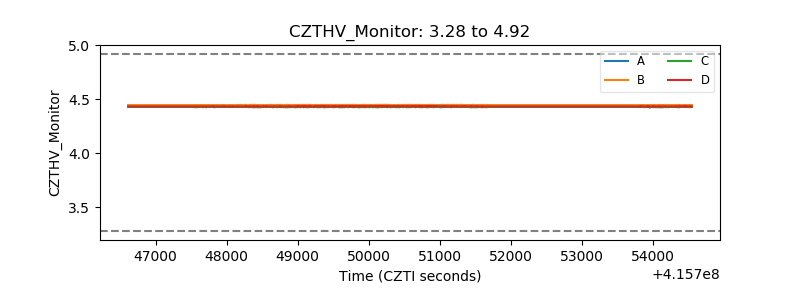 |
| D_VDD | 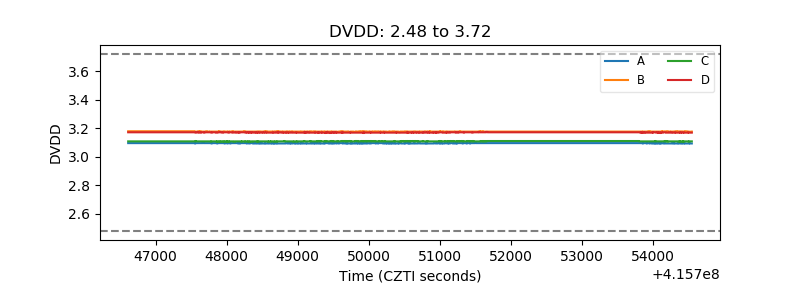 |
| Temperature 1 | 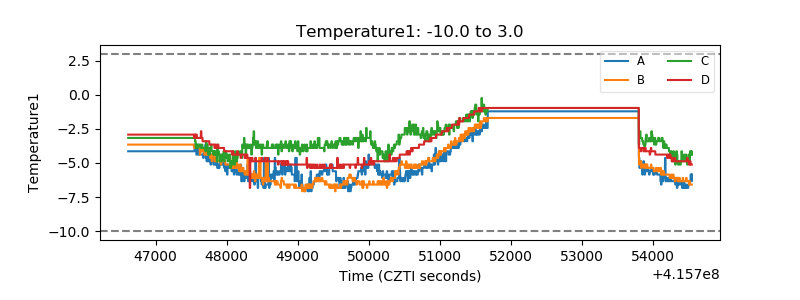 |
| Veto HV Monitor | 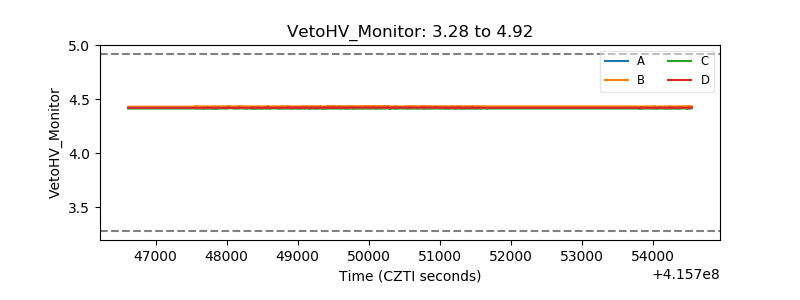 |
| Veto LLD | 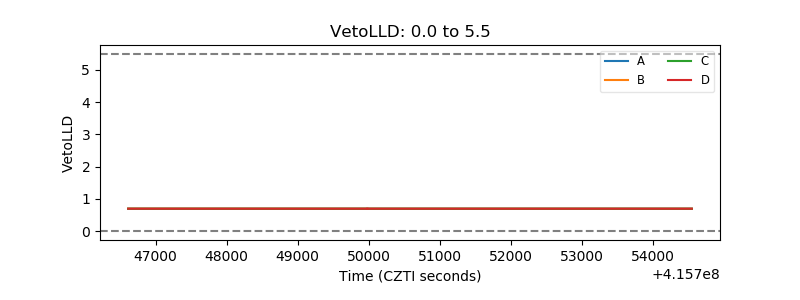 |
| Alpha Counter | 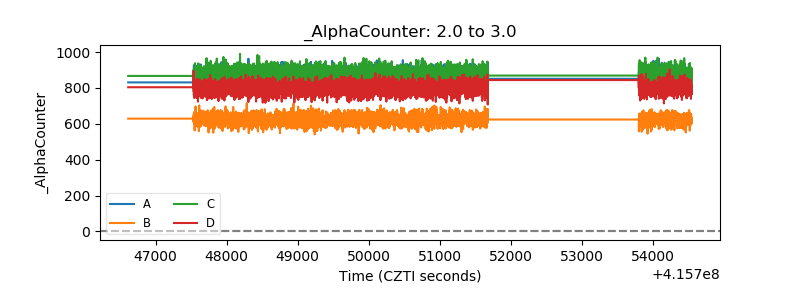 |
| _CPM_Rate | 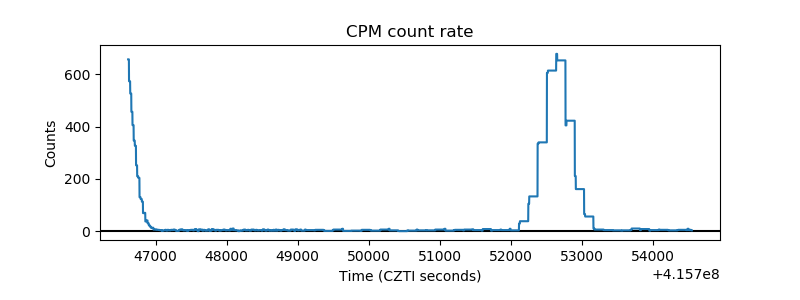 |
| CZT Counter | 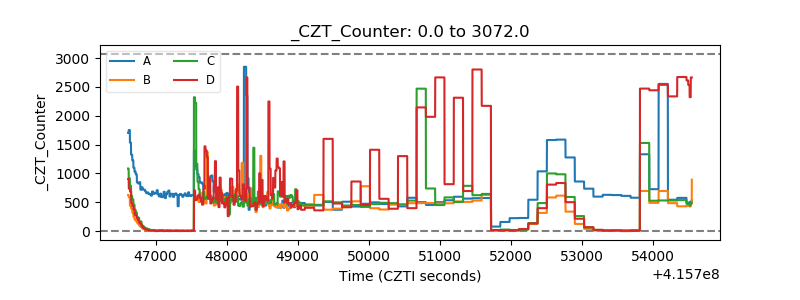 |
| +2.5 Volts monitor | 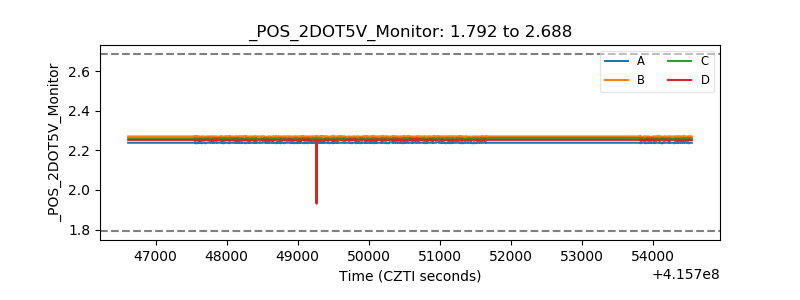 |
| +5 Volts monitor | 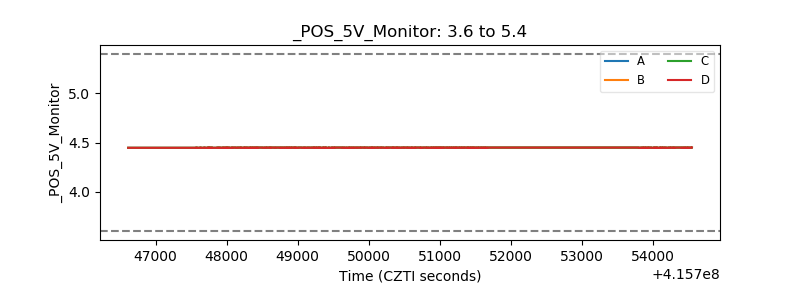 |
| _ROLL_ROT | 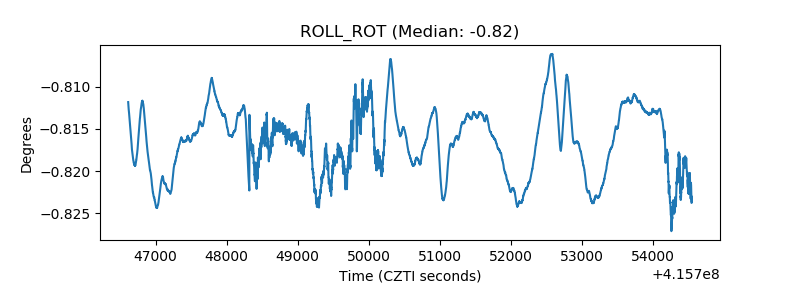 |
| _Roll_DEC | 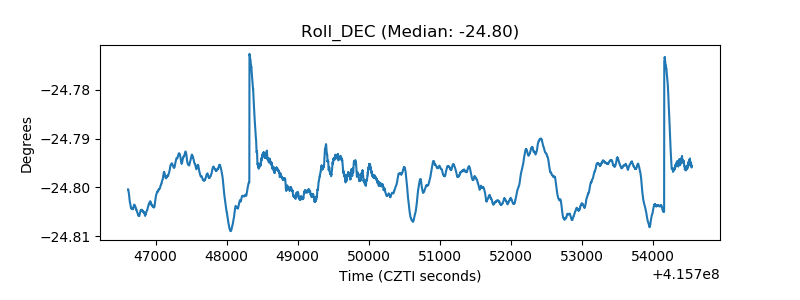 |
| _Roll_RA | 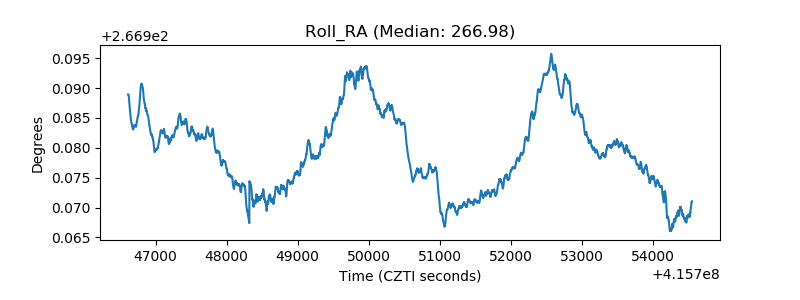 |
| Veto Counter | 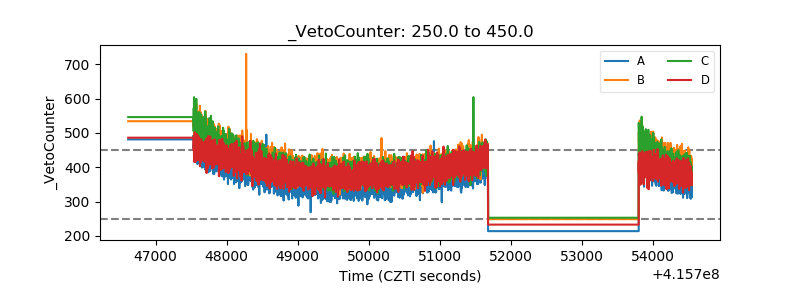 |