| Param | Original file | Final file |
|---|---|---|
| Filename | modeM0/AS1A12_053T01_9000005530_40202cztM0_level2.fits | modeM0/AS1A12_053T01_9000005530_40202cztM0_level2_quad_clean.evt |
| Size (bytes) | 496,385,280 | 75,144,960 |
| Size | 473.4 MB | 71.7 MB |
| Events in quadrant A | 2,873,063 | 563,189 |
| Events in quadrant B | 2,400,724 | 588,506 |
| Events in quadrant C | 2,805,710 | 561,698 |
| Events in quadrant D | 9,911,069 | 215,669 |
| Mode M0 | |||
|---|---|---|---|
| Quadrant | BADHDUFLAG | Total packets | Discarded packets |
| A | 0 | 11636 | 3 |
| B | 0 | 10532 | 2 |
| C | 0 | 11278 | 2 |
| D | 0 | 32788 | 2 |
| Mode SS | |||
|---|---|---|---|
| Quadrant | BADHDUFLAG | Total packets | Discarded packets |
| A | 0 | 102 | 0 |
| B | 0 | 102 | 0 |
| C | 0 | 102 | 0 |
| D | 0 | 102 | 0 |
| Mode M9 | |||
|---|---|---|---|
| Quadrant | BADHDUFLAG | Total packets | Discarded packets |
| A | 0 | 27 | 0 |
| B | 0 | 27 | 0 |
| C | 0 | 27 | 0 |
| D | 0 | 28 | 0 |
| Quadrant | Total seconds | Saturated seconds | Saturation percentage |
|---|---|---|---|
| A | 4932 | 89 | 1.804542% |
| B | 4932 | 36 | 0.729927% |
| C | 4932 | 57 | 1.155718% |
| D | 4932 | 3084 | 62.530414% |
Noise dominated data is calculated using 1-second bins in cleaned event files. If a bin has >2000 counts, and if more than 50% of those come from <1% of pixels, then it is considered to be noise-dominated and hence unusable.
| Quadrant | # 1 sec bins | Bins with >0 counts | Bins with >2000 counts | High rate bins dominated by noise | Noise dominated (total time) | Noise dominated (detector-on time) | Marked lightcurve |
|---|---|---|---|---|---|---|---|
| A | 6966 | 4933 | 69 | 69 | 0.99% | 1.40% | 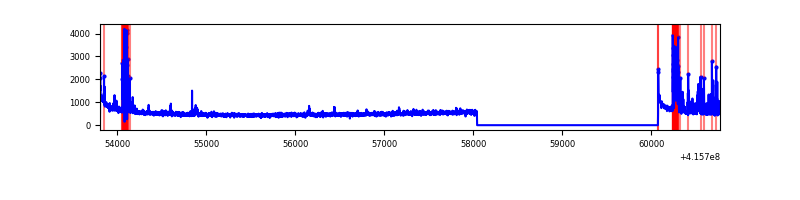 |
| B | 6966 | 4933 | 17 | 17 | 0.24% | 0.34% | 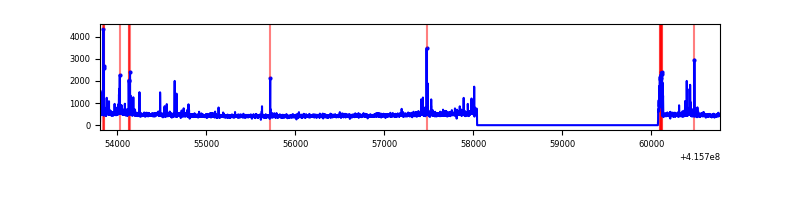 |
| C | 6966 | 4933 | 35 | 35 | 0.50% | 0.71% | 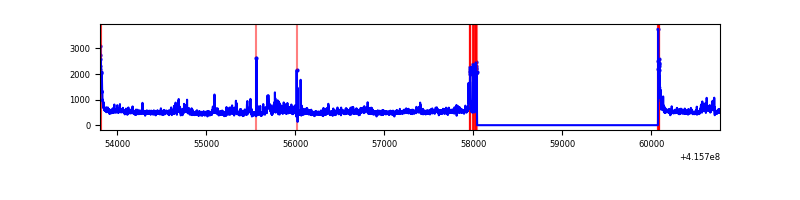 |
| D | 6966 | 4933 | 2780 | 2780 | 39.91% | 56.36% | 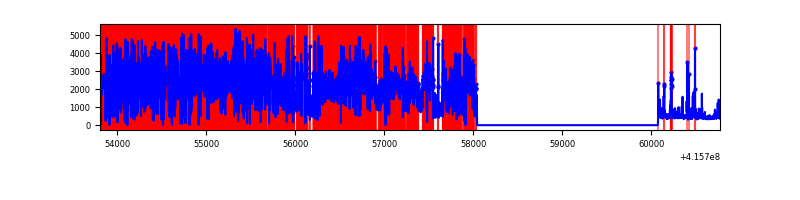 |
Top three noisy pixels from each quadrant. If the there are fewer than three noisy pixels in the level2.evt file, extra rows are filled as -1
| Pixel properties | Quadrant properties | ||||||
|---|---|---|---|---|---|---|---|
| Quadrant | DetID | PixID | Counts | Sigma | Mean | Median | Sigma |
| A | 10 | 83 | 433661 | 3902.3 | 541 | 529 | 111.0 |
| A | 13 | 248 | 299923 | 2697.39 | 541 | 529 | 111.0 |
| A | 2 | 79 | 23665 | 208.44 | 541 | 529 | 111.0 |
| B | 5 | 255 | 125902 | 1175.49 | 547 | 532 | 106.7 |
| B | 0 | 245 | 76790 | 715.01 | 547 | 532 | 106.7 |
| B | 4 | 171 | 21660 | 198.1 | 547 | 532 | 106.7 |
| C | 4 | 254 | 218920 | 1719.57 | 542 | 547 | 127.0 |
| C | 15 | 214 | 206226 | 1619.61 | 542 | 547 | 127.0 |
| C | 0 | 10 | 95976 | 751.45 | 542 | 547 | 127.0 |
| D | 12 | 227 | 8409252 | 102843.59 | 327 | 316 | 81.8 |
| D | 1 | 47 | 132884 | 1621.34 | 327 | 316 | 81.8 |
| D | 13 | 249 | 44596 | 541.55 | 327 | 316 | 81.8 |
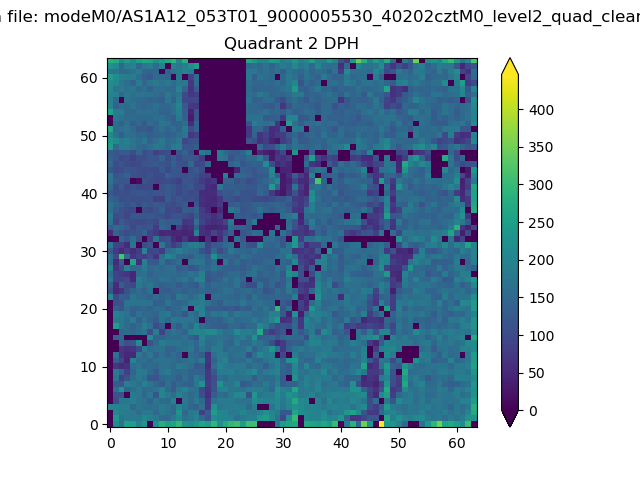
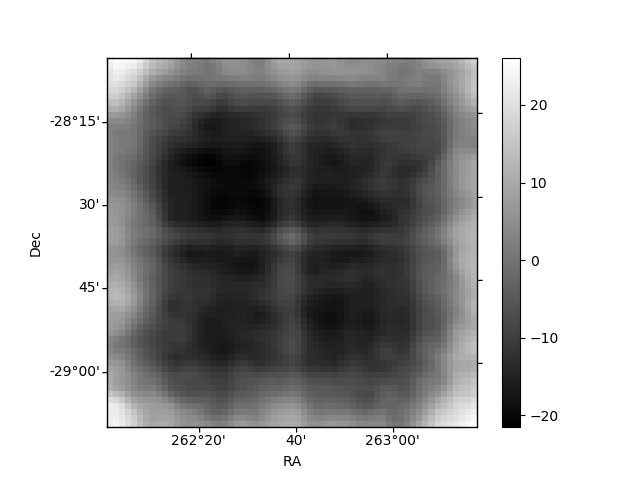
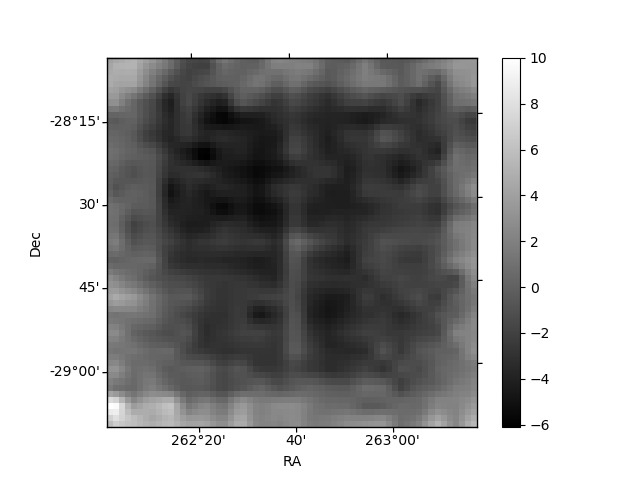
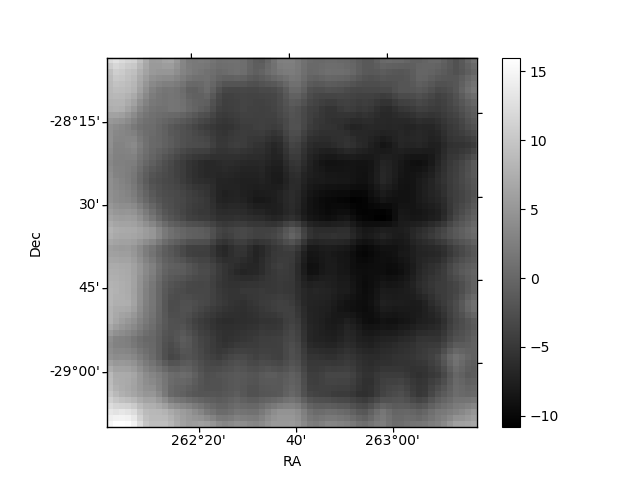
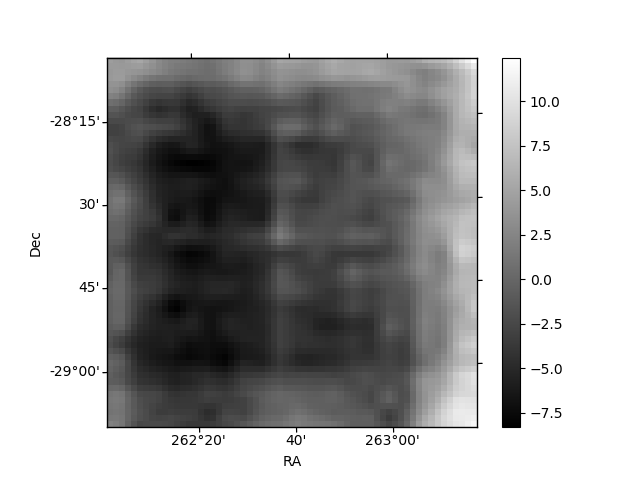
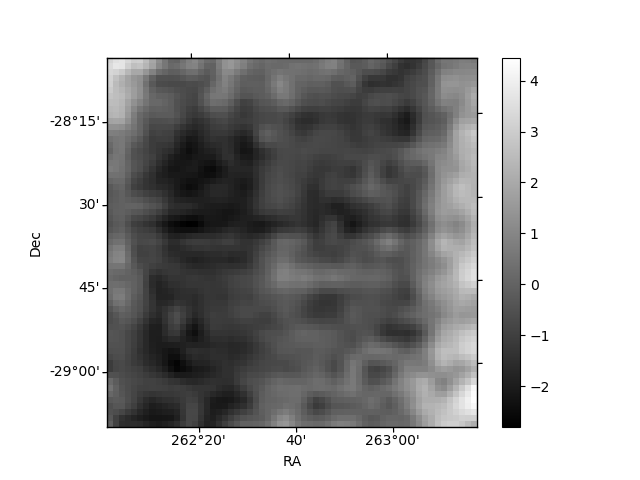
Histogram calculated using DETX and DETY for each event in the final _common_clean file
| Quadrant A | 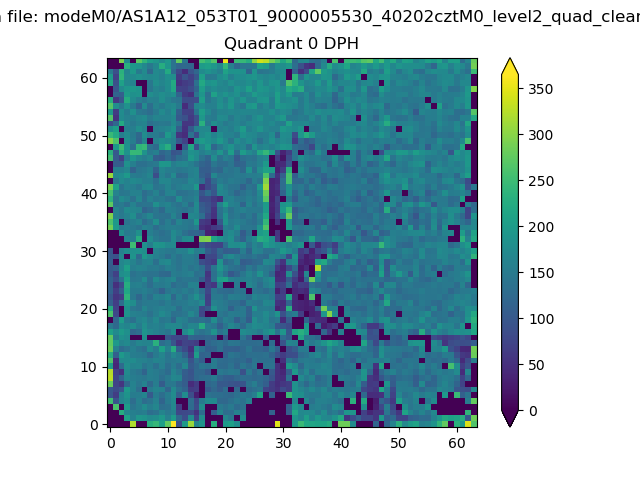 |
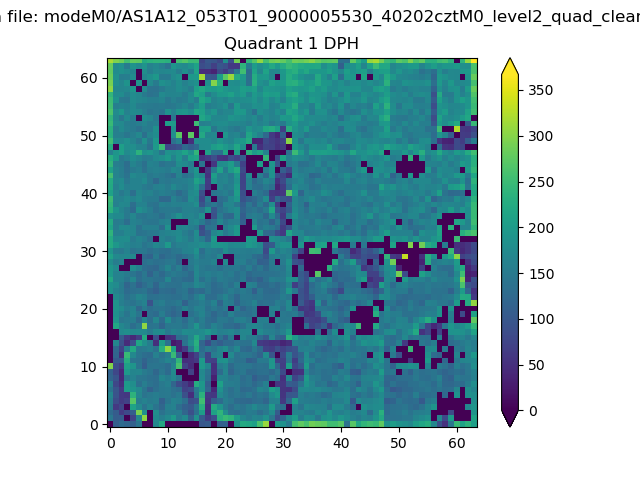 |
Quadrant B |
|---|---|---|---|
| Quadrant D | 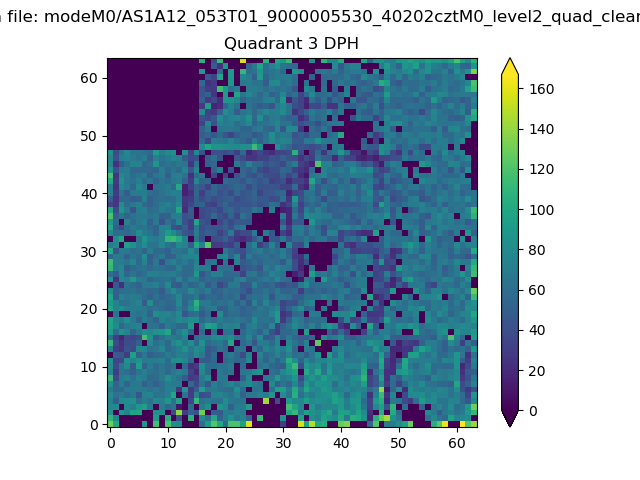 |
 |
Quadrant C |
| Plot type | Count rate plots | Images |
|---|---|---|
| Comparison with Poisson distribution Blue bars denote a histogram of data divided into 1 sec bins. Red curve is a Poisson curve with rate = median count rate of data. |
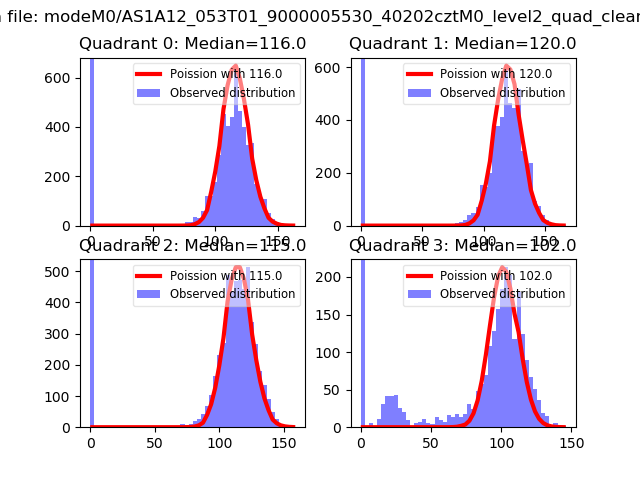 |
 |
| Quadrant-wise count rates Data is divided into 100 sec bins |
 |
|
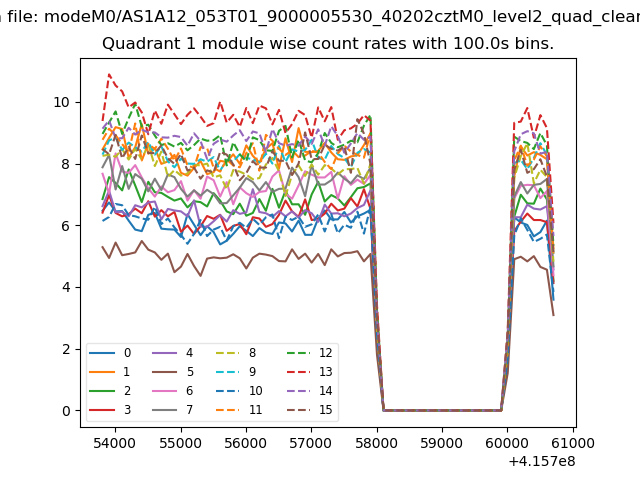
| Module-wise count rates for Quadrant A Data is divided into 100 sec bins |
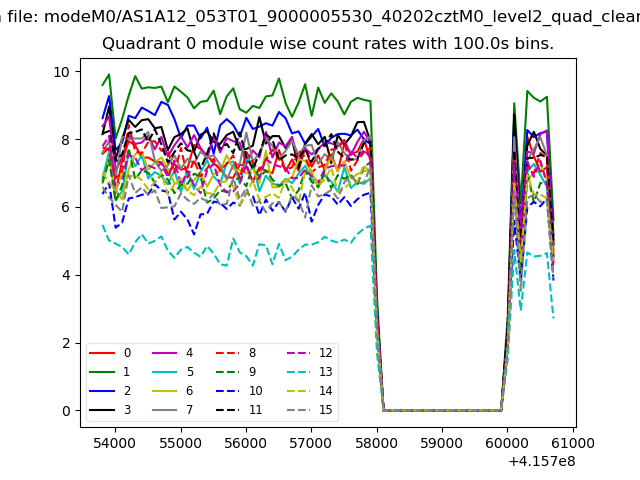 |
 |
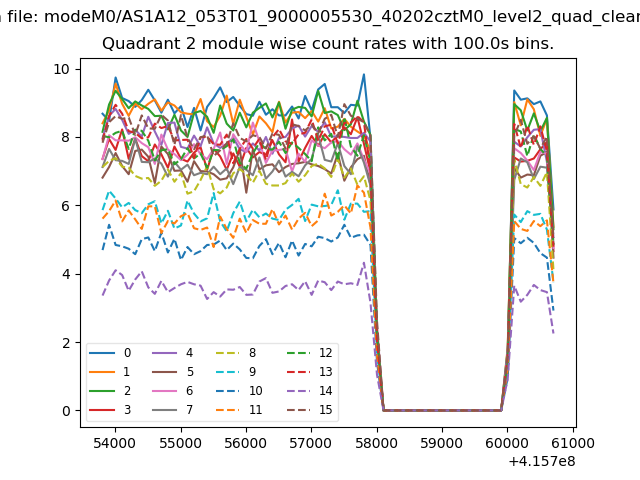
| Module-wise count rates for Quadrant B Data is divided into 100 sec bins |
 |
 |
| Module-wise count rates for Quadrant C Data is divided into 100 sec bins |
 |
 |
| Module-wise count rates for Quadrant D Data is divided into 100 sec bins |
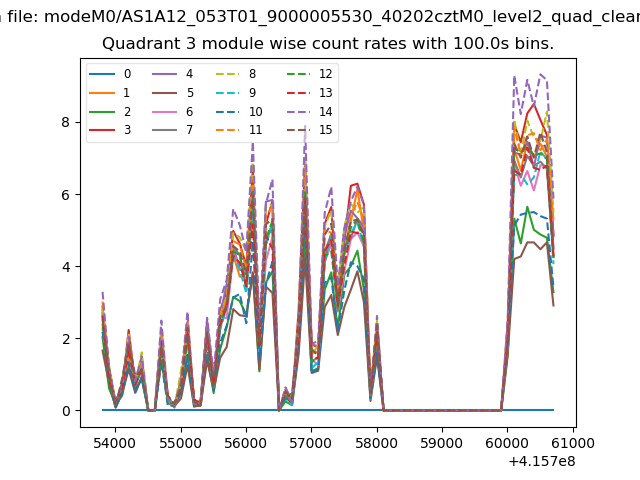 |
 |
| Parameter | Plot |
|---|---|
| CZT HV Monitor | 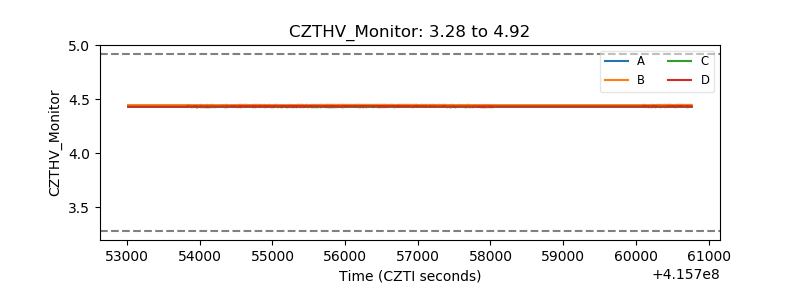 |
| D_VDD | 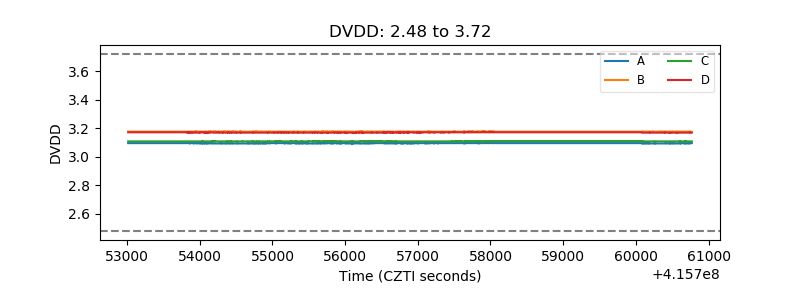 |
| Temperature 1 | 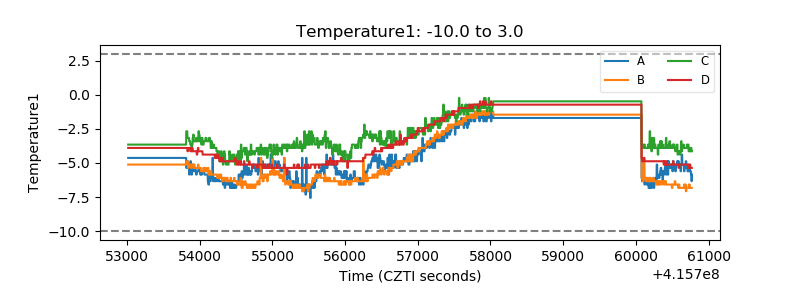 |
| Veto HV Monitor | 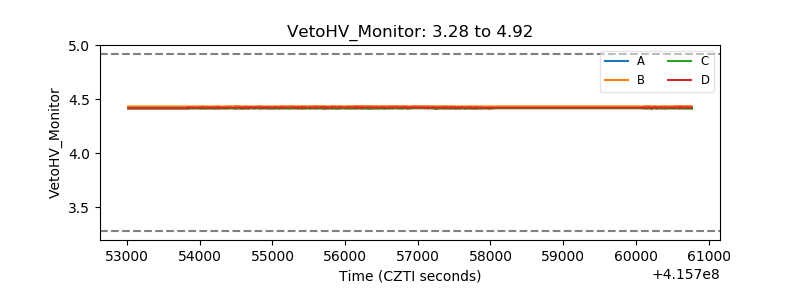 |
| Veto LLD | 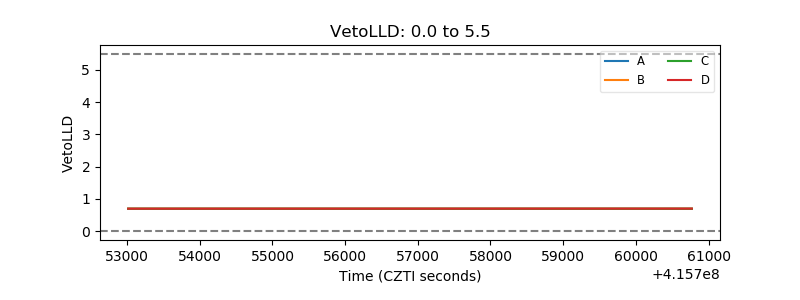 |
| Alpha Counter | 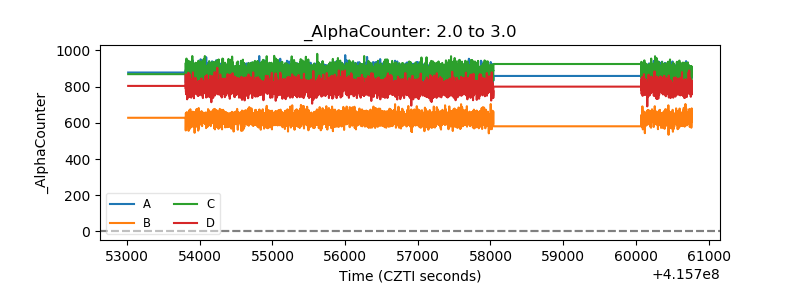 |
| _CPM_Rate | 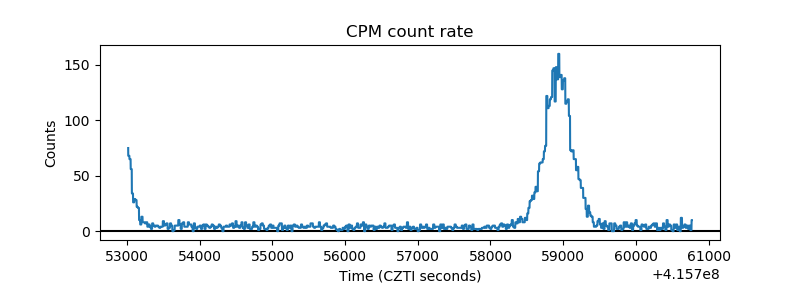 |
| CZT Counter | 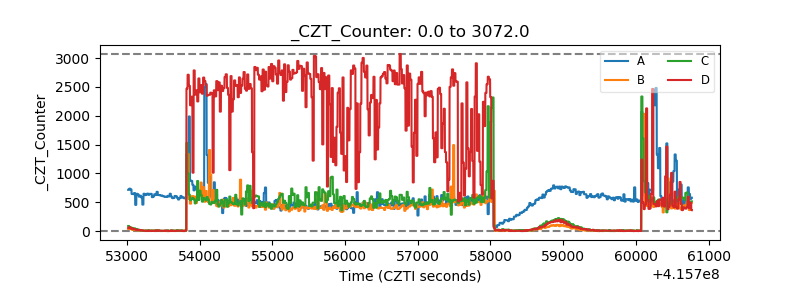 |
| +2.5 Volts monitor | 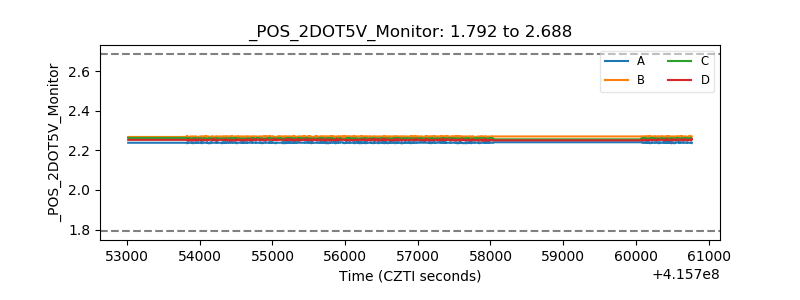 |
| +5 Volts monitor |  |
| _ROLL_ROT | 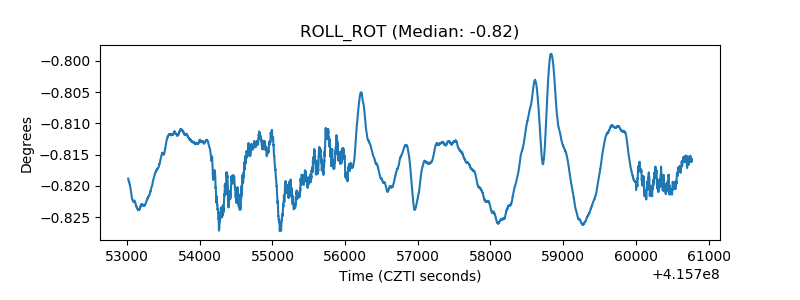 |
| _Roll_DEC | 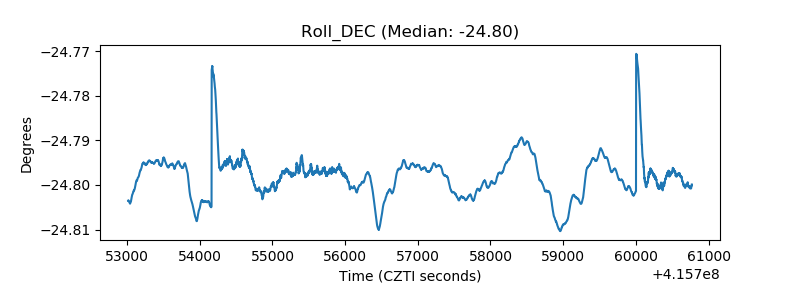 |
| _Roll_RA | 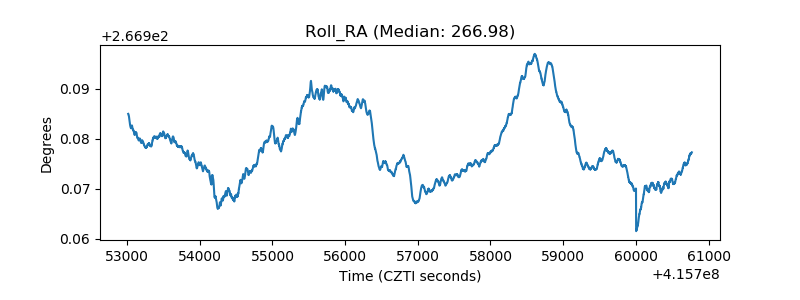 |
| Veto Counter | 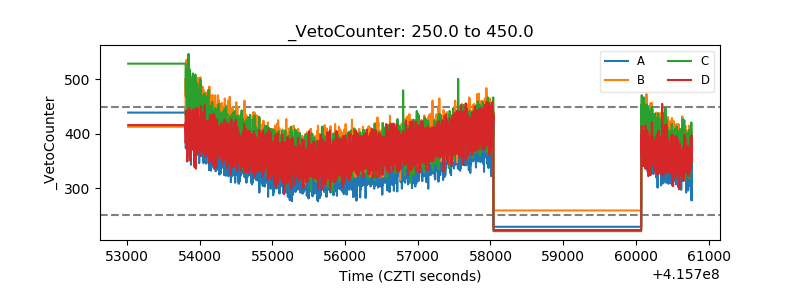 |