| Param | Original file | Final file |
|---|---|---|
| Filename | modeM0/AS1A12_053T01_9000005530_40203cztM0_level2.fits | modeM0/AS1A12_053T01_9000005530_40203cztM0_level2_quad_clean.evt |
| Size (bytes) | 347,627,520 | 88,922,880 |
| Size | 331.5 MB | 84.8 MB |
| Events in quadrant A | 3,519,847 | 585,199 |
| Events in quadrant B | 2,882,696 | 609,199 |
| Events in quadrant C | 2,733,464 | 593,524 |
| Events in quadrant D | 3,316,504 | 531,327 |
| Mode M0 | |||
|---|---|---|---|
| Quadrant | BADHDUFLAG | Total packets | Discarded packets |
| A | 0 | 13947 | 3 |
| B | 0 | 12121 | 2 |
| C | 0 | 11231 | 2 |
| D | 0 | 13671 | 2 |
| Mode SS | |||
|---|---|---|---|
| Quadrant | BADHDUFLAG | Total packets | Discarded packets |
| A | 0 | 108 | 0 |
| B | 0 | 108 | 0 |
| C | 0 | 108 | 0 |
| D | 0 | 108 | 0 |
| Mode M9 | |||
|---|---|---|---|
| Quadrant | BADHDUFLAG | Total packets | Discarded packets |
| A | 0 | 30 | 0 |
| B | 0 | 30 | 0 |
| C | 0 | 30 | 0 |
| D | 0 | 31 | 0 |
| Quadrant | Total seconds | Saturated seconds | Saturation percentage |
|---|---|---|---|
| A | 5334 | 153 | 2.868391% |
| B | 5334 | 96 | 1.799775% |
| C | 5334 | 18 | 0.337458% |
| D | 5334 | 174 | 3.262092% |
Noise dominated data is calculated using 1-second bins in cleaned event files. If a bin has >2000 counts, and if more than 50% of those come from <1% of pixels, then it is considered to be noise-dominated and hence unusable.
| Quadrant | # 1 sec bins | Bins with >0 counts | Bins with >2000 counts | High rate bins dominated by noise | Noise dominated (total time) | Noise dominated (detector-on time) | Marked lightcurve |
|---|---|---|---|---|---|---|---|
| A | 7097 | 5335 | 97 | 97 | 1.37% | 1.82% | 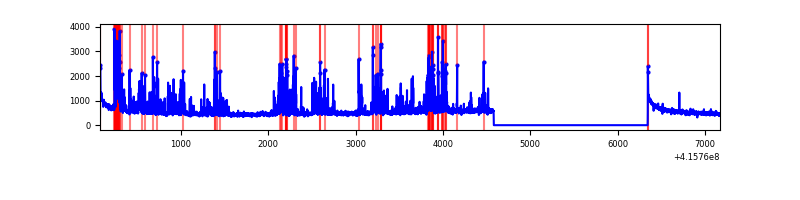 |
| B | 7097 | 5335 | 67 | 67 | 0.94% | 1.26% | 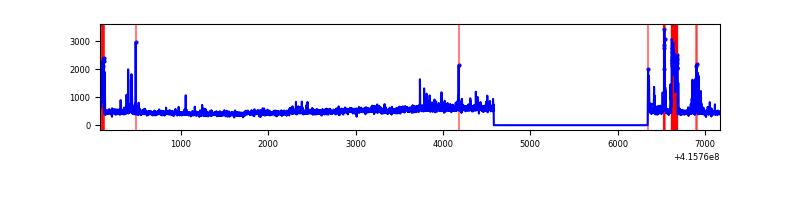 |
| C | 7097 | 5335 | 8 | 8 | 0.11% | 0.15% | 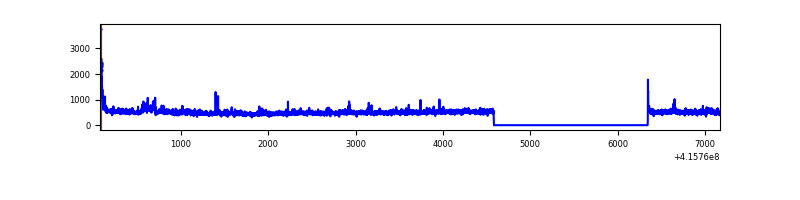 |
| D | 7097 | 5335 | 153 | 153 | 2.16% | 2.87% | 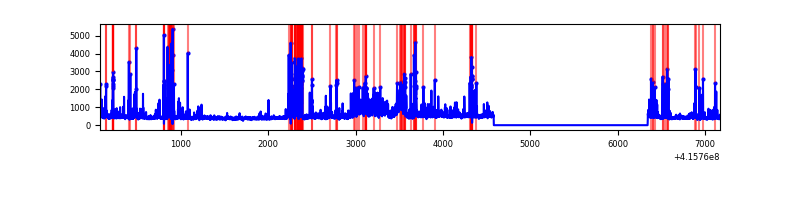 |
Top three noisy pixels from each quadrant. If the there are fewer than three noisy pixels in the level2.evt file, extra rows are filled as -1
| Pixel properties | Quadrant properties | ||||||
|---|---|---|---|---|---|---|---|
| Quadrant | DetID | PixID | Counts | Sigma | Mean | Median | Sigma |
| A | 13 | 248 | 794713 | 6758.69 | 577 | 566 | 117.5 |
| A | 10 | 83 | 462548 | 3931.76 | 577 | 566 | 117.5 |
| A | 13 | 6 | 11070 | 89.4 | 577 | 566 | 117.5 |
| B | 5 | 255 | 266782 | 2350.81 | 582 | 567 | 113.2 |
| B | 7 | 202 | 219854 | 1936.41 | 582 | 567 | 113.2 |
| B | 0 | 245 | 65075 | 569.64 | 582 | 567 | 113.2 |
| C | 15 | 214 | 222881 | 1639.27 | 579 | 583 | 135.6 |
| C | 4 | 254 | 112220 | 823.24 | 579 | 583 | 135.6 |
| C | 0 | 10 | 59475 | 434.28 | 579 | 583 | 135.6 |
| D | 12 | 227 | 876883 | 6307.41 | 567 | 552 | 138.9 |
| D | 13 | 249 | 118314 | 847.59 | 567 | 552 | 138.9 |
| D | 9 | 19 | 74002 | 528.66 | 567 | 552 | 138.9 |
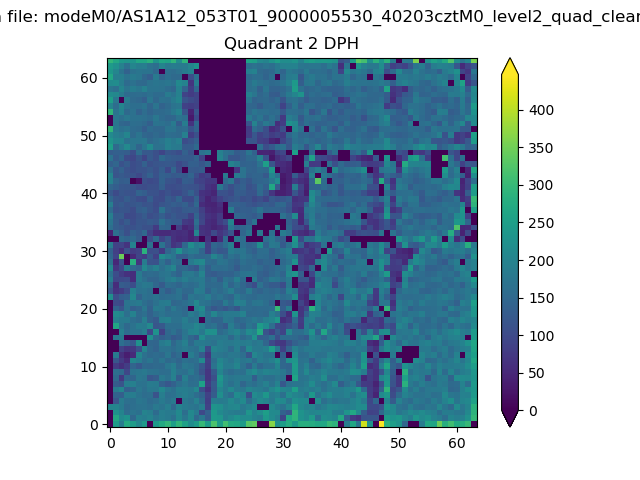
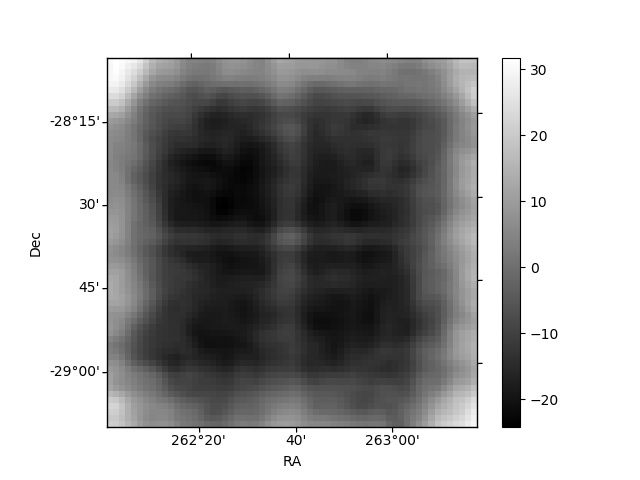
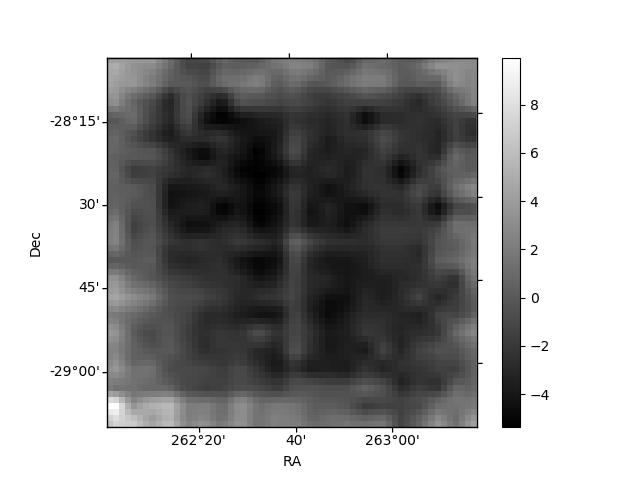
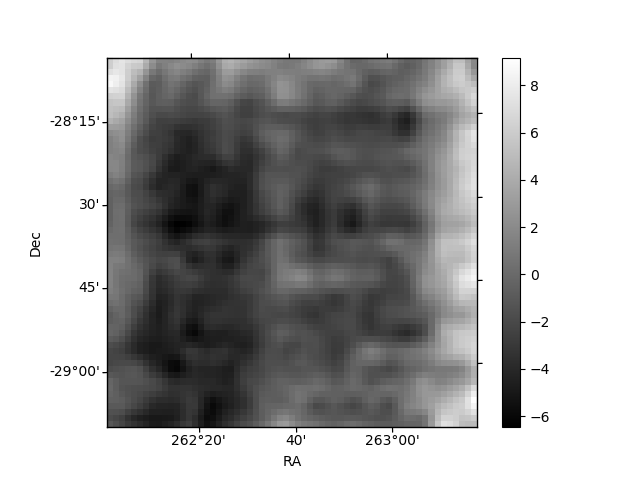
Histogram calculated using DETX and DETY for each event in the final _common_clean file
| Quadrant A | 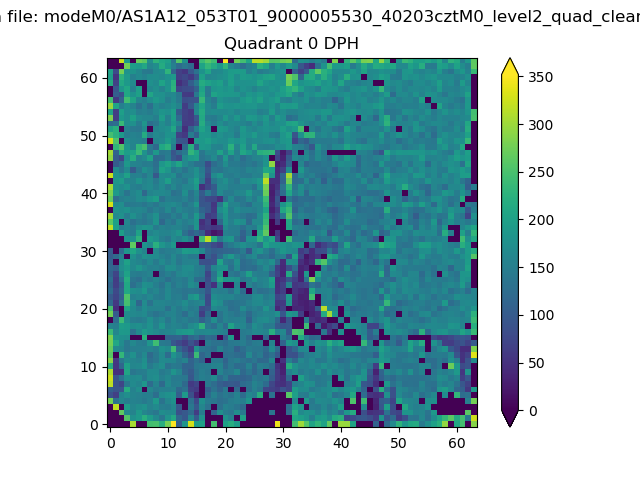 |
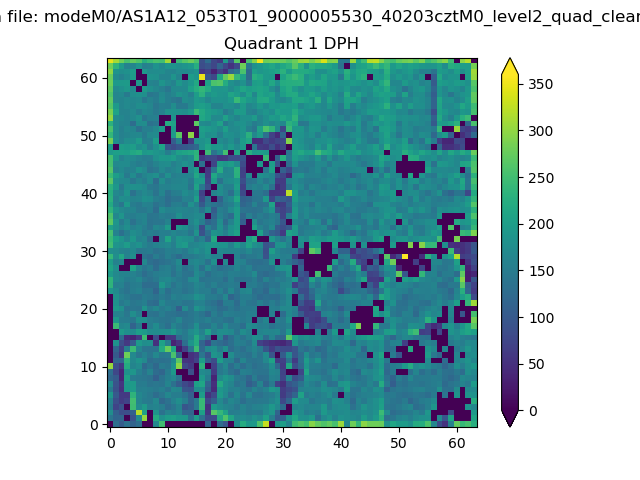 |
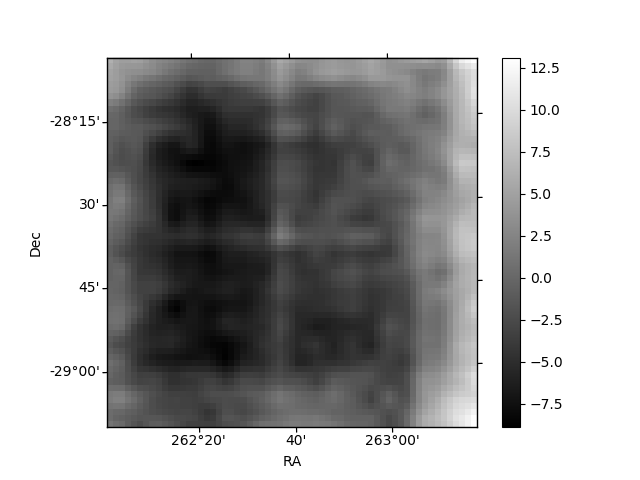
Quadrant B |
|---|---|---|---|
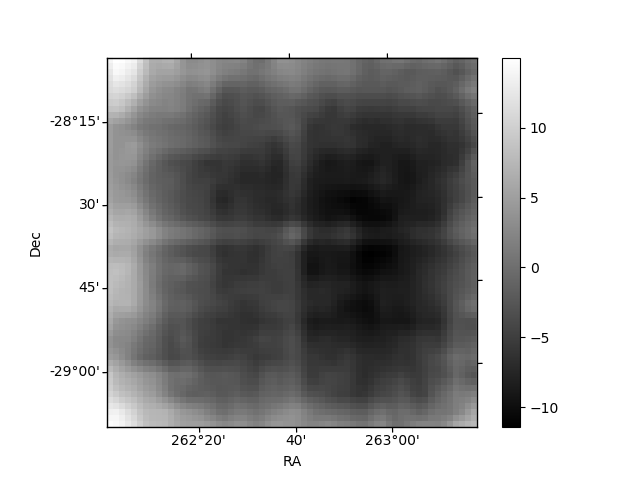
| Quadrant D | 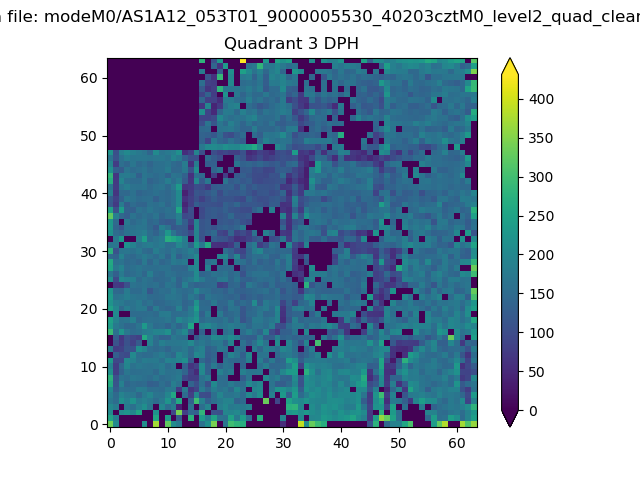 |
 |
Quadrant C |
| Plot type | Count rate plots | Images |
|---|---|---|
| Comparison with Poisson distribution Blue bars denote a histogram of data divided into 1 sec bins. Red curve is a Poisson curve with rate = median count rate of data. |
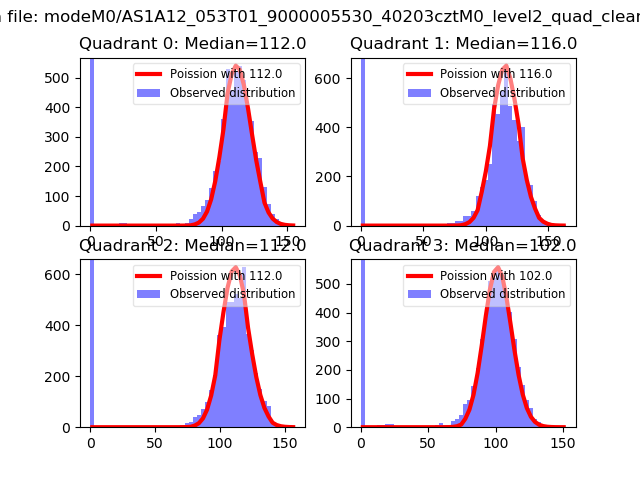 |
 |
| Quadrant-wise count rates Data is divided into 100 sec bins |
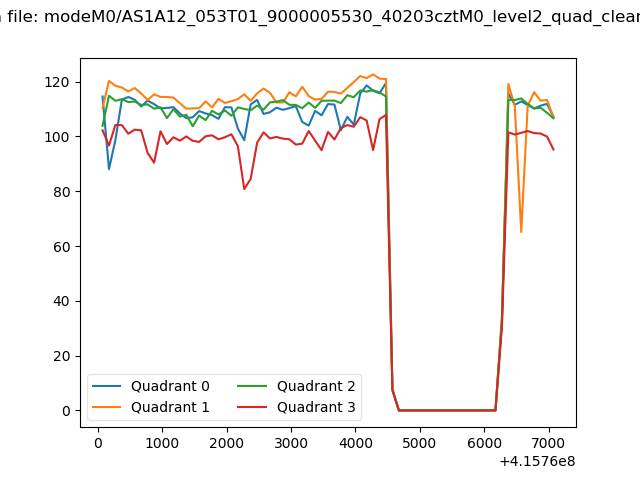 |
|
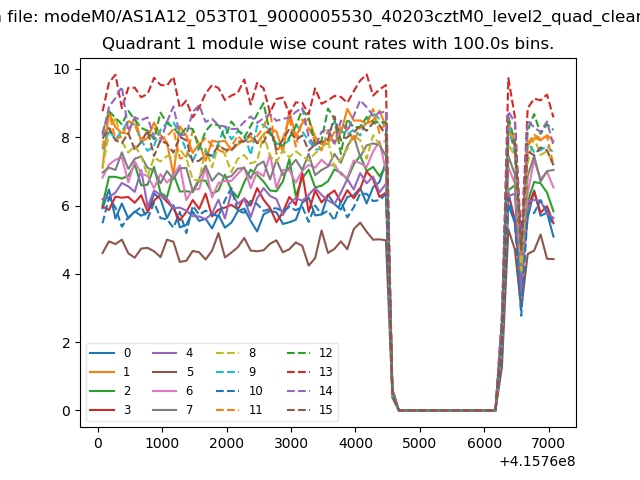
| Module-wise count rates for Quadrant A Data is divided into 100 sec bins |
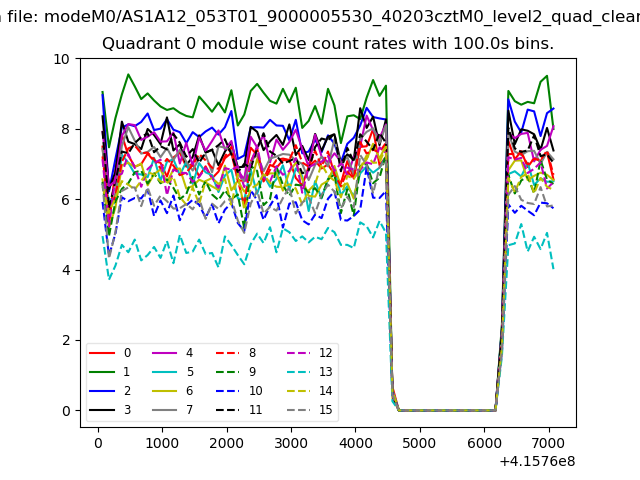 |
 |
| Module-wise count rates for Quadrant B Data is divided into 100 sec bins |
 |
 |
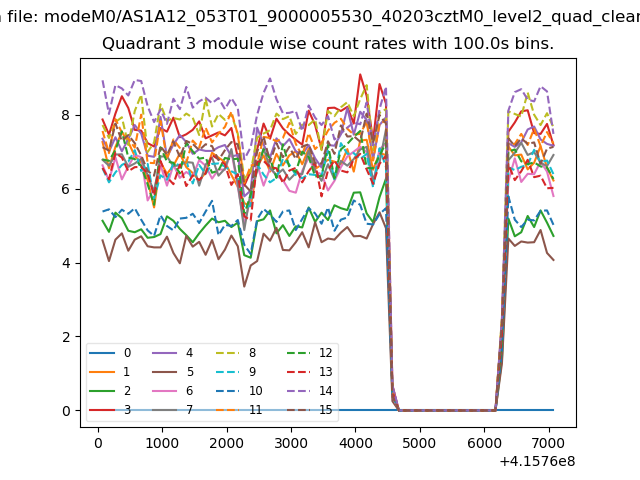
| Module-wise count rates for Quadrant C Data is divided into 100 sec bins |
 |
 |
| Module-wise count rates for Quadrant D Data is divided into 100 sec bins |
 |
 |
| Parameter | Plot |
|---|---|
| CZT HV Monitor |  |
| D_VDD | 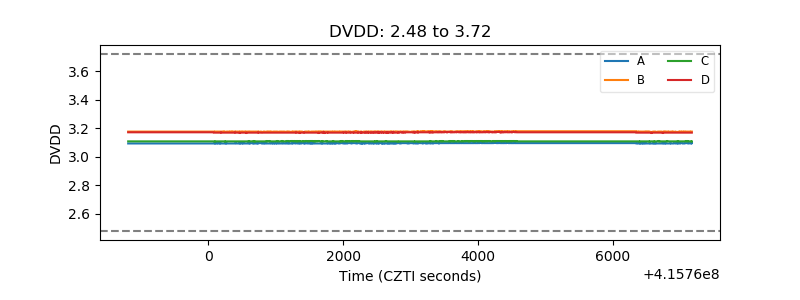 |
| Temperature 1 | 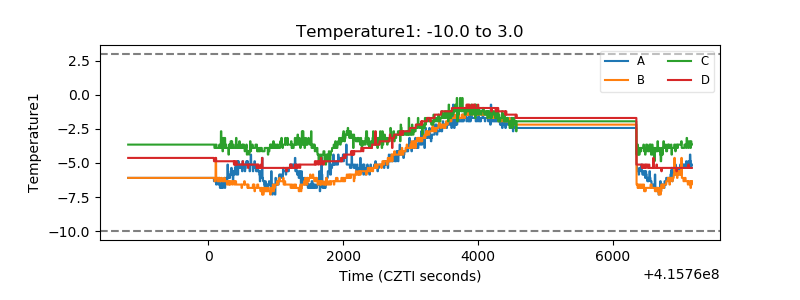 |
| Veto HV Monitor | 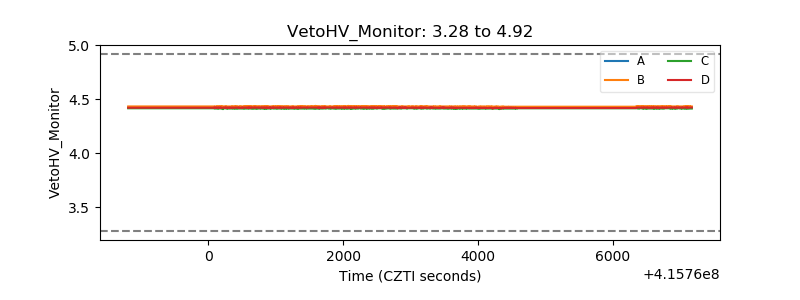 |
| Veto LLD | 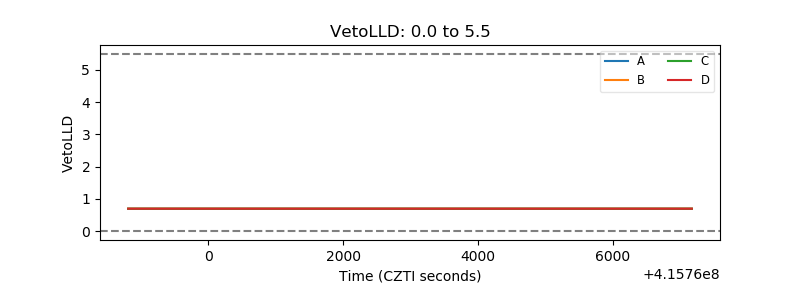 |
| Alpha Counter | 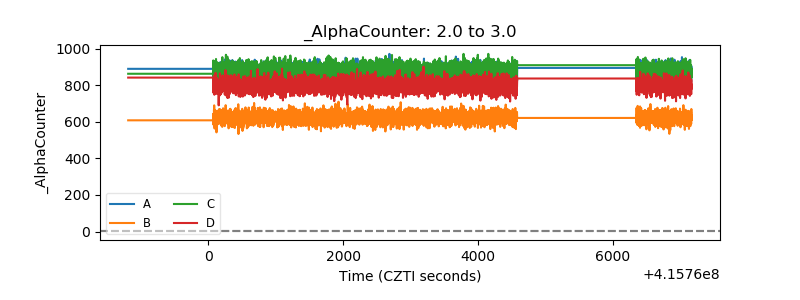 |
| _CPM_Rate | 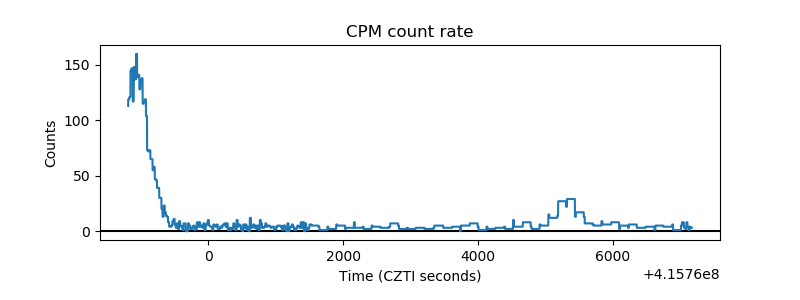 |
| CZT Counter | 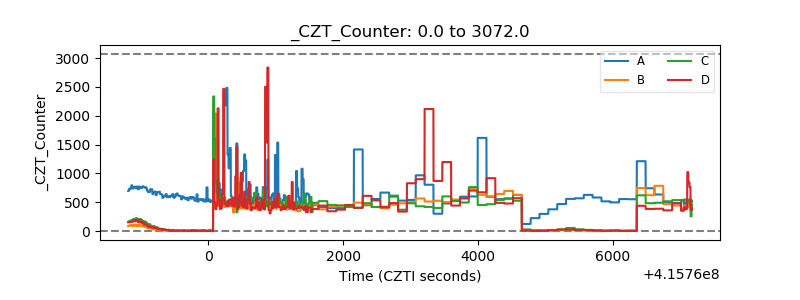 |
| +2.5 Volts monitor | 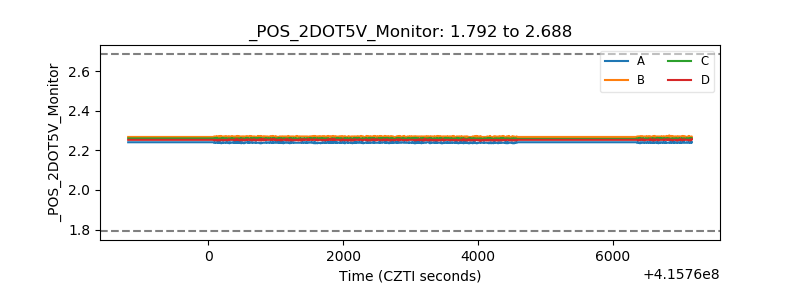 |
| +5 Volts monitor |  |
| _ROLL_ROT | 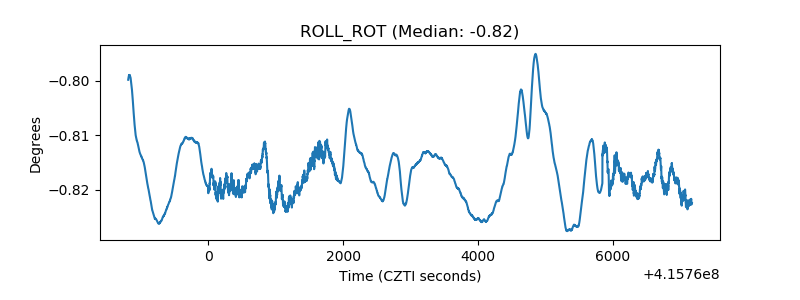 |
| _Roll_DEC | 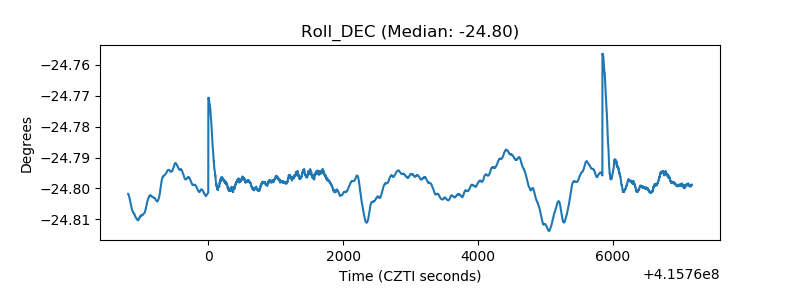 |
| _Roll_RA | 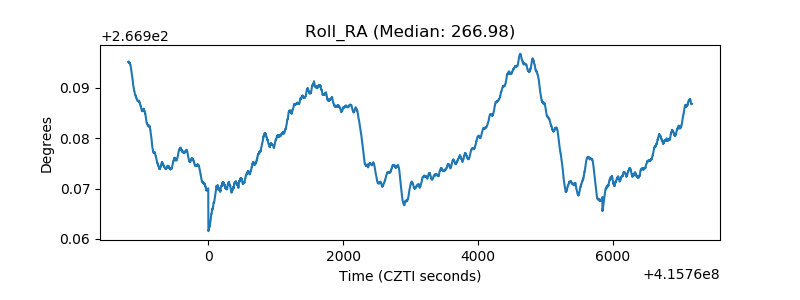 |
| Veto Counter | 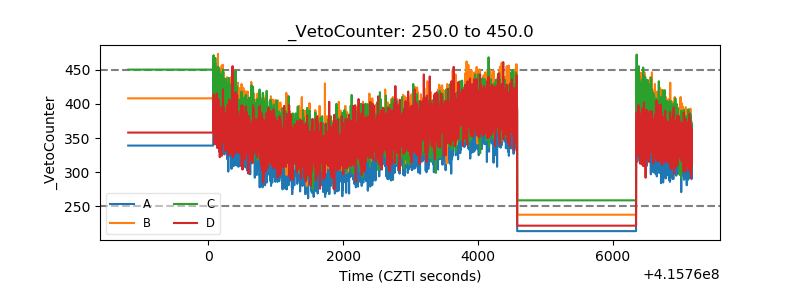 |