| Param | Original file | Final file |
|---|---|---|
| Filename | modeM0/AS1A12_053T01_9000005530_40204cztM0_level2.fits | modeM0/AS1A12_053T01_9000005530_40204cztM0_level2_quad_clean.evt |
| Size (bytes) | 334,704,960 | 93,994,560 |
| Size | 319.2 MB | 89.6 MB |
| Events in quadrant A | 3,010,705 | 622,983 |
| Events in quadrant B | 3,055,669 | 634,094 |
| Events in quadrant C | 2,794,615 | 625,767 |
| Events in quadrant D | 3,086,387 | 566,456 |
| Mode M0 | |||
|---|---|---|---|
| Quadrant | BADHDUFLAG | Total packets | Discarded packets |
| A | 0 | 12463 | 3 |
| B | 0 | 13003 | 2 |
| C | 0 | 11577 | 2 |
| D | 0 | 13132 | 2 |
| Mode SS | |||
|---|---|---|---|
| Quadrant | BADHDUFLAG | Total packets | Discarded packets |
| A | 0 | 114 | 0 |
| B | 0 | 114 | 0 |
| C | 0 | 114 | 0 |
| D | 0 | 114 | 0 |
| Mode M9 | |||
|---|---|---|---|
| Quadrant | BADHDUFLAG | Total packets | Discarded packets |
| A | 0 | 27 | 0 |
| B | 0 | 27 | 0 |
| C | 0 | 27 | 0 |
| D | 0 | 28 | 0 |
| Quadrant | Total seconds | Saturated seconds | Saturation percentage |
|---|---|---|---|
| A | 5678 | 27 | 0.475520% |
| B | 5678 | 140 | 2.465657% |
| C | 5678 | 4 | 0.070447% |
| D | 5678 | 79 | 1.391335% |
Noise dominated data is calculated using 1-second bins in cleaned event files. If a bin has >2000 counts, and if more than 50% of those come from <1% of pixels, then it is considered to be noise-dominated and hence unusable.
| Quadrant | # 1 sec bins | Bins with >0 counts | Bins with >2000 counts | High rate bins dominated by noise | Noise dominated (total time) | Noise dominated (detector-on time) | Marked lightcurve |
|---|---|---|---|---|---|---|---|
| A | 7141 | 5679 | 15 | 15 | 0.21% | 0.26% | 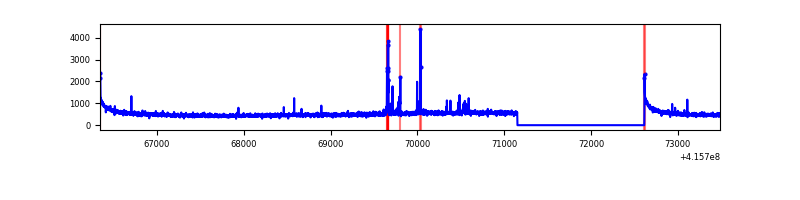 |
| B | 7141 | 5679 | 89 | 89 | 1.25% | 1.57% | 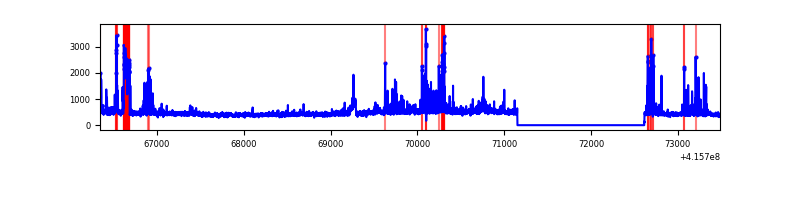 |
| C | 7141 | 5679 | 1 | 1 | 0.01% | 0.02% | 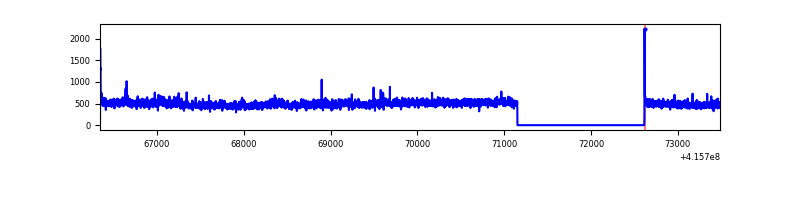 |
| D | 7141 | 5679 | 70 | 70 | 0.98% | 1.23% | 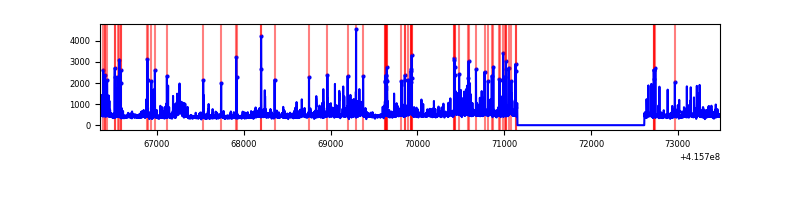 |
Top three noisy pixels from each quadrant. If the there are fewer than three noisy pixels in the level2.evt file, extra rows are filled as -1
| Pixel properties | Quadrant properties | ||||||
|---|---|---|---|---|---|---|---|
| Quadrant | DetID | PixID | Counts | Sigma | Mean | Median | Sigma |
| A | 10 | 83 | 509023 | 3969.11 | 621 | 609 | 128.1 |
| A | 13 | 248 | 73516 | 569.17 | 621 | 609 | 128.1 |
| A | 7 | 191 | 9088 | 66.19 | 621 | 609 | 128.1 |
| B | 5 | 255 | 456649 | 3767.48 | 617 | 600 | 121.0 |
| B | 7 | 202 | 54991 | 449.33 | 617 | 600 | 121.0 |
| B | 4 | 171 | 46044 | 375.42 | 617 | 600 | 121.0 |
| C | 15 | 214 | 238301 | 1635.23 | 617 | 620 | 145.3 |
| C | 4 | 254 | 120656 | 825.84 | 617 | 620 | 145.3 |
| C | 0 | 10 | 14225 | 93.6 | 617 | 620 | 145.3 |
| D | 12 | 227 | 445071 | 2957.81 | 610 | 592 | 150.3 |
| D | 9 | 19 | 90195 | 596.27 | 610 | 592 | 150.3 |
| D | 13 | 249 | 75524 | 498.64 | 610 | 592 | 150.3 |
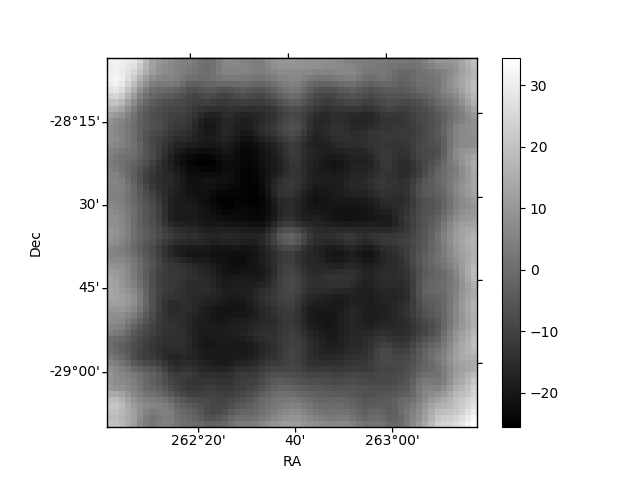
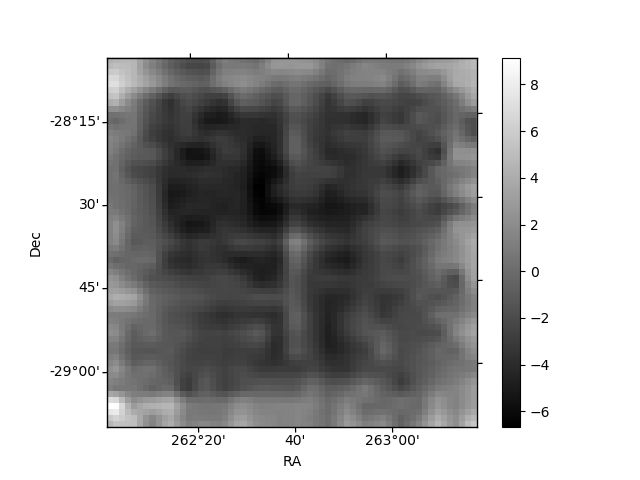
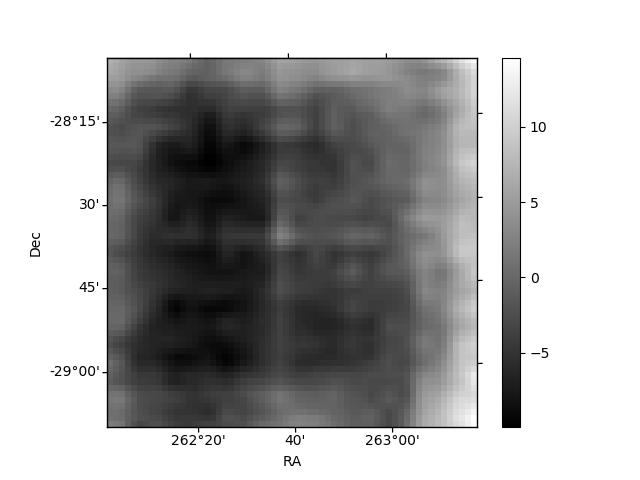
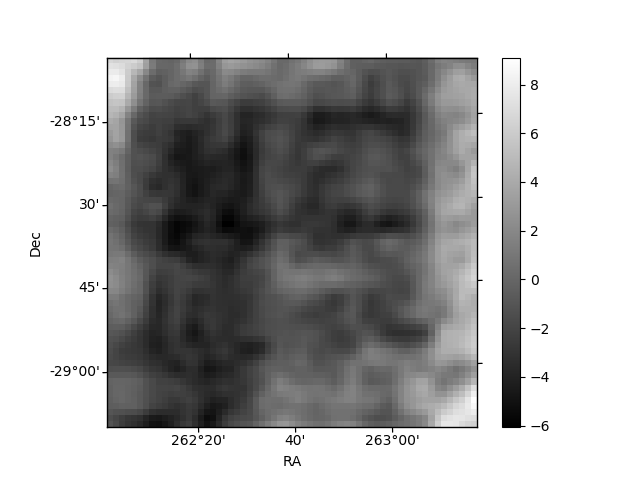
Histogram calculated using DETX and DETY for each event in the final _common_clean file
| Quadrant A | 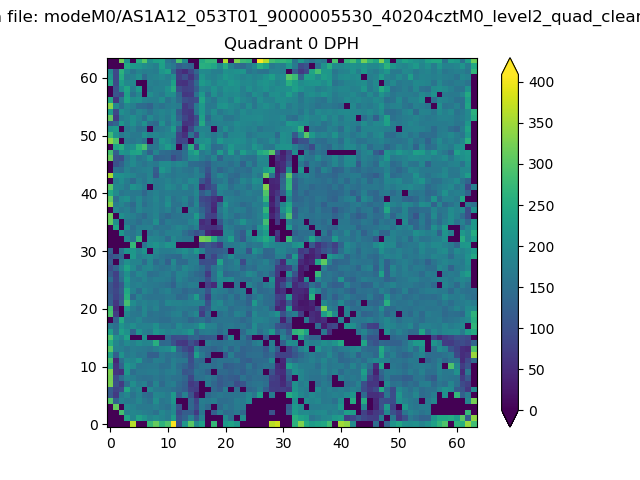 |
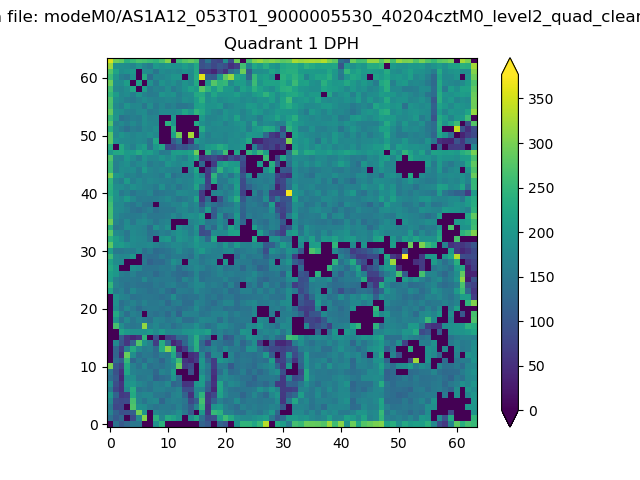 |
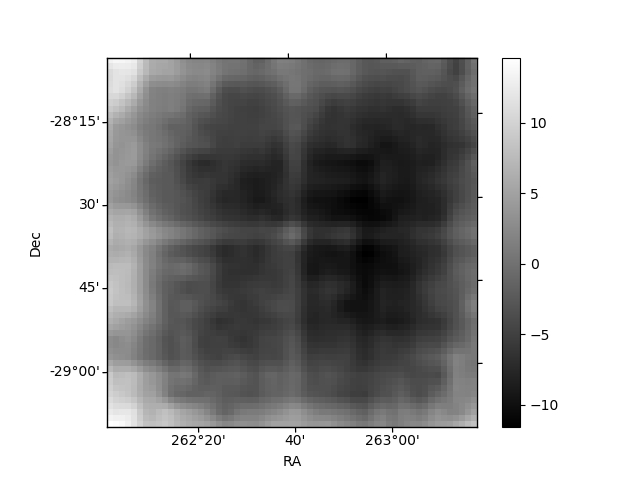
Quadrant B |
|---|---|---|---|
| Quadrant D | 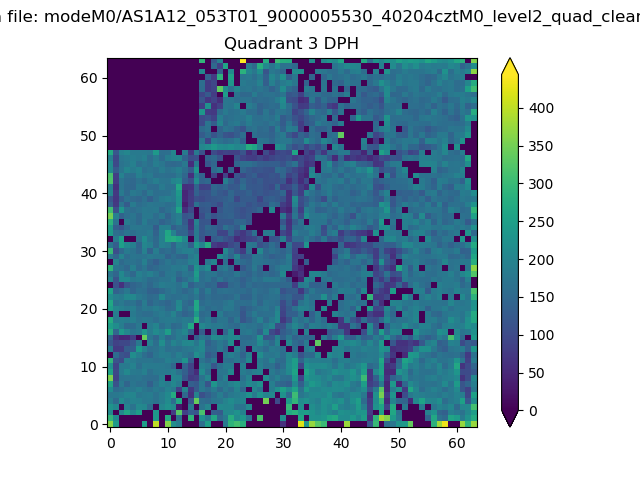 |
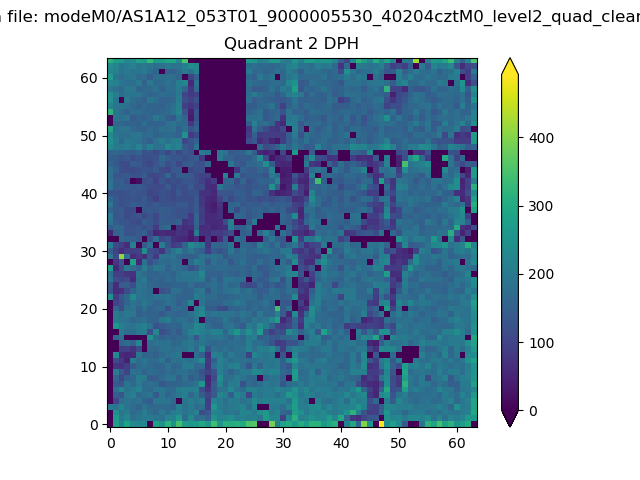 |
Quadrant C |
| Plot type | Count rate plots | Images |
|---|---|---|
| Comparison with Poisson distribution Blue bars denote a histogram of data divided into 1 sec bins. Red curve is a Poisson curve with rate = median count rate of data. |
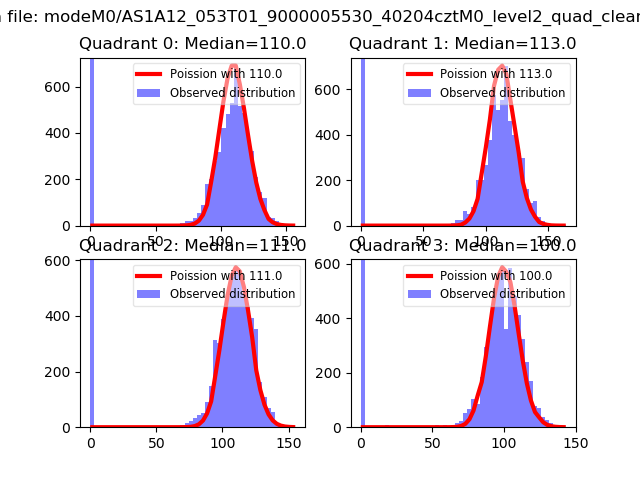 |
 |
| Quadrant-wise count rates Data is divided into 100 sec bins |
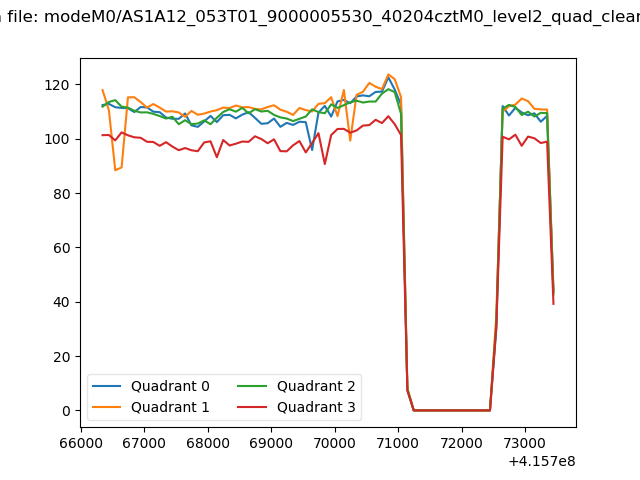 |
|
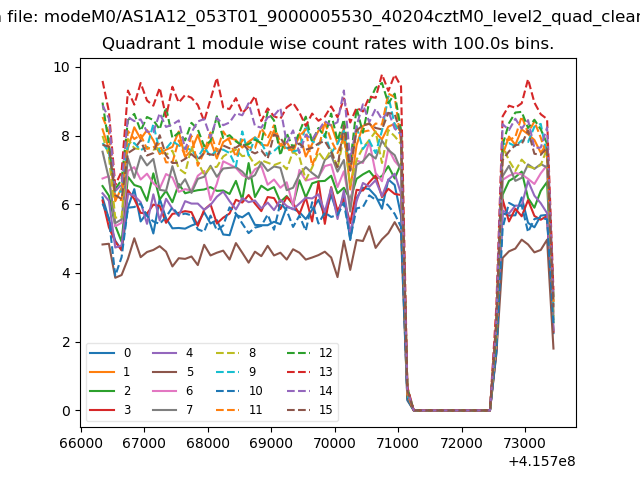
| Module-wise count rates for Quadrant A Data is divided into 100 sec bins |
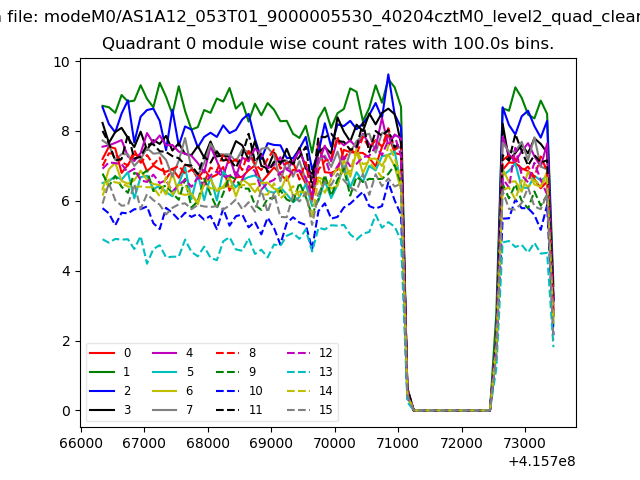 |
 |
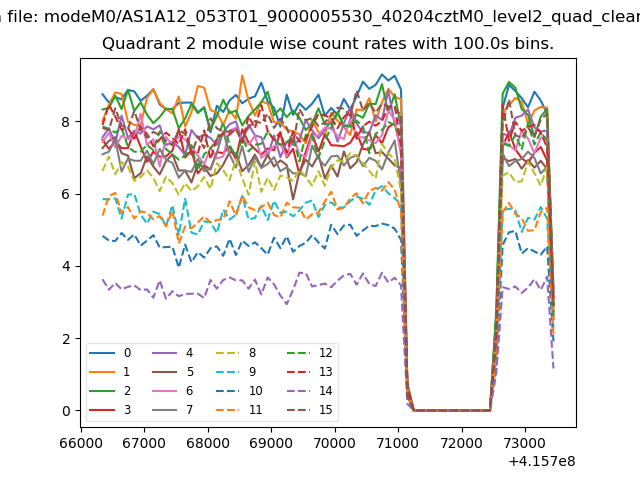
| Module-wise count rates for Quadrant B Data is divided into 100 sec bins |
 |
 |
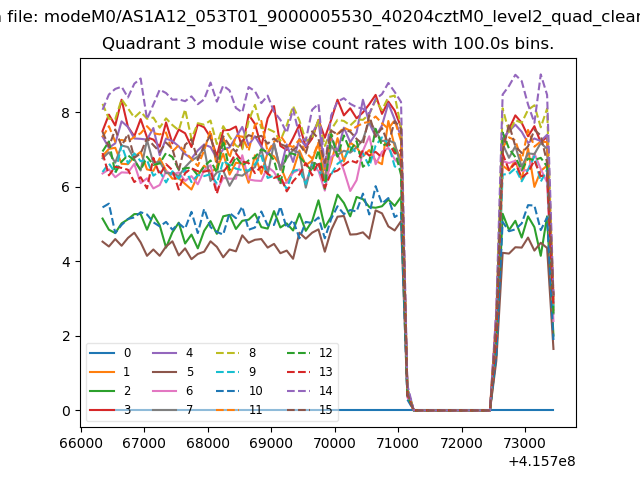
| Module-wise count rates for Quadrant C Data is divided into 100 sec bins |
 |
 |
| Module-wise count rates for Quadrant D Data is divided into 100 sec bins |
 |
 |
| Parameter | Plot |
|---|---|
| CZT HV Monitor | 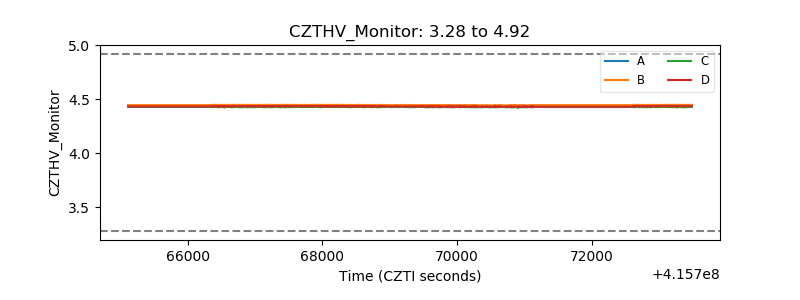 |
| D_VDD | 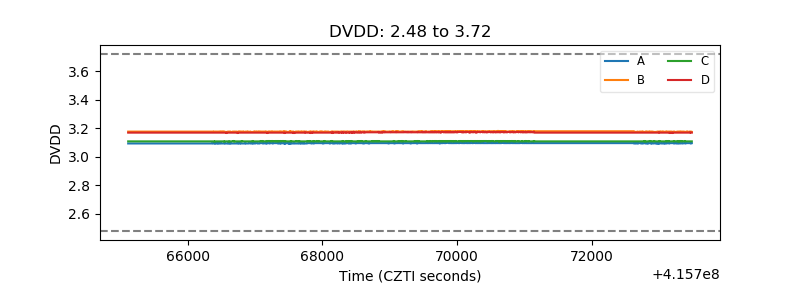 |
| Temperature 1 | 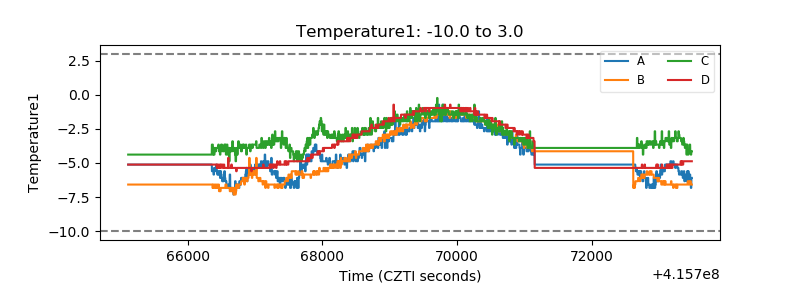 |
| Veto HV Monitor | 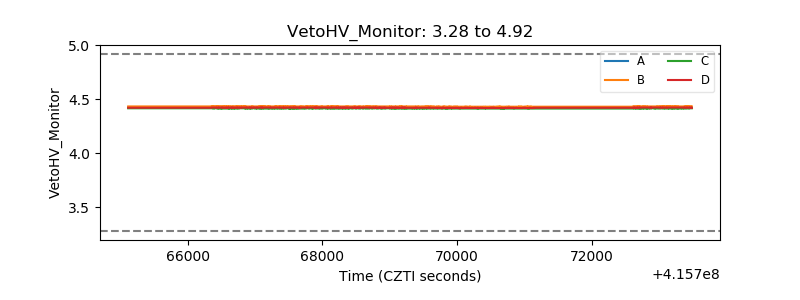 |
| Veto LLD | 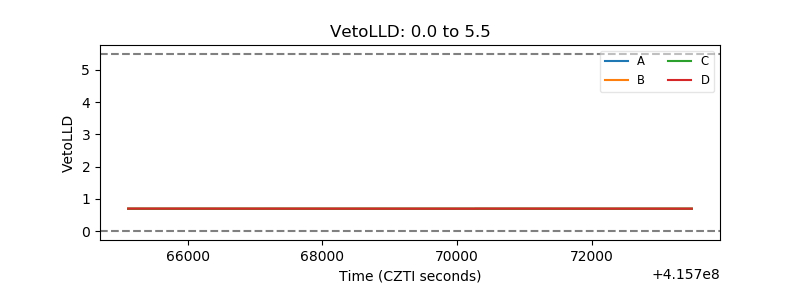 |
| Alpha Counter | 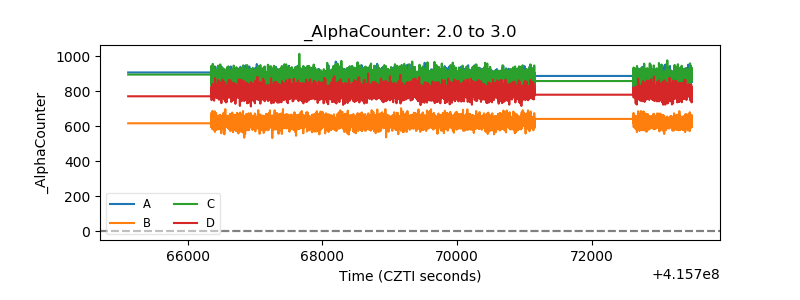 |
| _CPM_Rate | 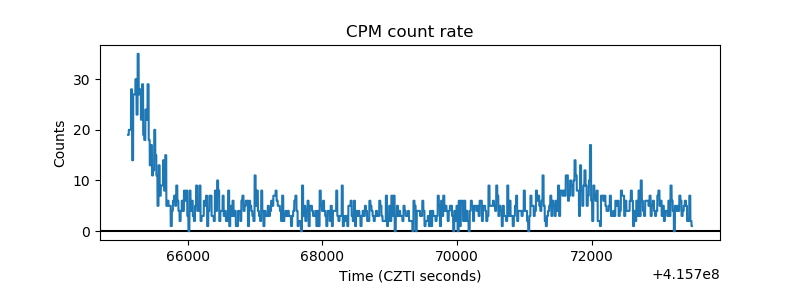 |
| CZT Counter | 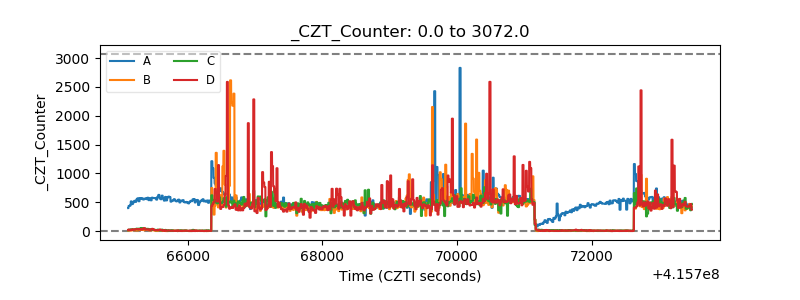 |
| +2.5 Volts monitor | 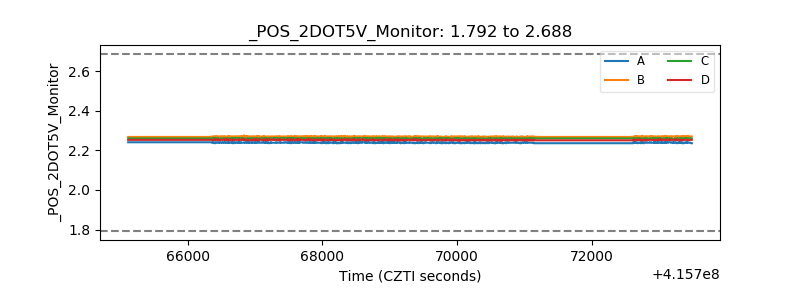 |
| +5 Volts monitor | 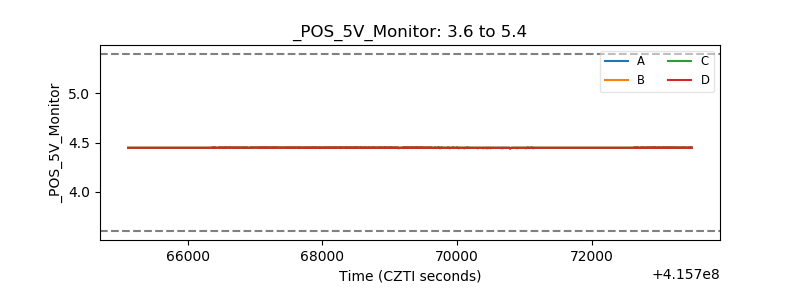 |
| _ROLL_ROT | 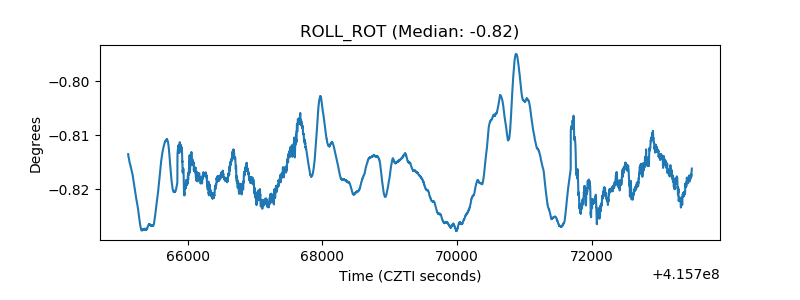 |
| _Roll_DEC | 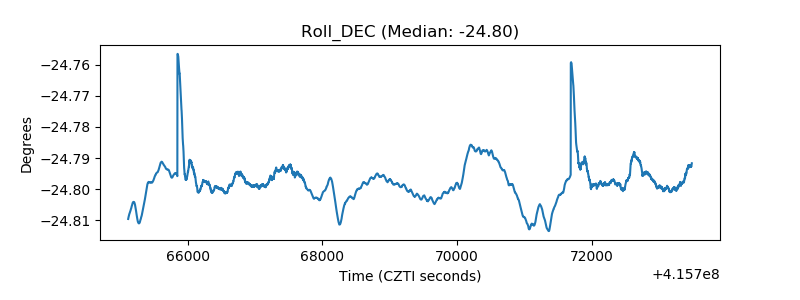 |
| _Roll_RA | 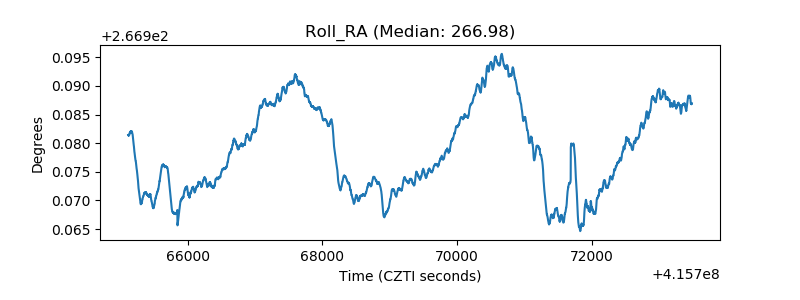 |
| Veto Counter |  |