| Param | Original file | Final file |
|---|---|---|
| Filename | modeM0/AS1A12_053T01_9000005530_40209cztM0_level2.fits | modeM0/AS1A12_053T01_9000005530_40209cztM0_level2_quad_clean.evt |
| Size (bytes) | 1,470,844,800 | 382,049,280 |
| Size | 1.4 GB | 364.4 MB |
| Events in quadrant A | 13,720,880 | 2,518,111 |
| Events in quadrant B | 12,210,817 | 2,604,778 |
| Events in quadrant C | 11,477,433 | 2,551,577 |
| Events in quadrant D | 15,223,233 | 2,279,783 |
| Mode M0 | |||
|---|---|---|---|
| Quadrant | BADHDUFLAG | Total packets | Discarded packets |
| A | 0 | 54503 | 5 |
| B | 0 | 51573 | 5 |
| C | 0 | 48281 | 5 |
| D | 0 | 61391 | 5 |
| Mode SS | |||
|---|---|---|---|
| Quadrant | BADHDUFLAG | Total packets | Discarded packets |
| A | 0 | 476 | 0 |
| B | 0 | 476 | 0 |
| C | 0 | 476 | 0 |
| D | 0 | 476 | 0 |
| Mode M9 | |||
|---|---|---|---|
| Quadrant | BADHDUFLAG | Total packets | Discarded packets |
| A | 0 | 66 | 0 |
| B | 0 | 66 | 0 |
| C | 0 | 66 | 0 |
| D | 0 | 67 | 0 |
| Quadrant | Total seconds | Saturated seconds | Saturation percentage |
|---|---|---|---|
| A | 23439 | 477 | 2.035070% |
| B | 23439 | 305 | 1.301250% |
| C | 23439 | 28 | 0.119459% |
| D | 23439 | 924 | 3.942148% |
Noise dominated data is calculated using 1-second bins in cleaned event files. If a bin has >2000 counts, and if more than 50% of those come from <1% of pixels, then it is considered to be noise-dominated and hence unusable.
| Quadrant | # 1 sec bins | Bins with >0 counts | Bins with >2000 counts | High rate bins dominated by noise | Noise dominated (total time) | Noise dominated (detector-on time) | Marked lightcurve |
|---|---|---|---|---|---|---|---|
| A | 28901 | 23443 | 319 | 319 | 1.10% | 1.36% | 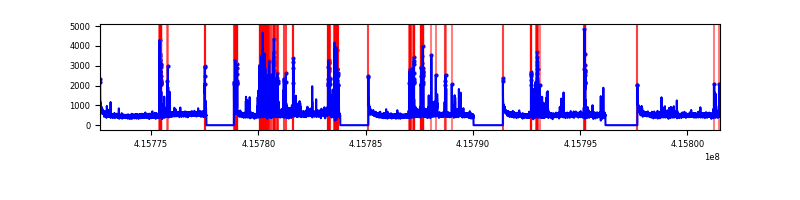 |
| B | 28901 | 23443 | 196 | 196 | 0.68% | 0.84% | 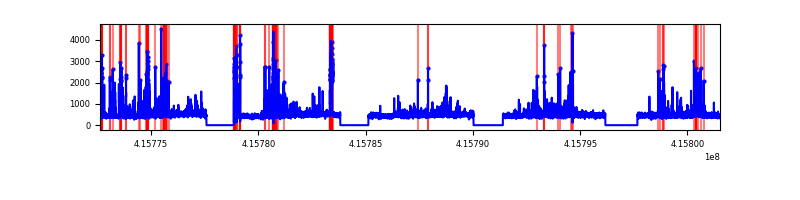 |
| C | 28901 | 23443 | 14 | 14 | 0.05% | 0.06% |  |
| D | 28901 | 23442 | 794 | 794 | 2.75% | 3.39% | 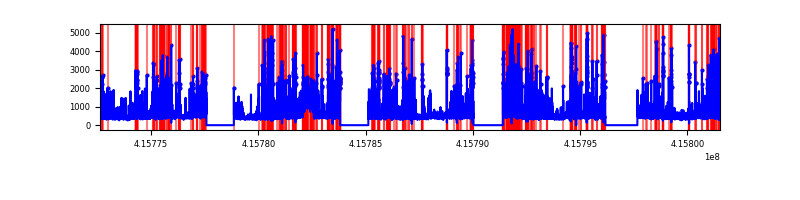 |
Top three noisy pixels from each quadrant. If the there are fewer than three noisy pixels in the level2.evt file, extra rows are filled as -1
| Pixel properties | Quadrant properties | ||||||
|---|---|---|---|---|---|---|---|
| Quadrant | DetID | PixID | Counts | Sigma | Mean | Median | Sigma |
| A | 10 | 83 | 1869580 | 3546.76 | 2590 | 2537 | 526.4 |
| A | 13 | 248 | 1759343 | 3337.35 | 2590 | 2537 | 526.4 |
| A | 9 | 143 | 34714 | 61.13 | 2590 | 2537 | 526.4 |
| B | 5 | 255 | 728170 | 1465.25 | 2584 | 2512 | 495.2 |
| B | 0 | 245 | 295074 | 590.74 | 2584 | 2512 | 495.2 |
| B | 5 | 172 | 238207 | 475.92 | 2584 | 2512 | 495.2 |
| C | 15 | 214 | 983911 | 1656.72 | 2557 | 2576 | 592.3 |
| C | 9 | 187 | 169168 | 281.25 | 2557 | 2576 | 592.3 |
| C | 4 | 254 | 117767 | 194.47 | 2557 | 2576 | 592.3 |
| D | 12 | 227 | 2777988 | 4527.98 | 2517 | 2449 | 613.0 |
| D | 12 | 218 | 791432 | 1287.14 | 2517 | 2449 | 613.0 |
| D | 13 | 249 | 710068 | 1154.4 | 2517 | 2449 | 613.0 |
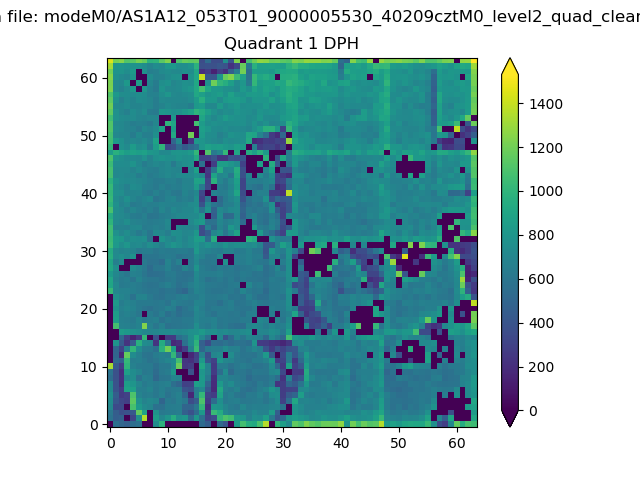
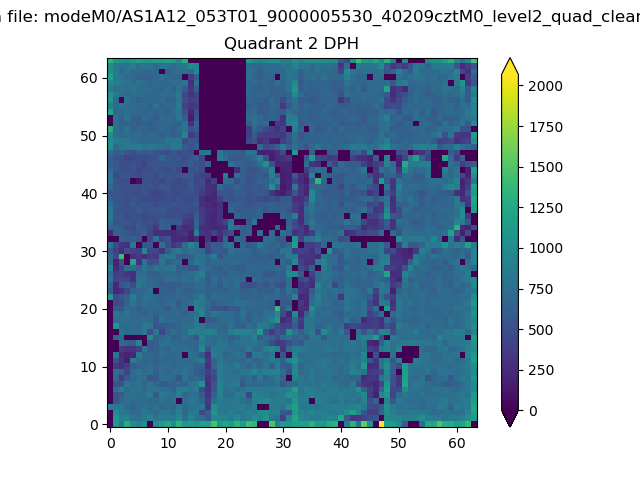
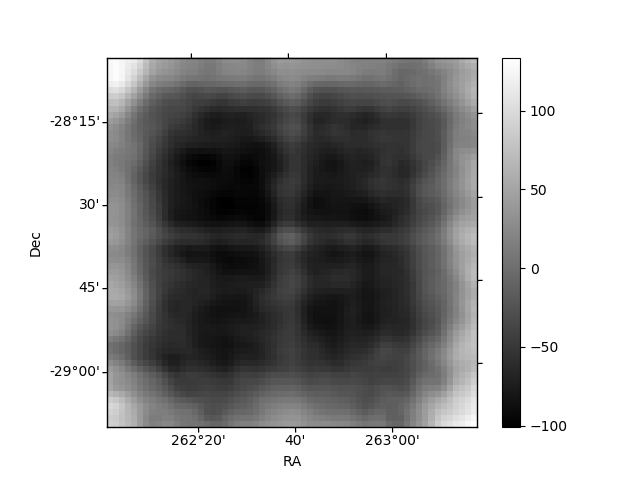
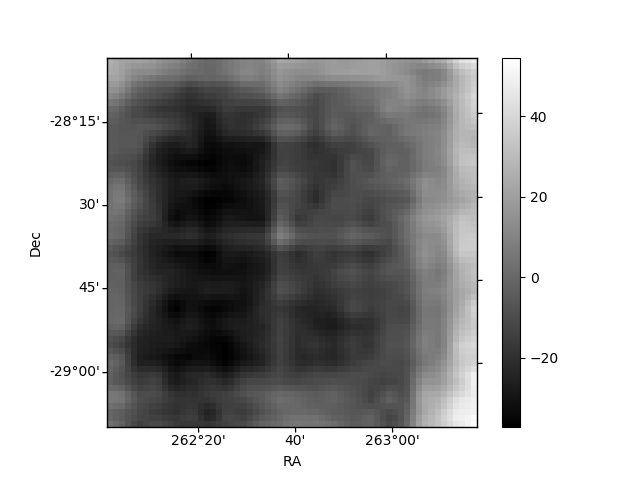
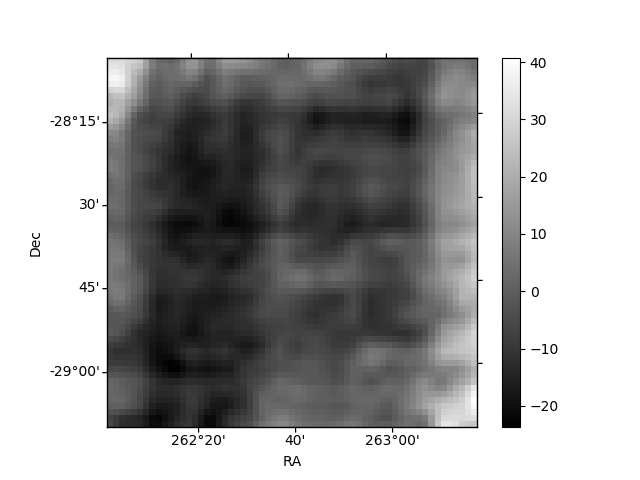
Histogram calculated using DETX and DETY for each event in the final _common_clean file
| Quadrant A | 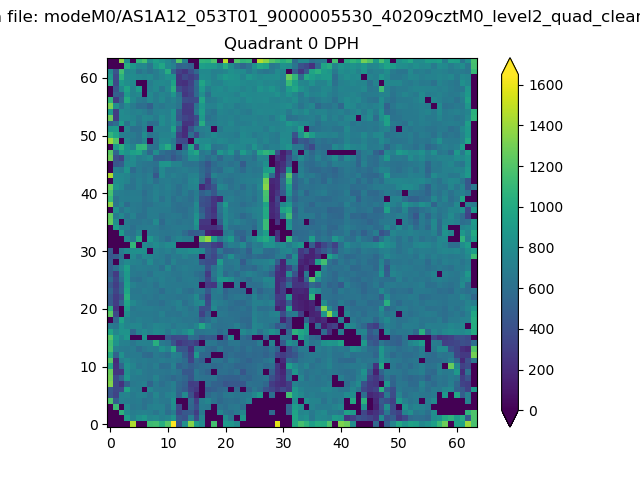 |
 |
Quadrant B |
|---|---|---|---|
| Quadrant D | 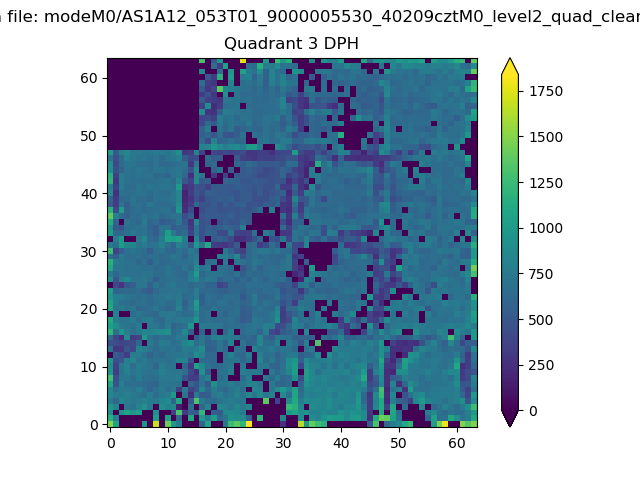 |
 |
Quadrant C |
| Plot type | Count rate plots | Images |
|---|---|---|
| Comparison with Poisson distribution Blue bars denote a histogram of data divided into 1 sec bins. Red curve is a Poisson curve with rate = median count rate of data. |
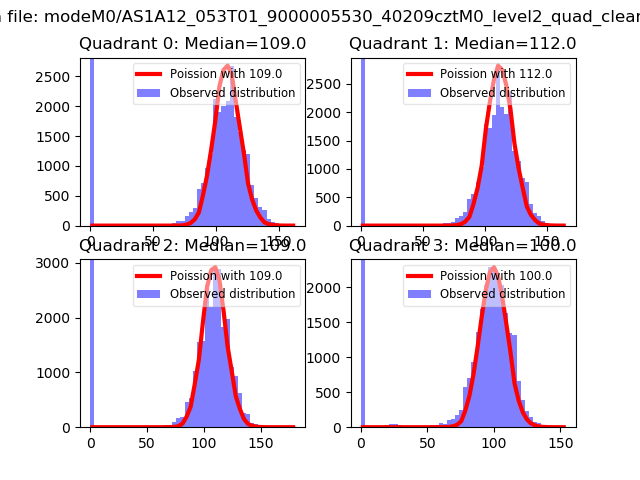 |
 |
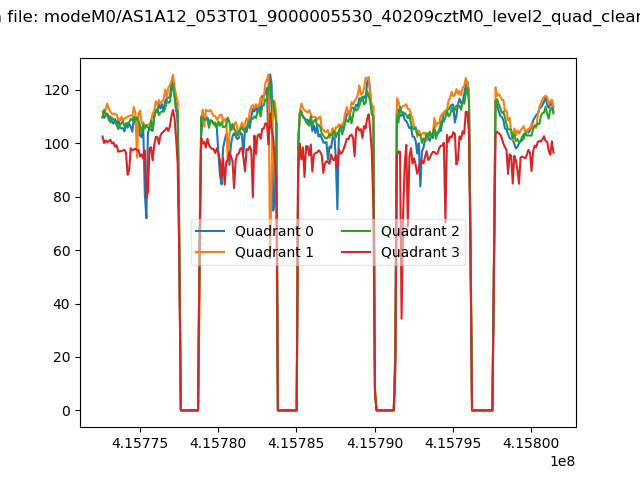
| Quadrant-wise count rates Data is divided into 100 sec bins |
 |
|
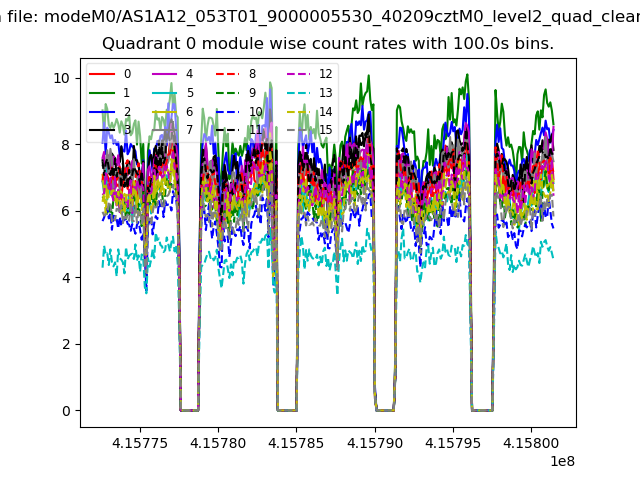
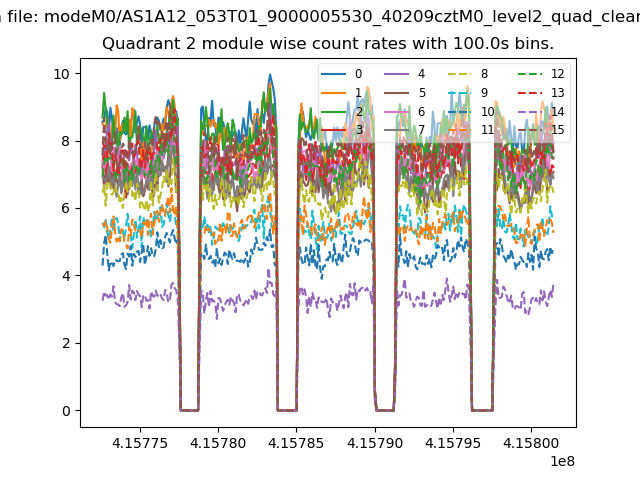
| Module-wise count rates for Quadrant A Data is divided into 100 sec bins |
 |
 |
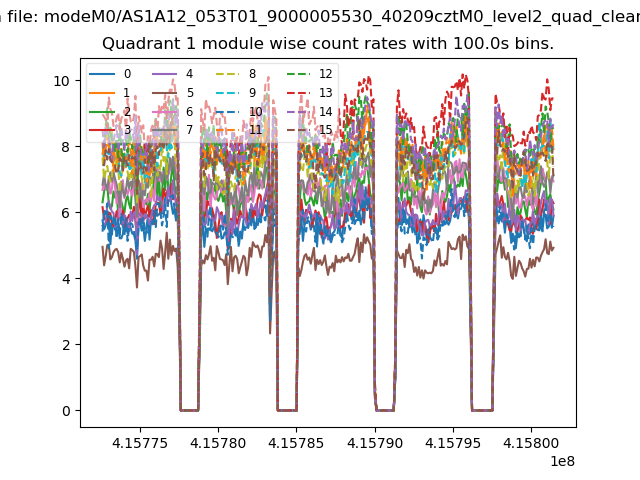
| Module-wise count rates for Quadrant B Data is divided into 100 sec bins |
 |
 |
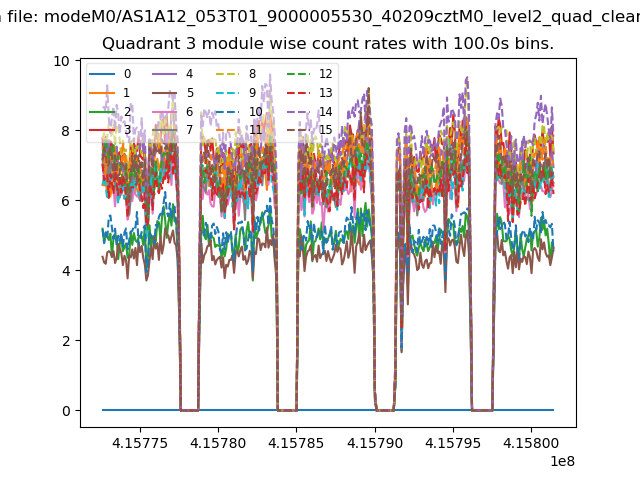
| Module-wise count rates for Quadrant C Data is divided into 100 sec bins |
 |
 |
| Module-wise count rates for Quadrant D Data is divided into 100 sec bins |
 |
 |
| Parameter | Plot |
|---|---|
| CZT HV Monitor | 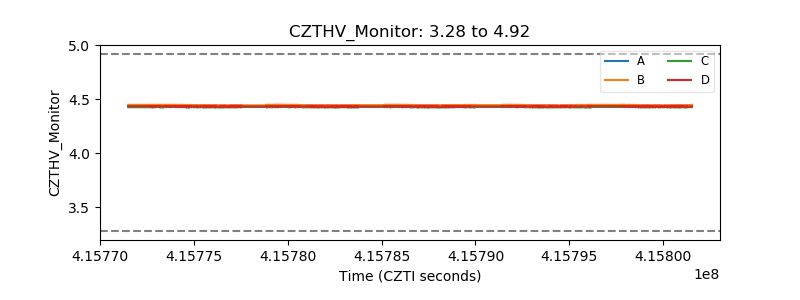 |
| D_VDD | 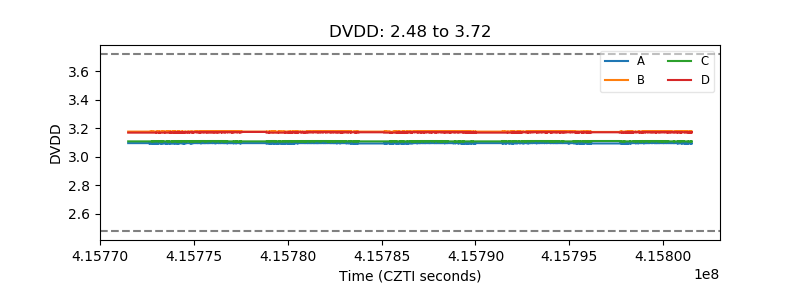 |
| Temperature 1 | 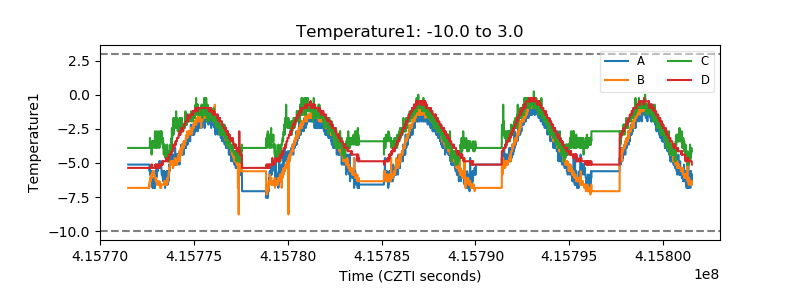 |
| Veto HV Monitor | 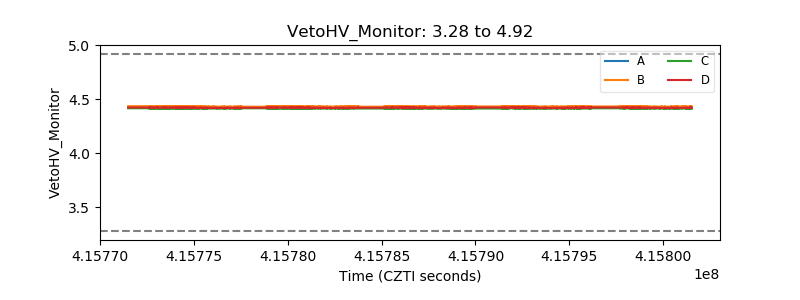 |
| Veto LLD | 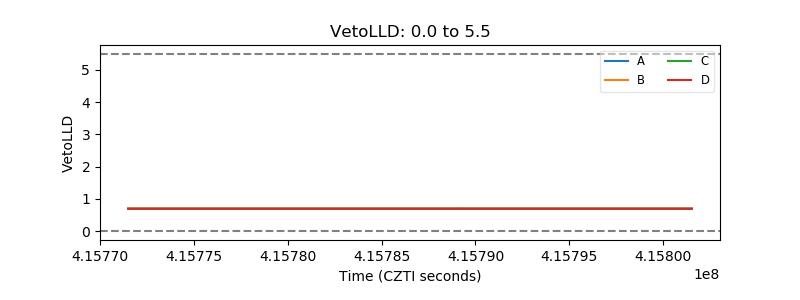 |
| Alpha Counter | 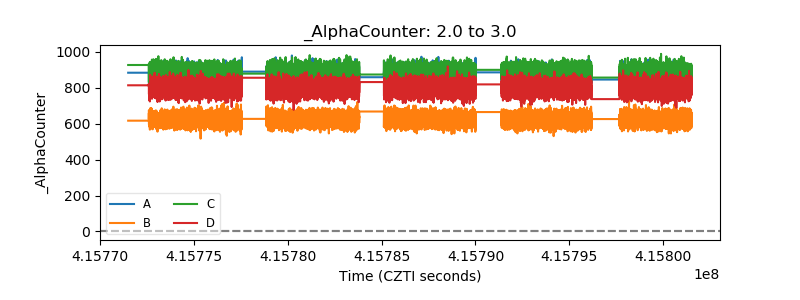 |
| _CPM_Rate | 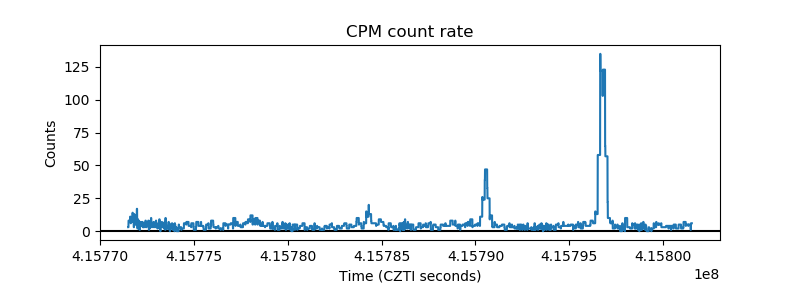 |
| CZT Counter | 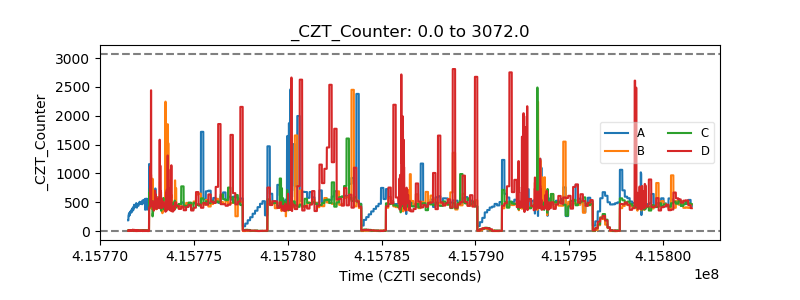 |
| +2.5 Volts monitor | 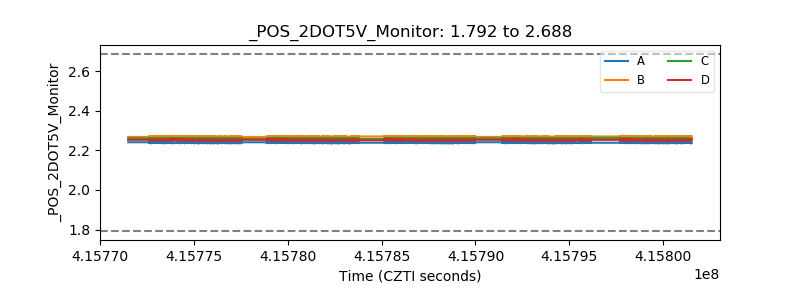 |
| +5 Volts monitor | 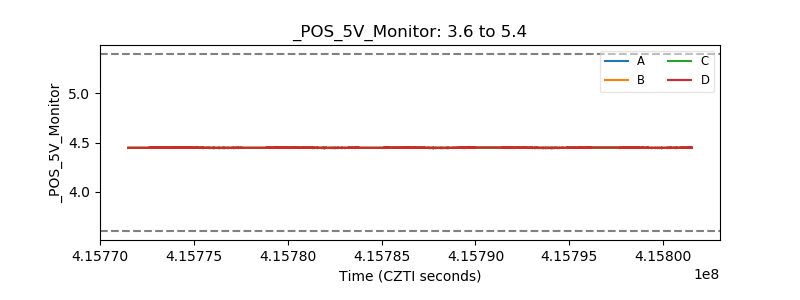 |
| _ROLL_ROT | 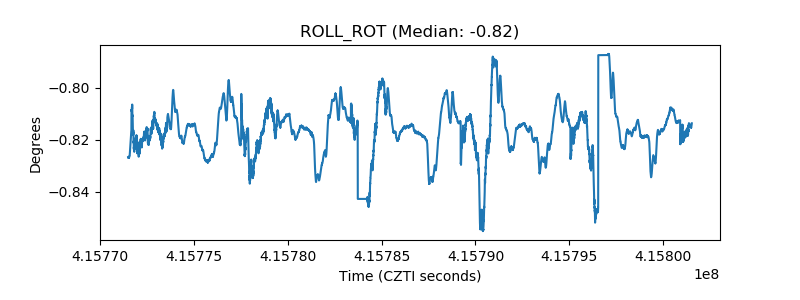 |
| _Roll_DEC | 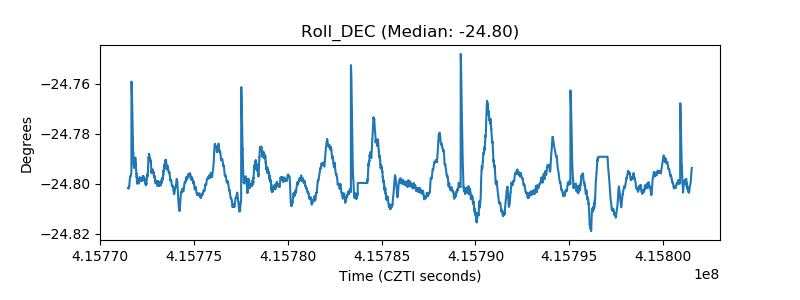 |
| _Roll_RA | 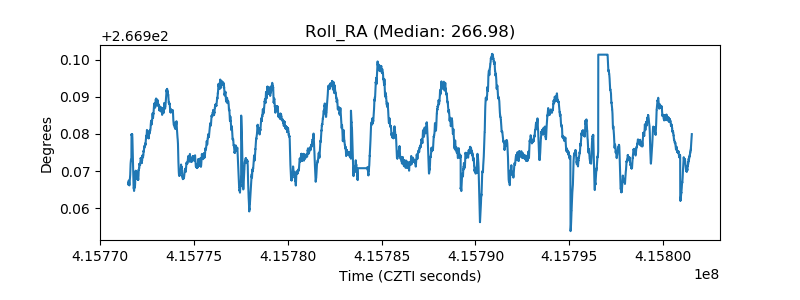 |
| Veto Counter | 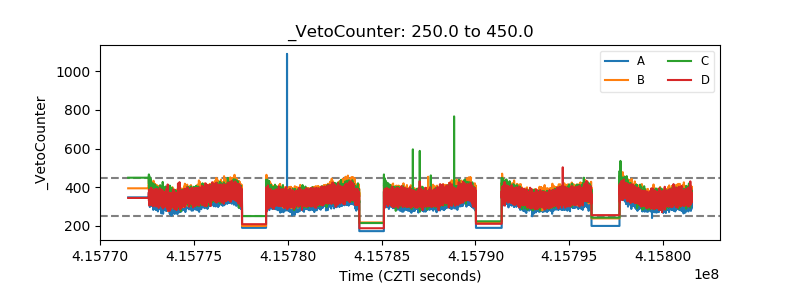 |