| Param | Original file | Final file |
|---|---|---|
| Filename | modeM0/AS1C07_001T01_9000005532_40209cztM0_level2.fits | modeM0/AS1C07_001T01_9000005532_40209cztM0_level2_quad_clean.evt |
| Size (bytes) | 66,974,400 | 17,850,240 |
| Size | 63.9 MB | 17.0 MB |
| Events in quadrant A | 671,257 | 119,006 |
| Events in quadrant B | 519,173 | 122,991 |
| Events in quadrant C | 554,377 | 114,724 |
| Events in quadrant D | 650,511 | 104,838 |
| Mode M0 | |||
|---|---|---|---|
| Quadrant | BADHDUFLAG | Total packets | Discarded packets |
| A | 0 | 2658 | 2 |
| B | 0 | 2156 | 1 |
| C | 0 | 2242 | 1 |
| D | 0 | 2622 | 1 |
| Mode M9 | |||
|---|---|---|---|
| Quadrant | BADHDUFLAG | Total packets | Discarded packets |
| A | 0 | 14 | 0 |
| B | 0 | 14 | 0 |
| C | 0 | 14 | 0 |
| D | 0 | 14 | 0 |
| Mode SS | |||
|---|---|---|---|
| Quadrant | BADHDUFLAG | Total packets | Discarded packets |
| A | 0 | 20 | 0 |
| B | 0 | 20 | 0 |
| C | 0 | 20 | 0 |
| D | 0 | 20 | 0 |
| Quadrant | Total seconds | Saturated seconds | Saturation percentage |
|---|---|---|---|
| A | 1035 | 8 | 0.772947% |
| B | 1035 | 4 | 0.386473% |
| C | 1035 | 5 | 0.483092% |
| D | 1035 | 27 | 2.608696% |
Noise dominated data is calculated using 1-second bins in cleaned event files. If a bin has >2000 counts, and if more than 50% of those come from <1% of pixels, then it is considered to be noise-dominated and hence unusable.
| Quadrant | # 1 sec bins | Bins with >0 counts | Bins with >2000 counts | High rate bins dominated by noise | Noise dominated (total time) | Noise dominated (detector-on time) | Marked lightcurve |
|---|---|---|---|---|---|---|---|
| A | 1035 | 1035 | 2 | 2 | 0.19% | 0.19% | 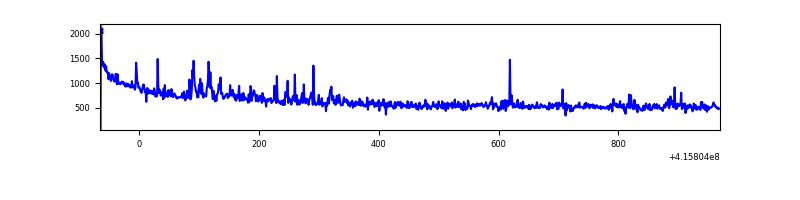 |
| B | 1035 | 1035 | 1 | 1 | 0.10% | 0.10% | 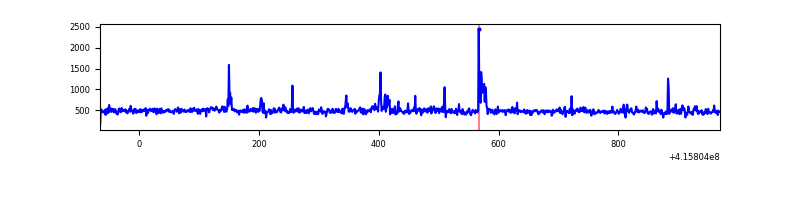 |
| C | 1035 | 1035 | 2 | 2 | 0.19% | 0.19% | 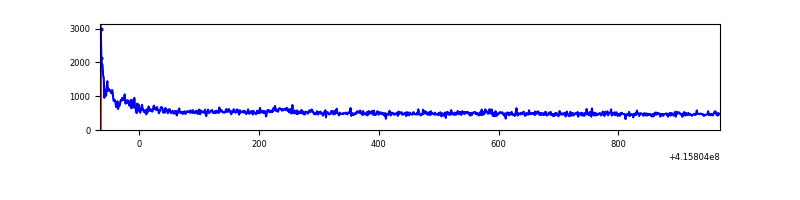 |
| D | 1035 | 1035 | 19 | 19 | 1.84% | 1.84% | 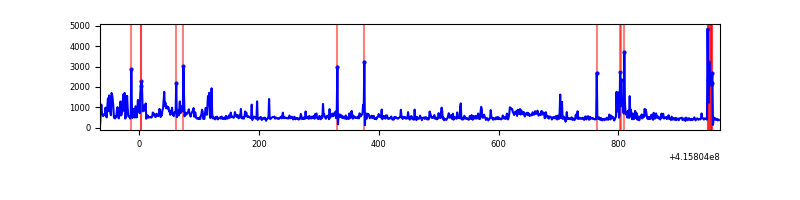 |
Top three noisy pixels from each quadrant. If the there are fewer than three noisy pixels in the level2.evt file, extra rows are filled as -1
| Pixel properties | Quadrant properties | ||||||
|---|---|---|---|---|---|---|---|
| Quadrant | DetID | PixID | Counts | Sigma | Mean | Median | Sigma |
| A | 10 | 83 | 153046 | 5591.56 | 123 | 120 | 27.3 |
| A | 13 | 248 | 36090 | 1315.2 | 123 | 120 | 27.3 |
| A | 13 | 6 | 1729 | 58.83 | 123 | 120 | 27.3 |
| B | 5 | 255 | 23282 | 910.25 | 121 | 118 | 25.4 |
| B | 4 | 171 | 7359 | 284.54 | 121 | 118 | 25.4 |
| B | 0 | 245 | 5148 | 197.66 | 121 | 118 | 25.4 |
| C | 15 | 214 | 48166 | 1654.48 | 118 | 118 | 29.0 |
| C | 10 | 20 | 22243 | 761.85 | 118 | 118 | 29.0 |
| C | 0 | 10 | 13466 | 459.62 | 118 | 118 | 29.0 |
| D | 12 | 227 | 158361 | 5101.86 | 118 | 114 | 31.0 |
| D | 13 | 249 | 7781 | 247.18 | 118 | 114 | 31.0 |
| D | 5 | 171 | 6565 | 207.98 | 118 | 114 | 31.0 |
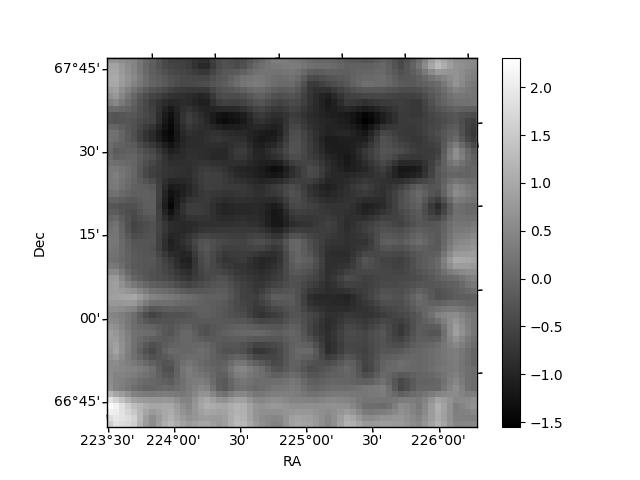
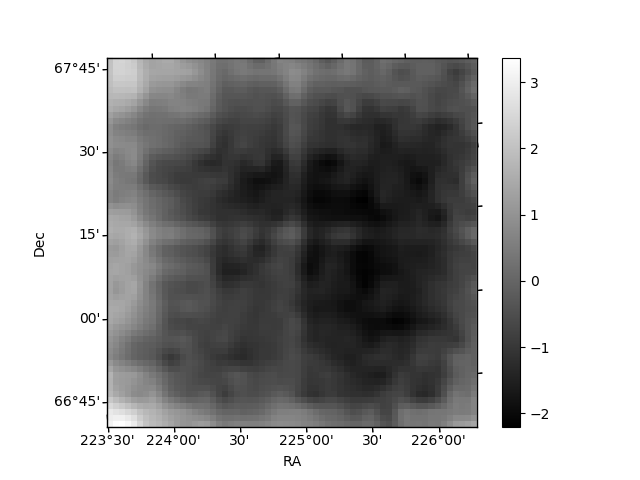
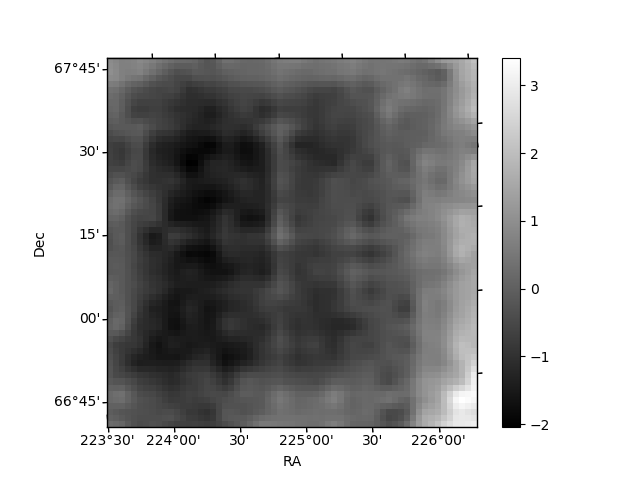
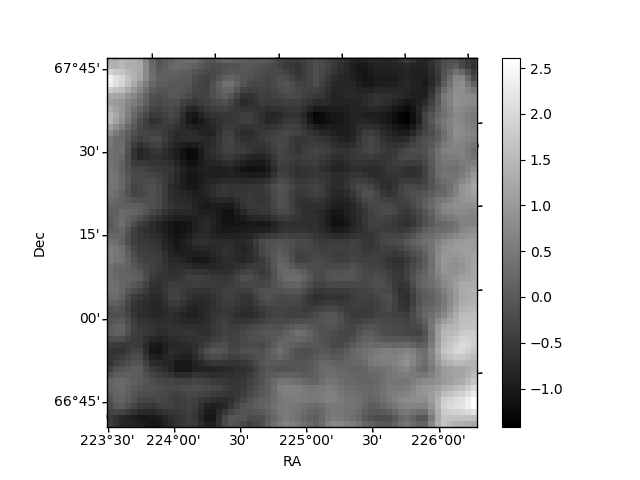
Histogram calculated using DETX and DETY for each event in the final _common_clean file
| Quadrant A | 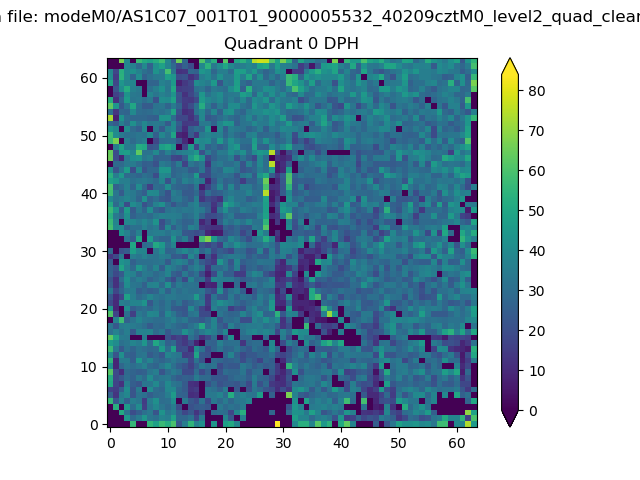 |
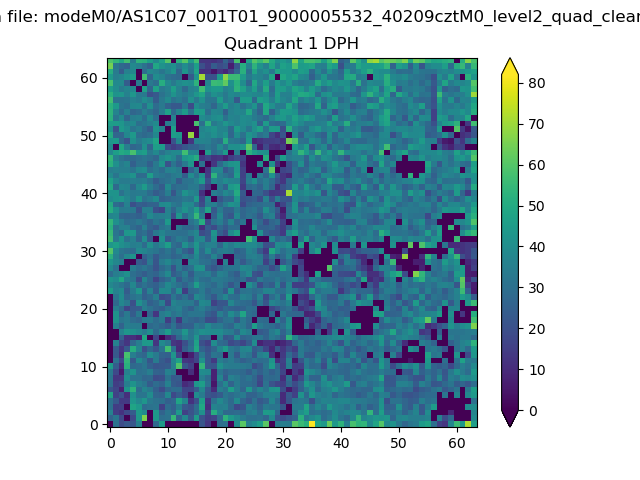 |
Quadrant B |
|---|---|---|---|
| Quadrant D | 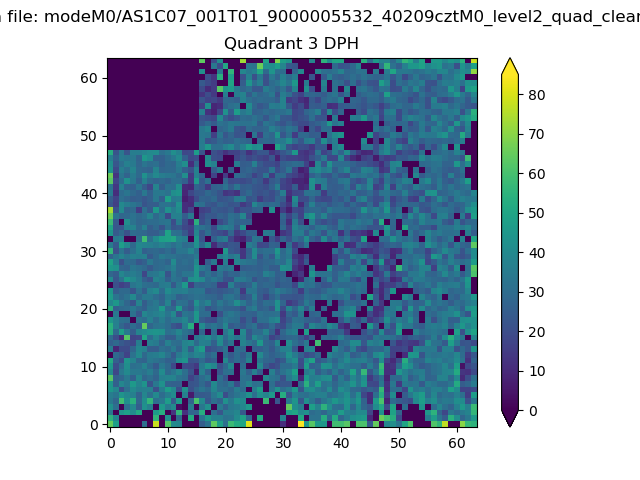 |
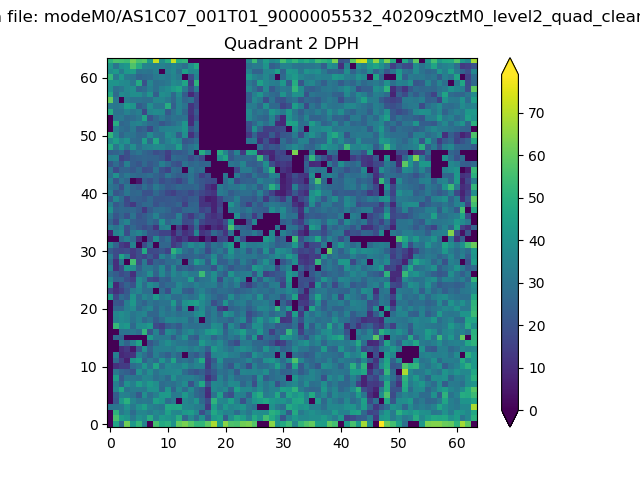 |
Quadrant C |
| Plot type | Count rate plots | Images |
|---|---|---|
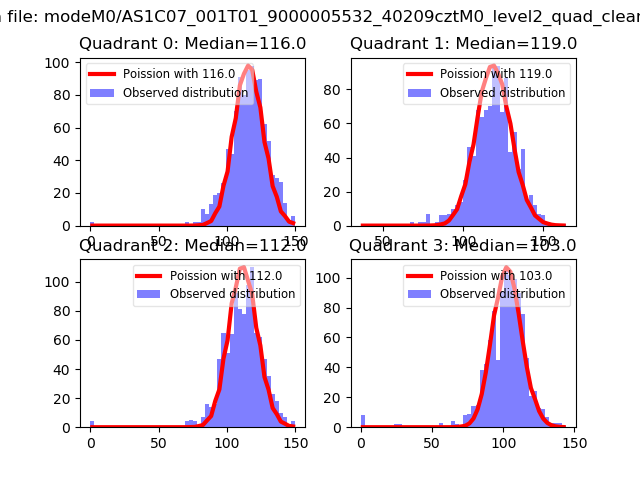
| Comparison with Poisson distribution Blue bars denote a histogram of data divided into 1 sec bins. Red curve is a Poisson curve with rate = median count rate of data. |
 |
 |
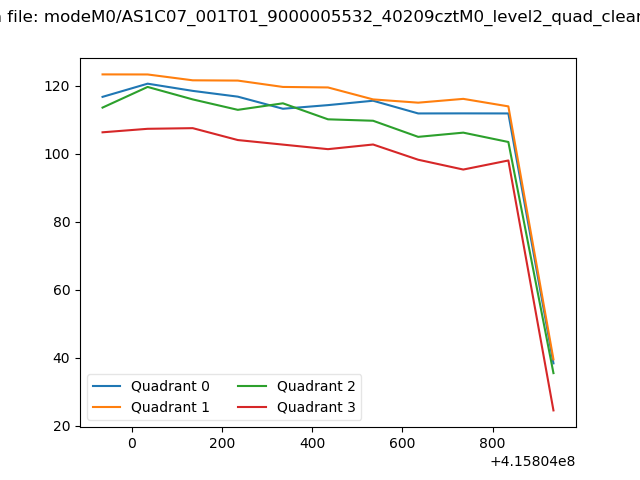
| Quadrant-wise count rates Data is divided into 100 sec bins |
 |
|
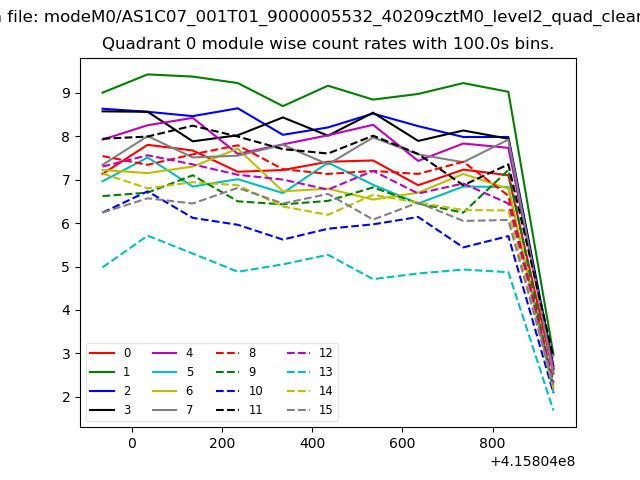
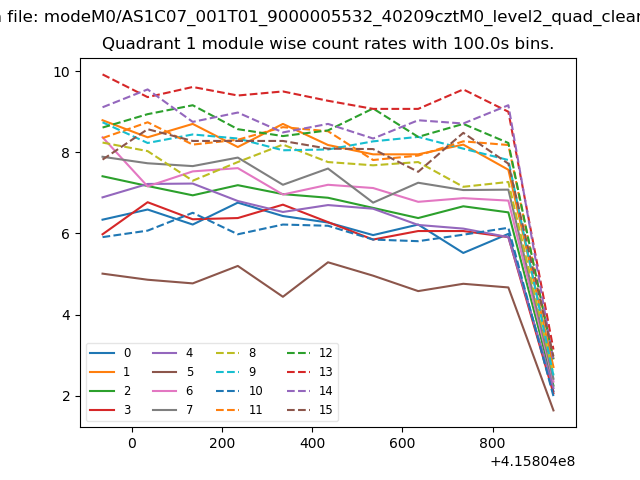
| Module-wise count rates for Quadrant A Data is divided into 100 sec bins |
 |
 |
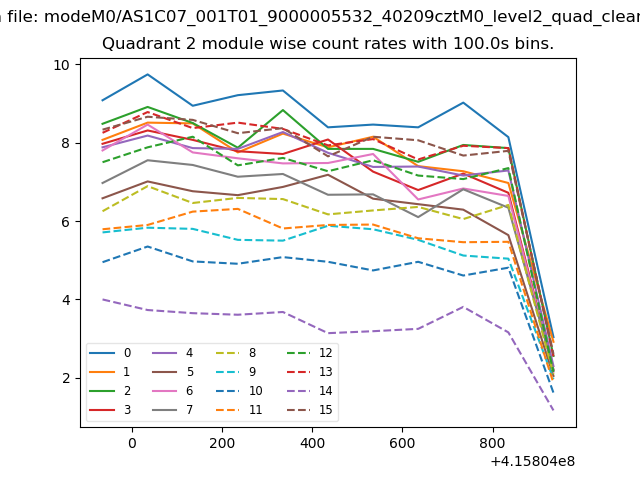
| Module-wise count rates for Quadrant B Data is divided into 100 sec bins |
 |
 |
| Module-wise count rates for Quadrant C Data is divided into 100 sec bins |
 |
 |
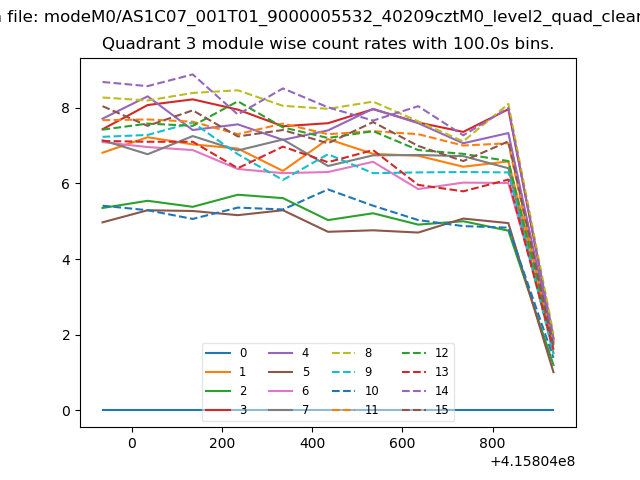
| Module-wise count rates for Quadrant D Data is divided into 100 sec bins |
 |
 |
| Parameter | Plot |
|---|---|
| CZT HV Monitor | 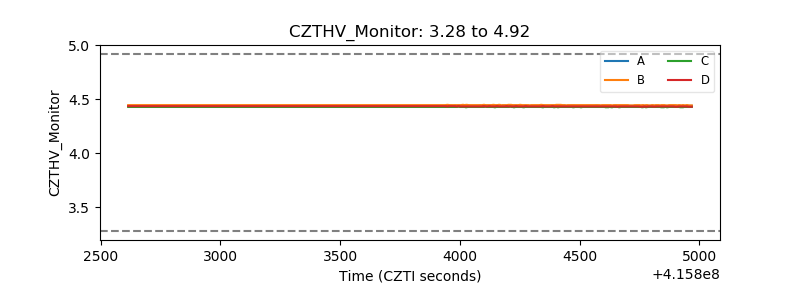 |
| D_VDD | 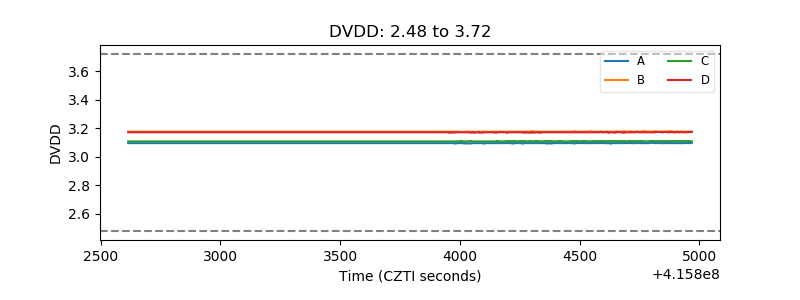 |
| Temperature 1 | 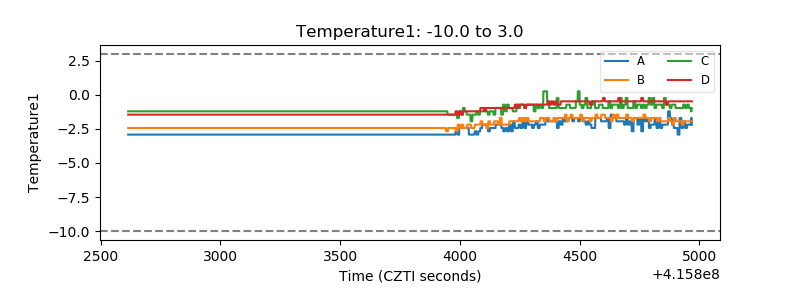 |
| Veto HV Monitor | 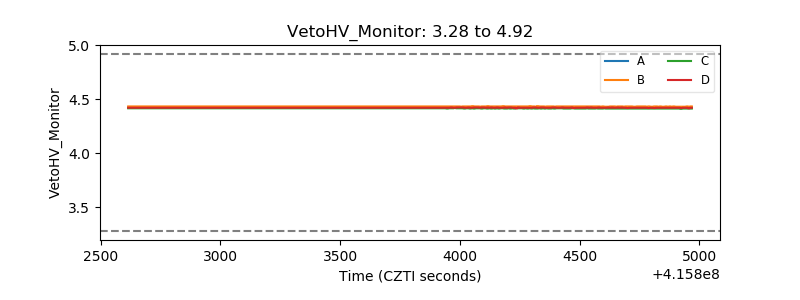 |
| Veto LLD | 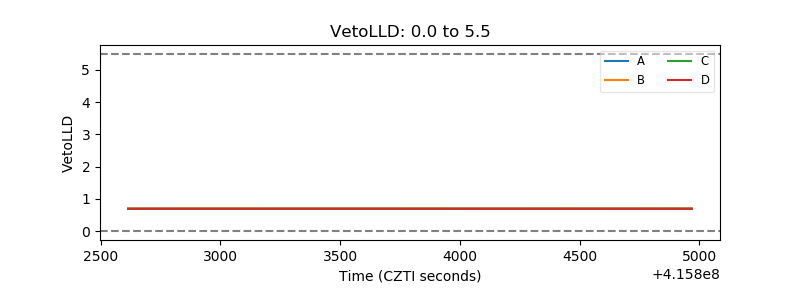 |
| Alpha Counter | 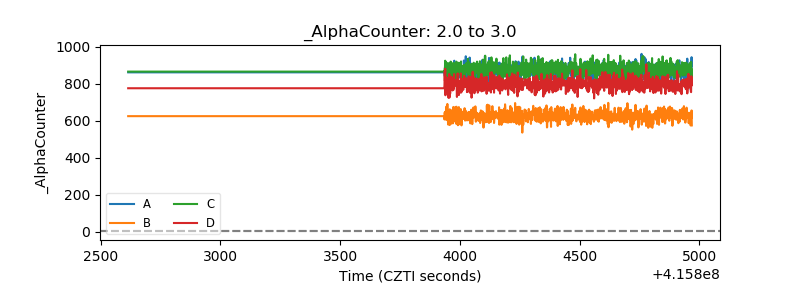 |
| _CPM_Rate | 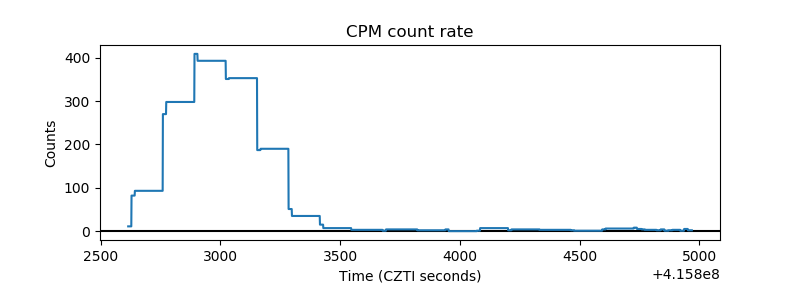 |
| CZT Counter | 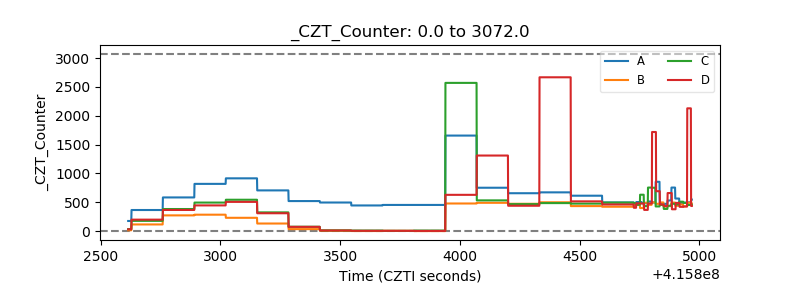 |
| +2.5 Volts monitor |  |
| +5 Volts monitor | 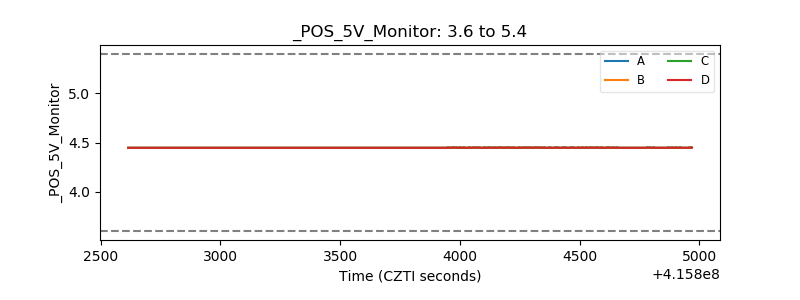 |
| _ROLL_ROT | 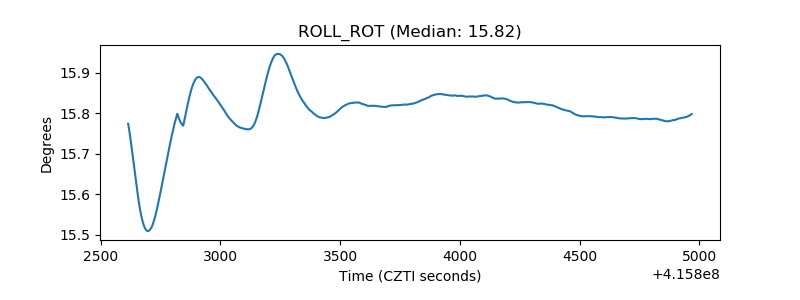 |
| _Roll_DEC | 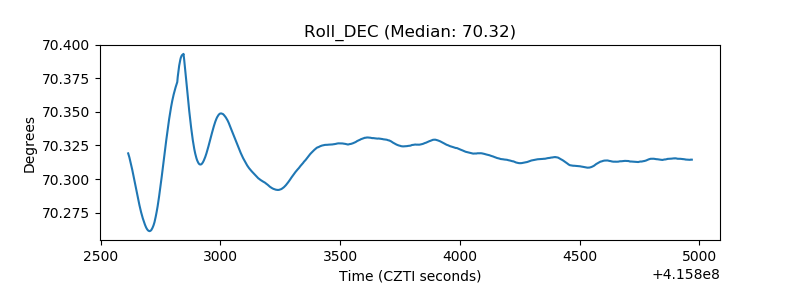 |
| _Roll_RA | 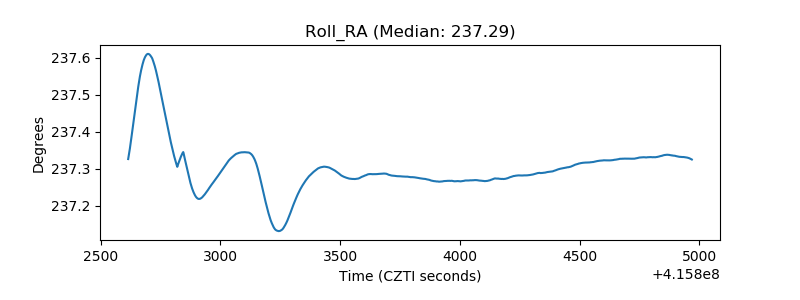 |
| Veto Counter | 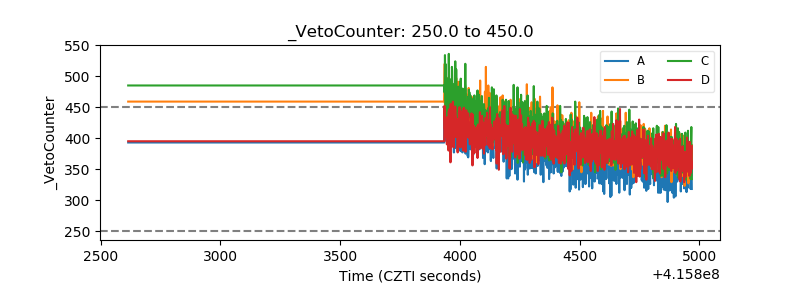 |