| Param | Original file | Final file |
|---|---|---|
| Filename | modeM0/AS1C07_001T01_9000005532_40211cztM0_level2.fits | modeM0/AS1C07_001T01_9000005532_40211cztM0_level2_quad_clean.evt |
| Size (bytes) | 328,302,720 | 92,292,480 |
| Size | 313.1 MB | 88.0 MB |
| Events in quadrant A | 2,977,614 | 621,547 |
| Events in quadrant B | 2,650,443 | 636,467 |
| Events in quadrant C | 2,728,585 | 603,820 |
| Events in quadrant D | 3,366,060 | 546,689 |
| Mode M0 | |||
|---|---|---|---|
| Quadrant | BADHDUFLAG | Total packets | Discarded packets |
| A | 0 | 12368 | 3 |
| B | 0 | 11712 | 2 |
| C | 0 | 11557 | 2 |
| D | 0 | 14089 | 2 |
| Mode M9 | |||
|---|---|---|---|
| Quadrant | BADHDUFLAG | Total packets | Discarded packets |
| A | 0 | 24 | 0 |
| B | 0 | 24 | 0 |
| C | 0 | 24 | 0 |
| D | 0 | 25 | 0 |
| Mode SS | |||
|---|---|---|---|
| Quadrant | BADHDUFLAG | Total packets | Discarded packets |
| A | 0 | 112 | 0 |
| B | 0 | 112 | 0 |
| C | 0 | 112 | 0 |
| D | 0 | 112 | 0 |
| Quadrant | Total seconds | Saturated seconds | Saturation percentage |
|---|---|---|---|
| A | 5518 | 17 | 0.308083% |
| B | 5518 | 30 | 0.543675% |
| C | 5518 | 14 | 0.253715% |
| D | 5518 | 198 | 3.588257% |
Noise dominated data is calculated using 1-second bins in cleaned event files. If a bin has >2000 counts, and if more than 50% of those come from <1% of pixels, then it is considered to be noise-dominated and hence unusable.
| Quadrant | # 1 sec bins | Bins with >0 counts | Bins with >2000 counts | High rate bins dominated by noise | Noise dominated (total time) | Noise dominated (detector-on time) | Marked lightcurve |
|---|---|---|---|---|---|---|---|
| A | 7251 | 5519 | 6 | 6 | 0.08% | 0.11% | 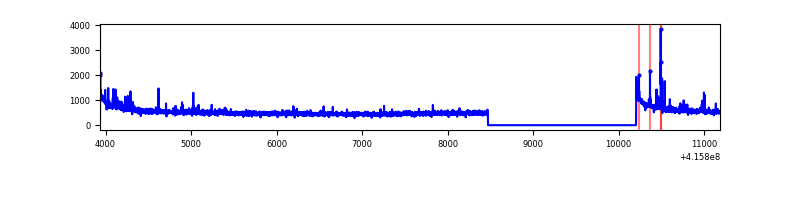 |
| B | 7251 | 5519 | 16 | 16 | 0.22% | 0.29% | 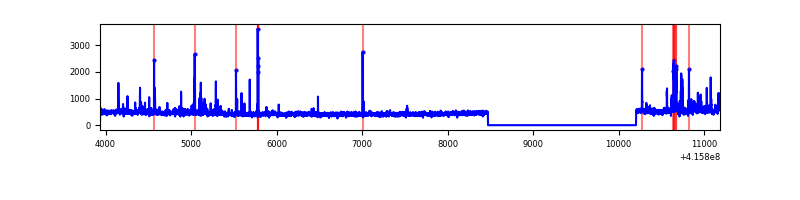 |
| C | 7251 | 5519 | 12 | 12 | 0.17% | 0.22% | 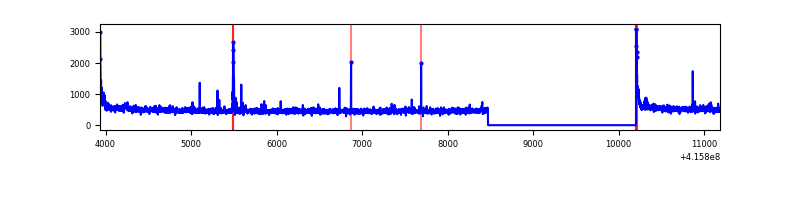 |
| D | 7251 | 5519 | 172 | 172 | 2.37% | 3.12% | 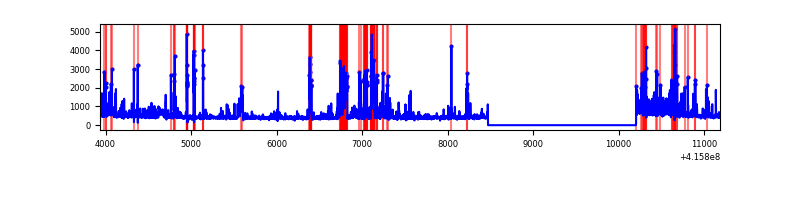 |
Top three noisy pixels from each quadrant. If the there are fewer than three noisy pixels in the level2.evt file, extra rows are filled as -1
| Pixel properties | Quadrant properties | ||||||
|---|---|---|---|---|---|---|---|
| Quadrant | DetID | PixID | Counts | Sigma | Mean | Median | Sigma |
| A | 10 | 83 | 506883 | 4075.19 | 609 | 596 | 124.2 |
| A | 13 | 248 | 94502 | 755.87 | 609 | 596 | 124.2 |
| A | 2 | 79 | 11433 | 87.23 | 609 | 596 | 124.2 |
| B | 5 | 255 | 124724 | 1057.54 | 607 | 590 | 117.4 |
| B | 0 | 245 | 42767 | 359.32 | 607 | 590 | 117.4 |
| B | 15 | 85 | 41672 | 349.99 | 607 | 590 | 117.4 |
| C | 15 | 214 | 236397 | 1696.22 | 599 | 602 | 139.0 |
| C | 9 | 187 | 53695 | 381.93 | 599 | 602 | 139.0 |
| C | 0 | 10 | 36136 | 255.62 | 599 | 602 | 139.0 |
| D | 12 | 227 | 323079 | 2256.88 | 588 | 570 | 142.9 |
| D | 12 | 218 | 308849 | 2157.3 | 588 | 570 | 142.9 |
| D | 13 | 249 | 235961 | 1647.23 | 588 | 570 | 142.9 |
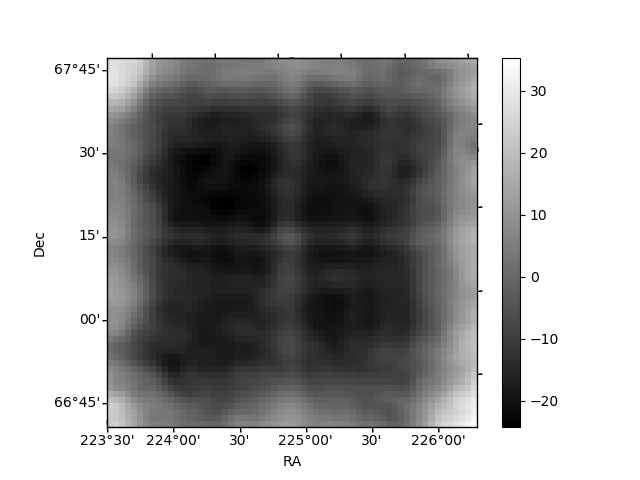
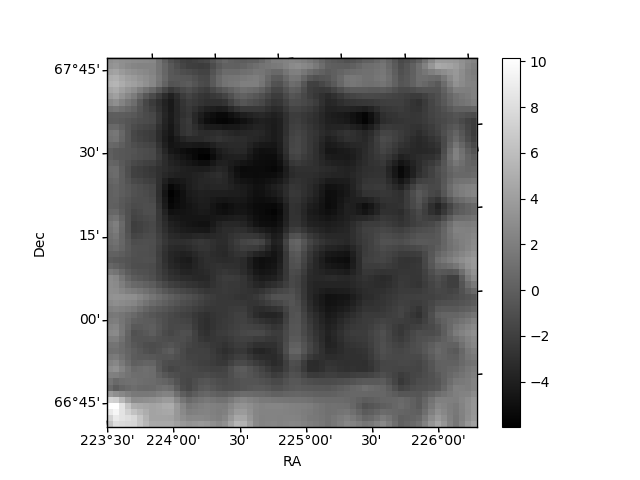
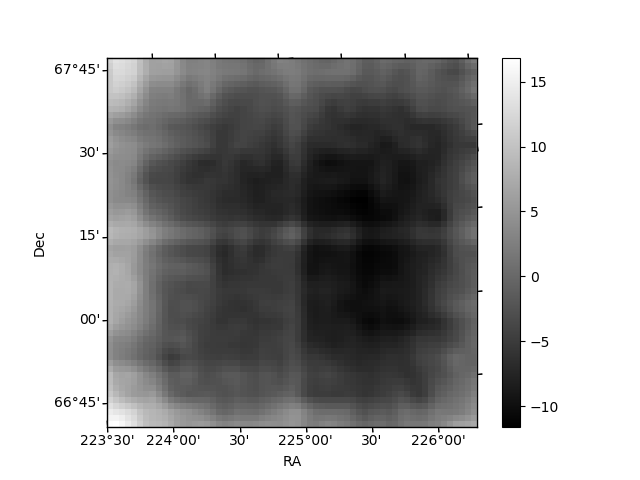
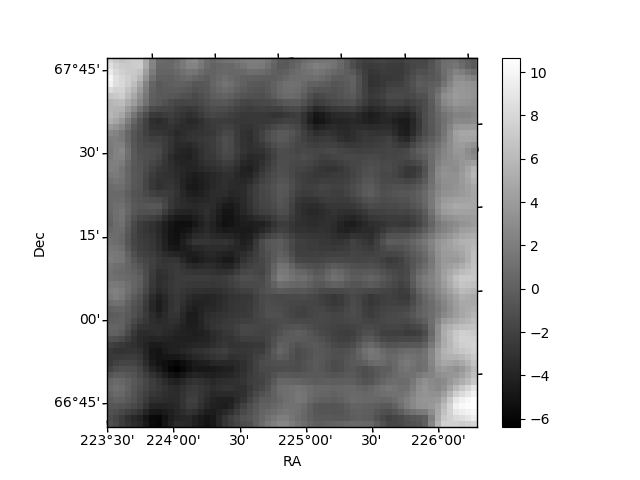
Histogram calculated using DETX and DETY for each event in the final _common_clean file
| Quadrant A | 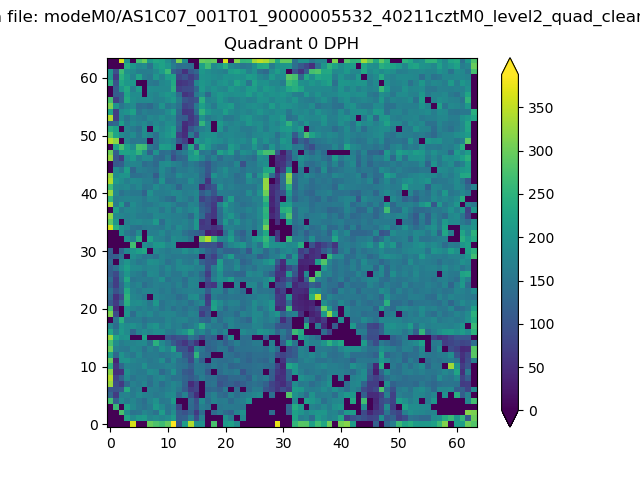 |
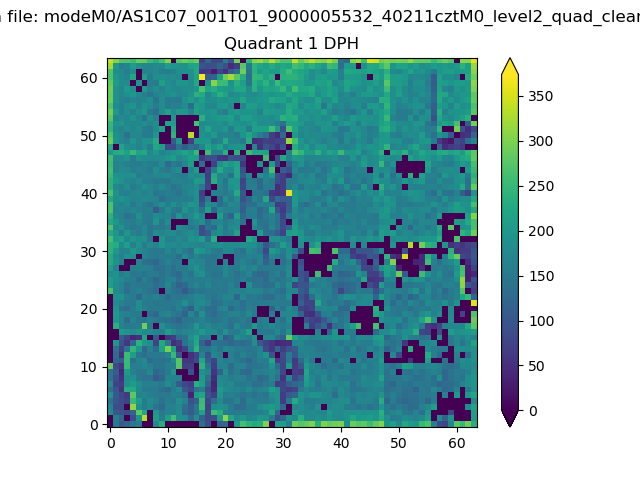 |
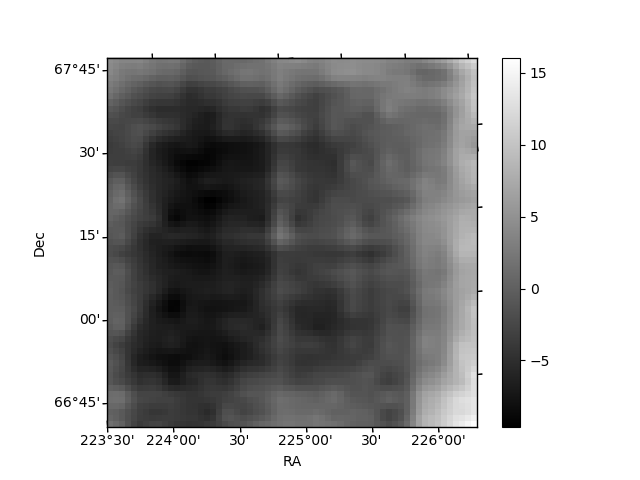
Quadrant B |
|---|---|---|---|
| Quadrant D | 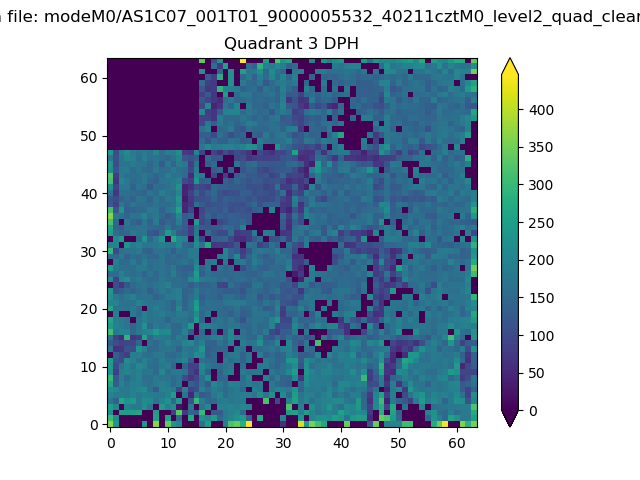 |
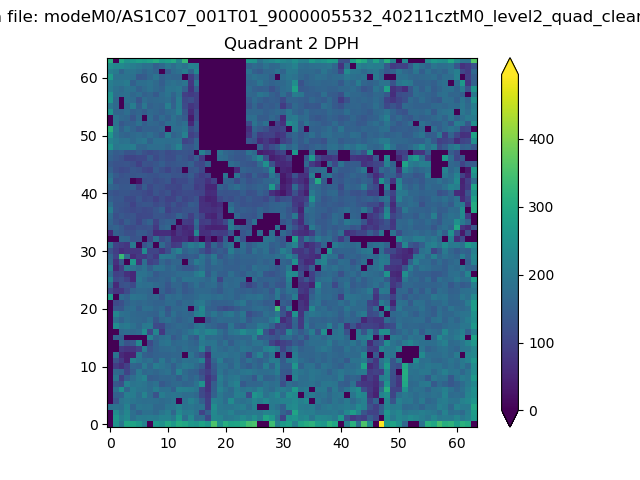 |
Quadrant C |
| Plot type | Count rate plots | Images |
|---|---|---|
| Comparison with Poisson distribution Blue bars denote a histogram of data divided into 1 sec bins. Red curve is a Poisson curve with rate = median count rate of data. |
 |
 |
| Quadrant-wise count rates Data is divided into 100 sec bins |
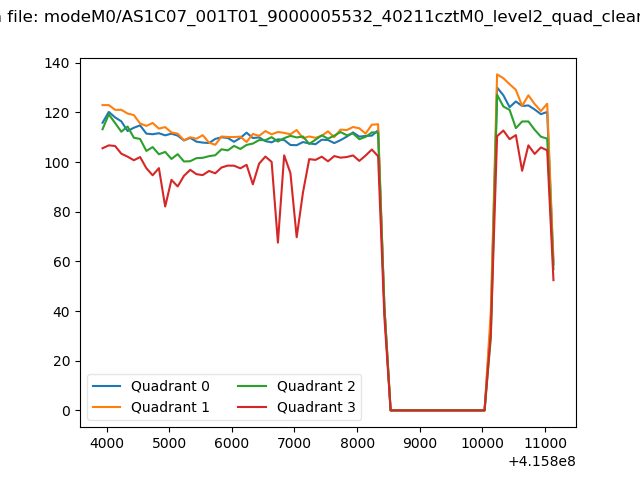 |
|
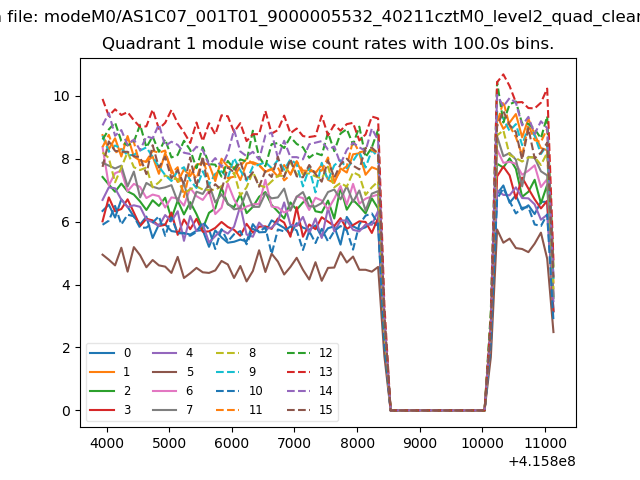
| Module-wise count rates for Quadrant A Data is divided into 100 sec bins |
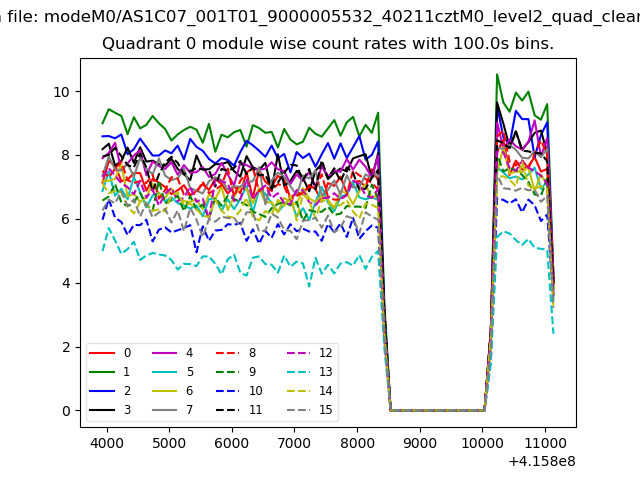 |
 |
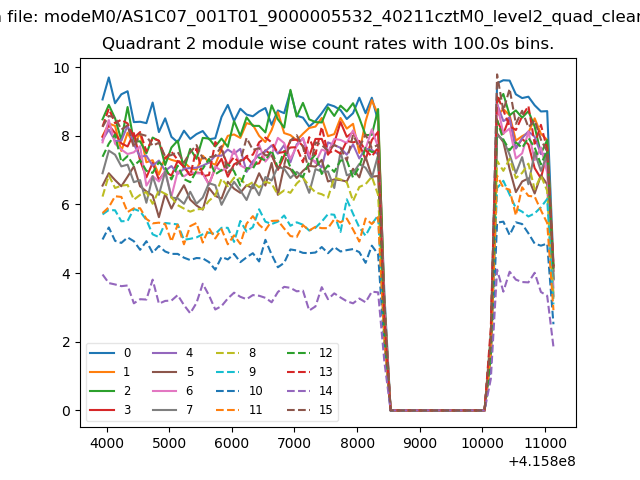
| Module-wise count rates for Quadrant B Data is divided into 100 sec bins |
 |
 |
| Module-wise count rates for Quadrant C Data is divided into 100 sec bins |
 |
 |
| Module-wise count rates for Quadrant D Data is divided into 100 sec bins |
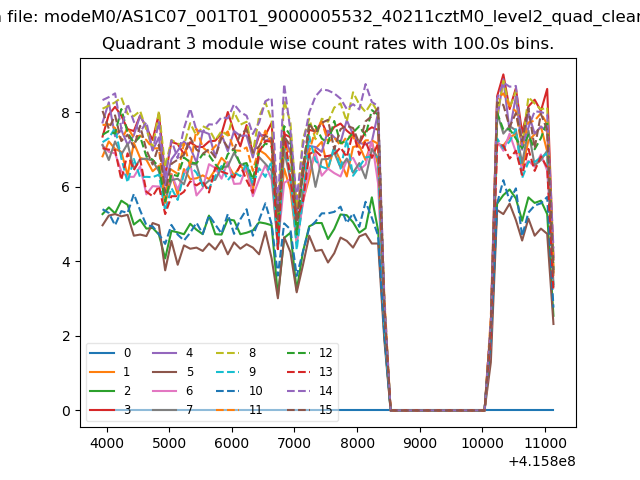 |
 |
| Parameter | Plot |
|---|---|
| CZT HV Monitor | 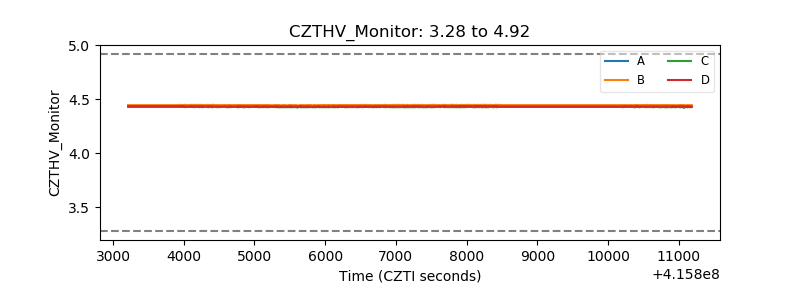 |
| D_VDD | 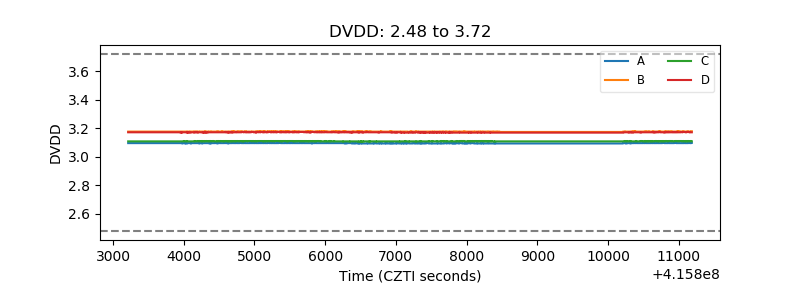 |
| Temperature 1 | 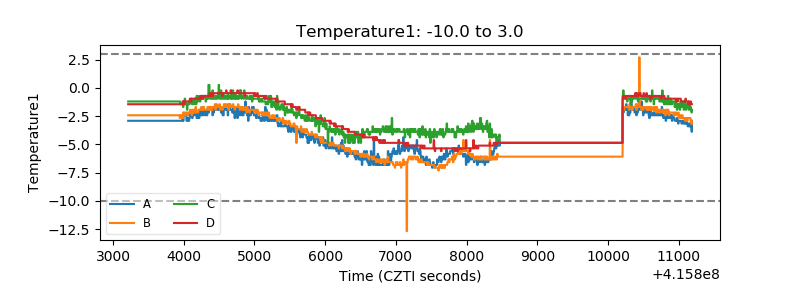 |
| Veto HV Monitor | 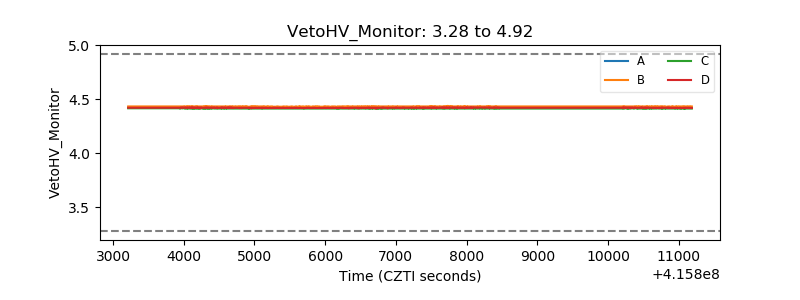 |
| Veto LLD | 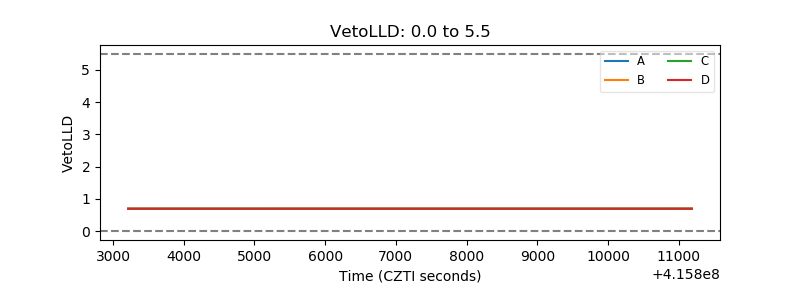 |
| Alpha Counter | 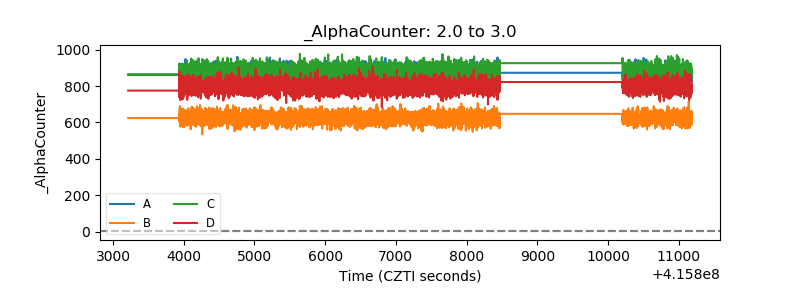 |
| _CPM_Rate | 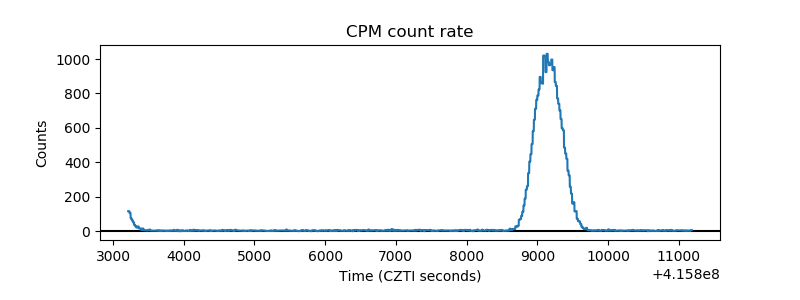 |
| CZT Counter | 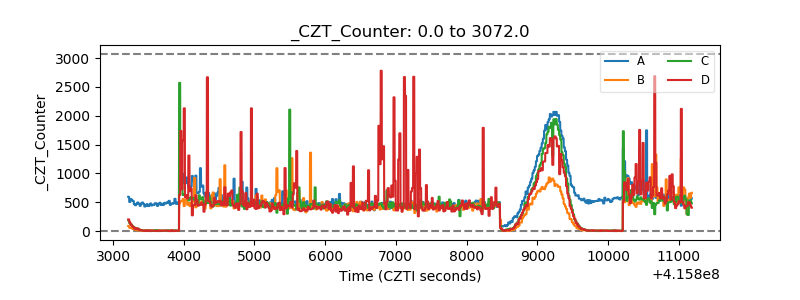 |
| +2.5 Volts monitor | 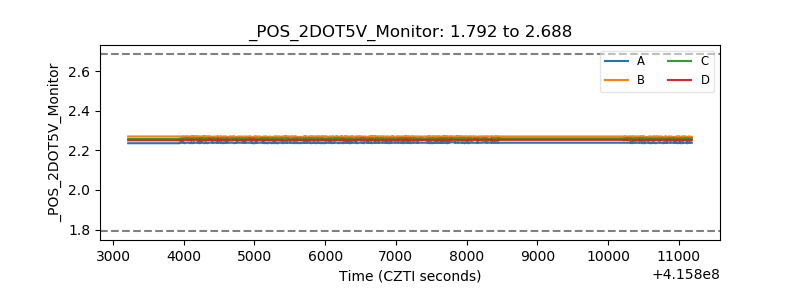 |
| +5 Volts monitor | 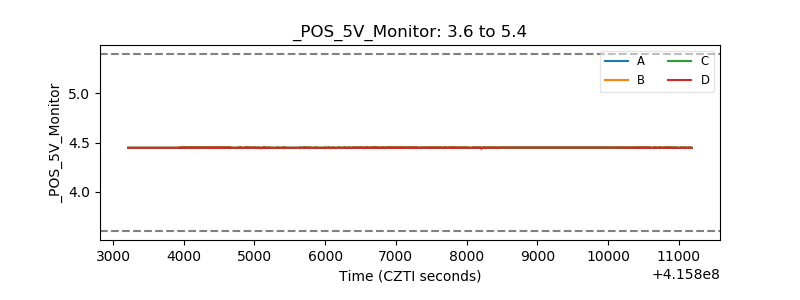 |
| _ROLL_ROT | 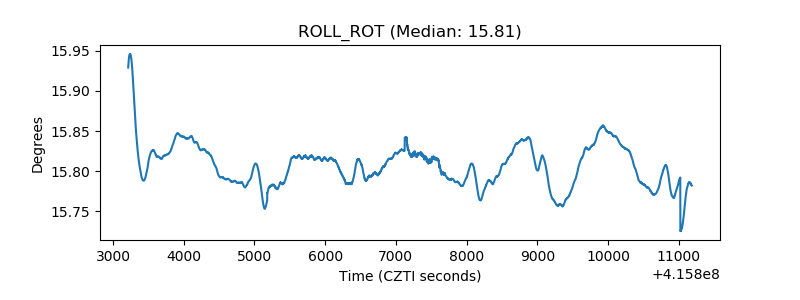 |
| _Roll_DEC | 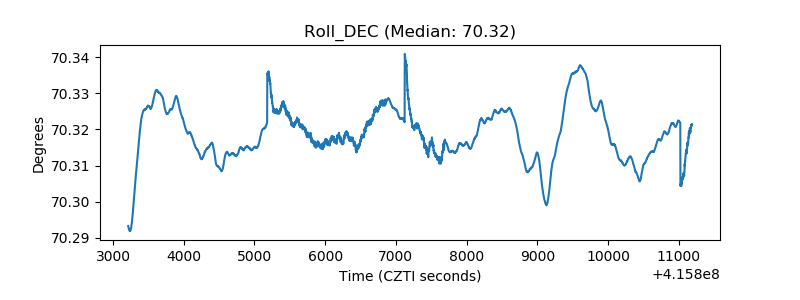 |
| _Roll_RA | 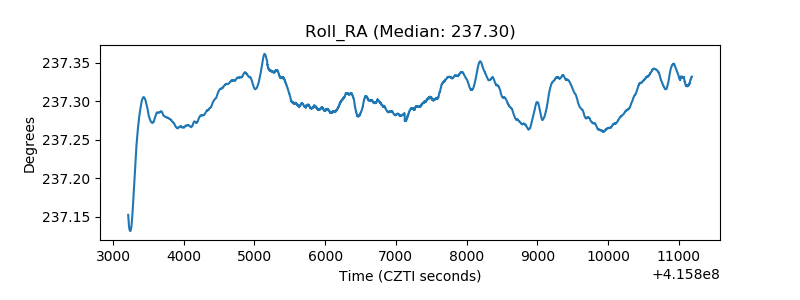 |
| Veto Counter |  |