| Param | Original file | Final file |
|---|---|---|
| Filename | modeM0/AS1C07_001T01_9000005532_40212cztM0_level2.fits | modeM0/AS1C07_001T01_9000005532_40212cztM0_level2_quad_clean.evt |
| Size (bytes) | 319,343,040 | 91,054,080 |
| Size | 304.5 MB | 86.8 MB |
| Events in quadrant A | 2,898,028 | 612,913 |
| Events in quadrant B | 2,687,571 | 630,505 |
| Events in quadrant C | 2,636,782 | 602,393 |
| Events in quadrant D | 3,191,336 | 545,004 |
| Mode M0 | |||
|---|---|---|---|
| Quadrant | BADHDUFLAG | Total packets | Discarded packets |
| A | 0 | 11974 | 3 |
| B | 0 | 11543 | 2 |
| C | 0 | 11047 | 2 |
| D | 0 | 13286 | 2 |
| Mode M9 | |||
|---|---|---|---|
| Quadrant | BADHDUFLAG | Total packets | Discarded packets |
| A | 0 | 19 | 0 |
| B | 0 | 19 | 0 |
| C | 0 | 19 | 0 |
| D | 0 | 20 | 0 |
| Mode SS | |||
|---|---|---|---|
| Quadrant | BADHDUFLAG | Total packets | Discarded packets |
| A | 0 | 108 | 0 |
| B | 0 | 108 | 0 |
| C | 0 | 108 | 0 |
| D | 0 | 108 | 0 |
| Quadrant | Total seconds | Saturated seconds | Saturation percentage |
|---|---|---|---|
| A | 5227 | 19 | 0.363497% |
| B | 5227 | 44 | 0.841783% |
| C | 5227 | 16 | 0.306103% |
| D | 5227 | 157 | 3.003635% |
Noise dominated data is calculated using 1-second bins in cleaned event files. If a bin has >2000 counts, and if more than 50% of those come from <1% of pixels, then it is considered to be noise-dominated and hence unusable.
| Quadrant | # 1 sec bins | Bins with >0 counts | Bins with >2000 counts | High rate bins dominated by noise | Noise dominated (total time) | Noise dominated (detector-on time) | Marked lightcurve |
|---|---|---|---|---|---|---|---|
| A | 7111 | 5228 | 10 | 10 | 0.14% | 0.19% | 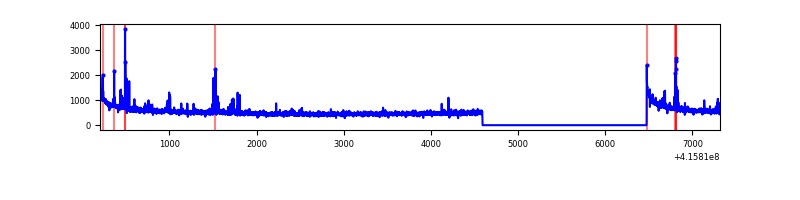 |
| B | 7111 | 5228 | 28 | 28 | 0.39% | 0.54% | 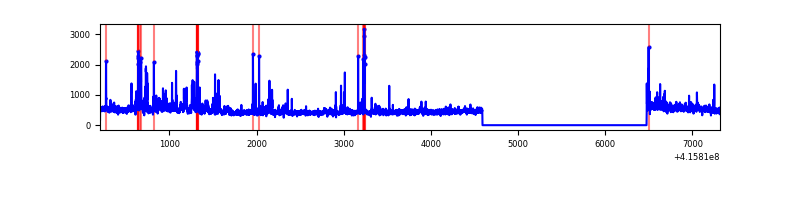 |
| C | 7111 | 5228 | 10 | 10 | 0.14% | 0.19% | 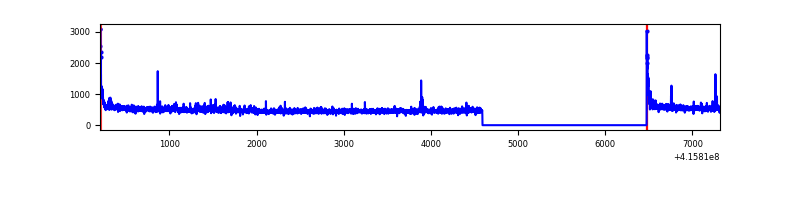 |
| D | 7111 | 5228 | 125 | 125 | 1.76% | 2.39% | 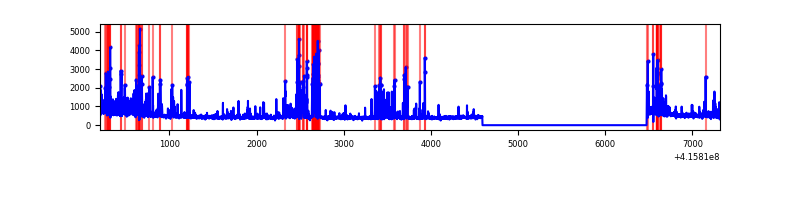 |
Top three noisy pixels from each quadrant. If the there are fewer than three noisy pixels in the level2.evt file, extra rows are filled as -1
| Pixel properties | Quadrant properties | ||||||
|---|---|---|---|---|---|---|---|
| Quadrant | DetID | PixID | Counts | Sigma | Mean | Median | Sigma |
| A | 10 | 83 | 492698 | 4146.55 | 585 | 573 | 118.7 |
| A | 13 | 248 | 115512 | 968.45 | 585 | 573 | 118.7 |
| A | 2 | 79 | 8133 | 63.7 | 585 | 573 | 118.7 |
| B | 5 | 255 | 150919 | 1341.27 | 586 | 570 | 112.1 |
| B | 0 | 245 | 108442 | 962.33 | 586 | 570 | 112.1 |
| B | 15 | 85 | 43257 | 380.81 | 586 | 570 | 112.1 |
| C | 15 | 214 | 223971 | 1684.99 | 579 | 584 | 132.6 |
| C | 9 | 187 | 79593 | 595.96 | 579 | 584 | 132.6 |
| C | 0 | 10 | 56551 | 422.16 | 579 | 584 | 132.6 |
| D | 12 | 227 | 298481 | 2140.52 | 570 | 554 | 139.2 |
| D | 13 | 249 | 244758 | 1754.53 | 570 | 554 | 139.2 |
| D | 12 | 218 | 239164 | 1714.34 | 570 | 554 | 139.2 |
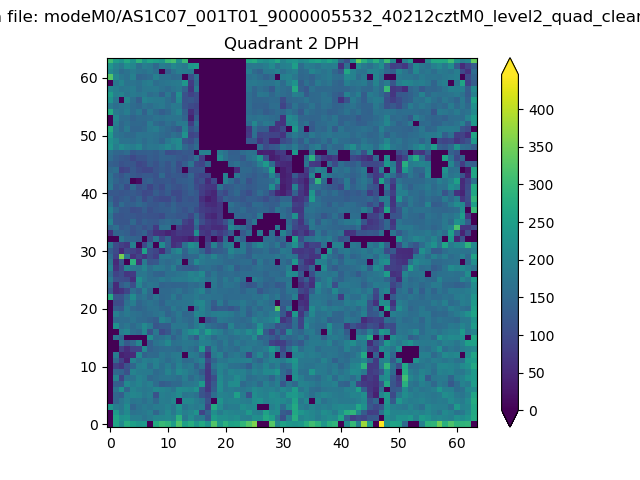
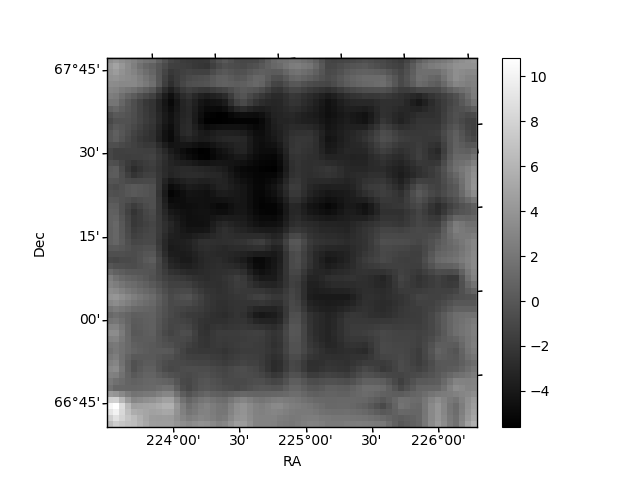
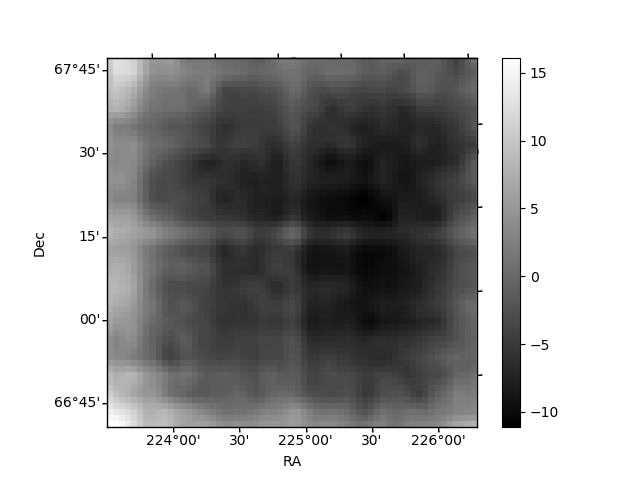
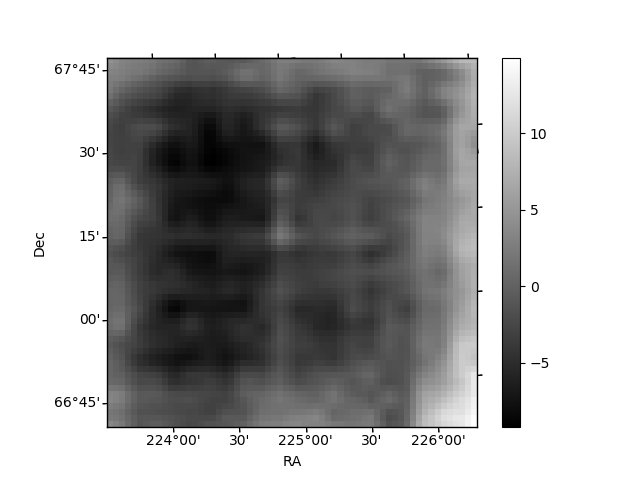
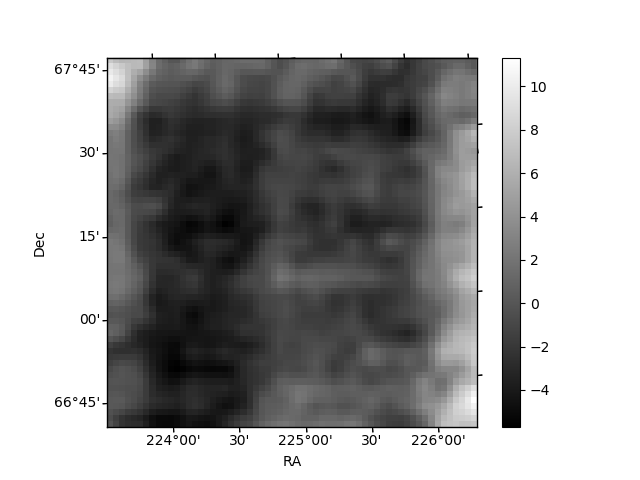
Histogram calculated using DETX and DETY for each event in the final _common_clean file
| Quadrant A | 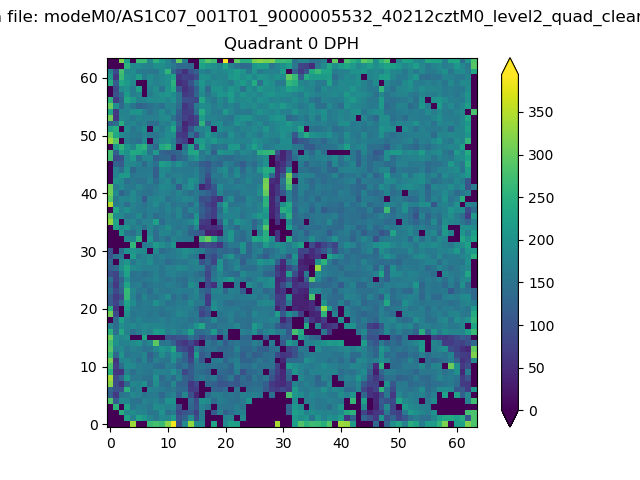 |
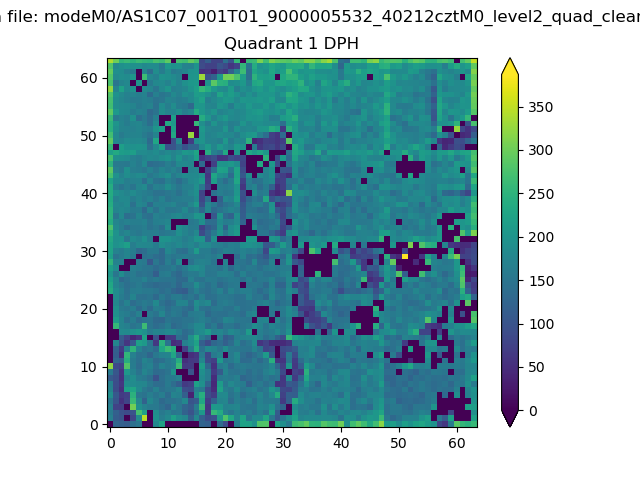 |
Quadrant B |
|---|---|---|---|
| Quadrant D | 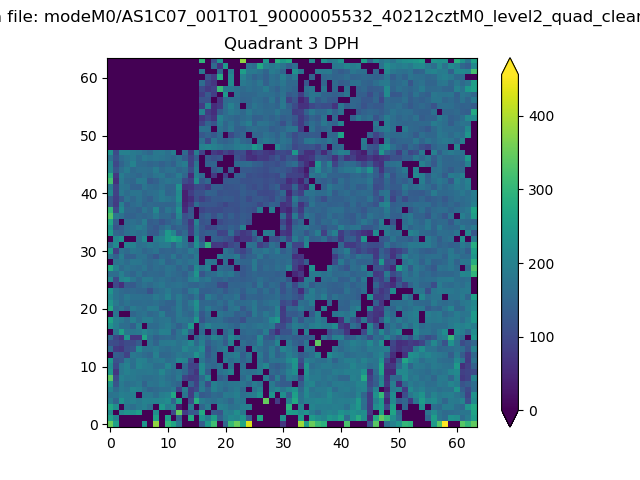 |
 |
Quadrant C |
| Plot type | Count rate plots | Images |
|---|---|---|
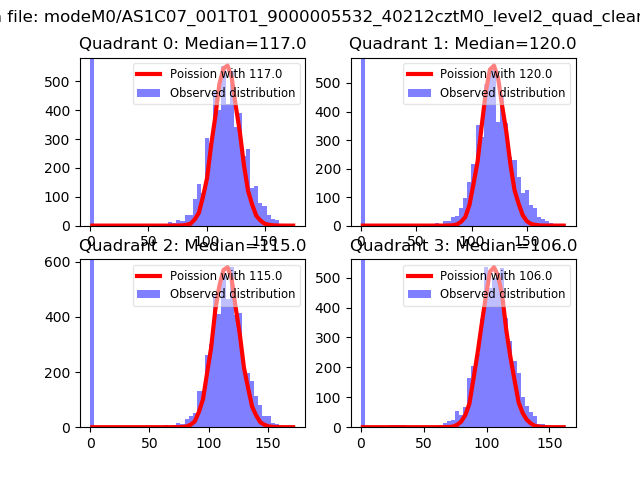
| Comparison with Poisson distribution Blue bars denote a histogram of data divided into 1 sec bins. Red curve is a Poisson curve with rate = median count rate of data. |
 |
 |
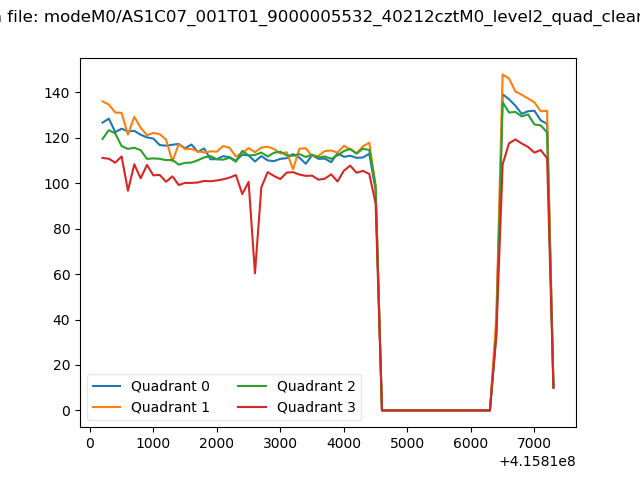
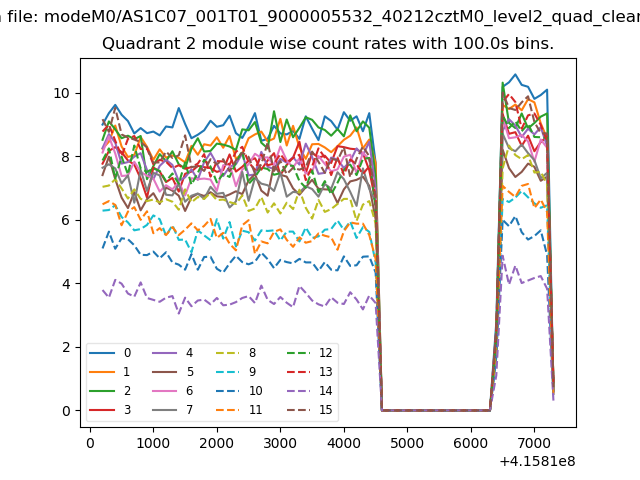
| Quadrant-wise count rates Data is divided into 100 sec bins |
 |
|
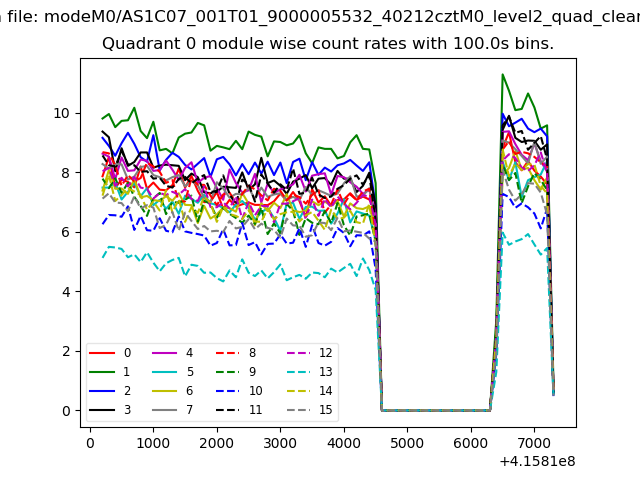
| Module-wise count rates for Quadrant A Data is divided into 100 sec bins |
 |
 |
| Module-wise count rates for Quadrant B Data is divided into 100 sec bins |
 |
 |
| Module-wise count rates for Quadrant C Data is divided into 100 sec bins |
 |
 |
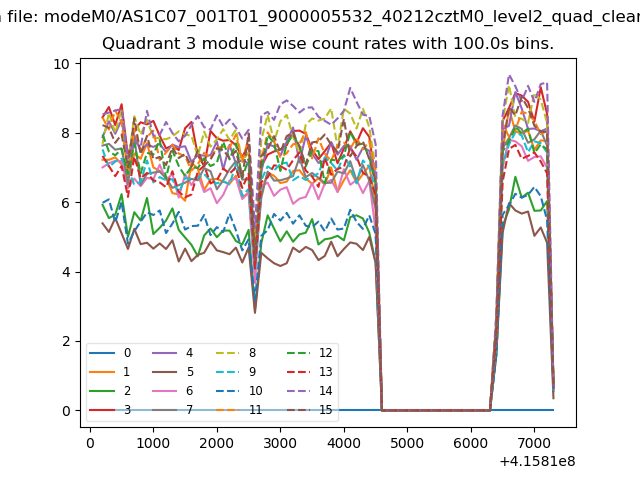
| Module-wise count rates for Quadrant D Data is divided into 100 sec bins |
 |
 |
| Parameter | Plot |
|---|---|
| CZT HV Monitor | 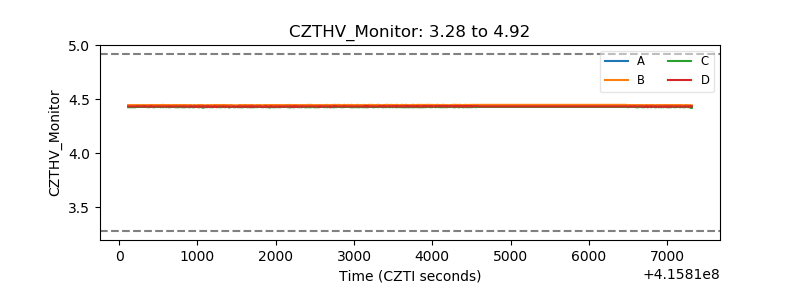 |
| D_VDD | 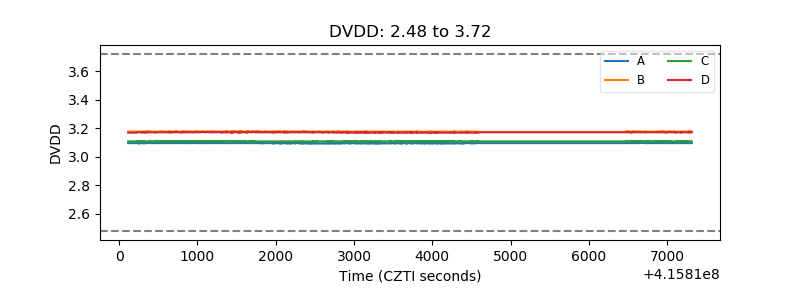 |
| Temperature 1 | 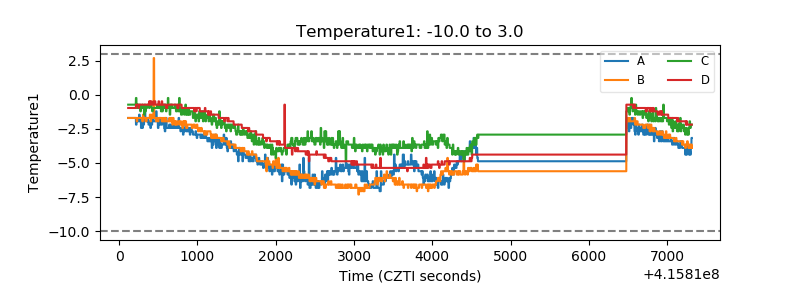 |
| Veto HV Monitor | 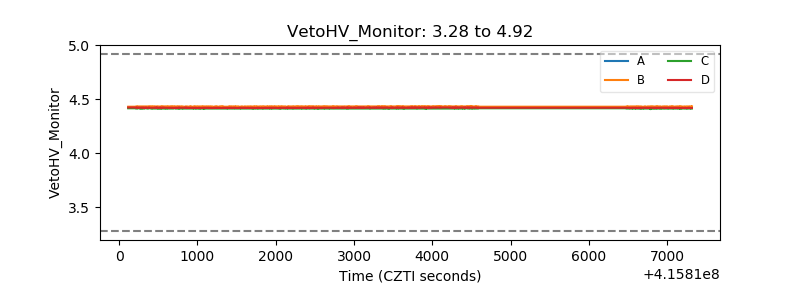 |
| Veto LLD | 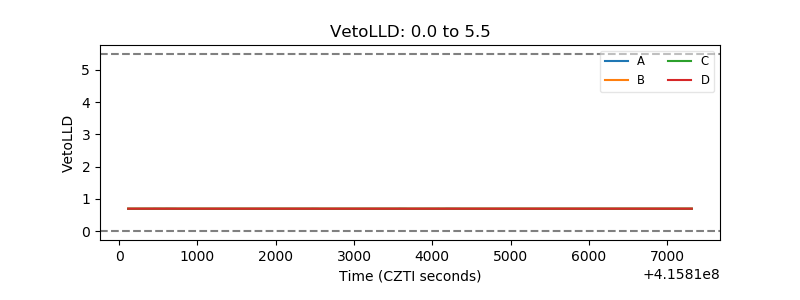 |
| Alpha Counter | 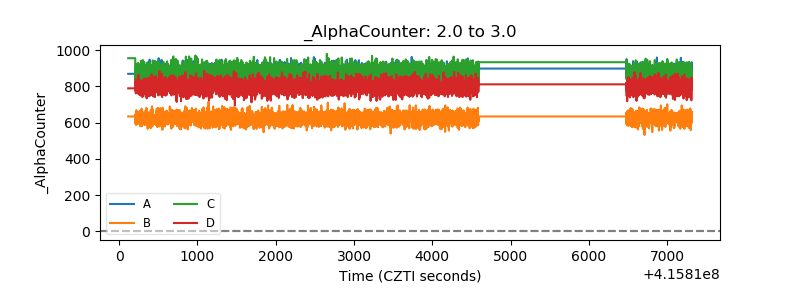 |
| _CPM_Rate | 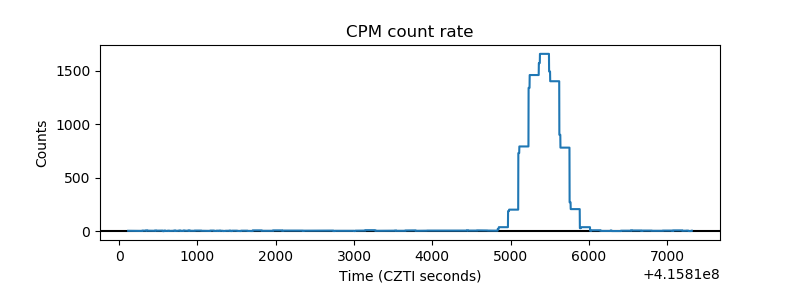 |
| CZT Counter | 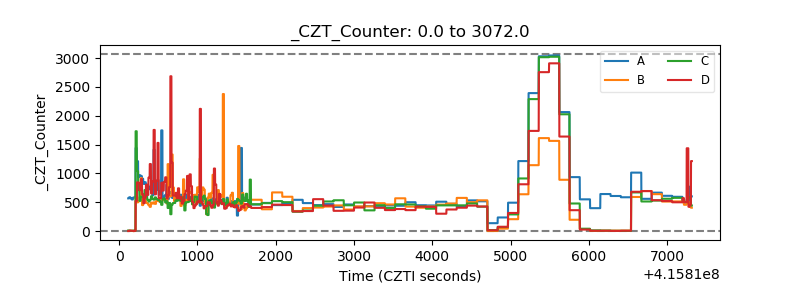 |
| +2.5 Volts monitor |  |
| +5 Volts monitor | 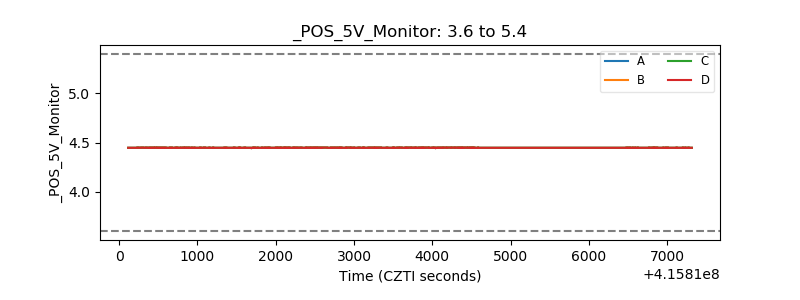 |
| _ROLL_ROT | 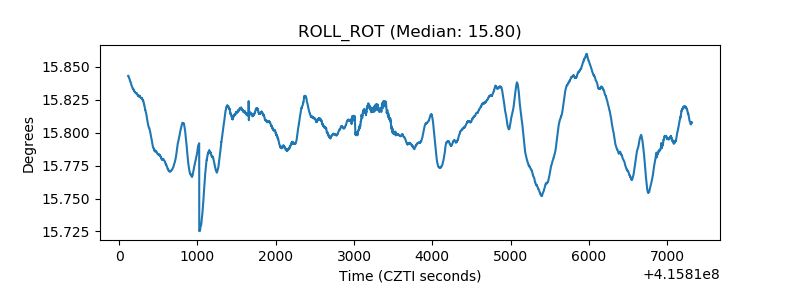 |
| _Roll_DEC | 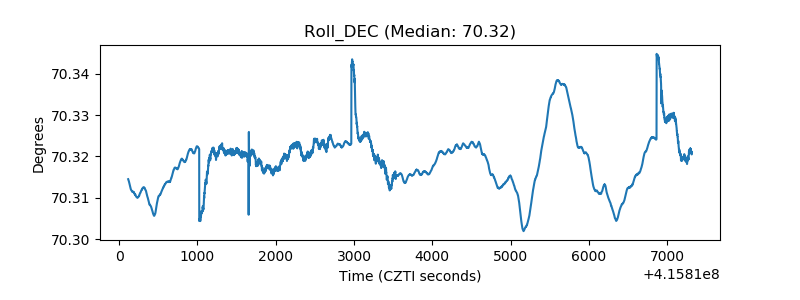 |
| _Roll_RA | 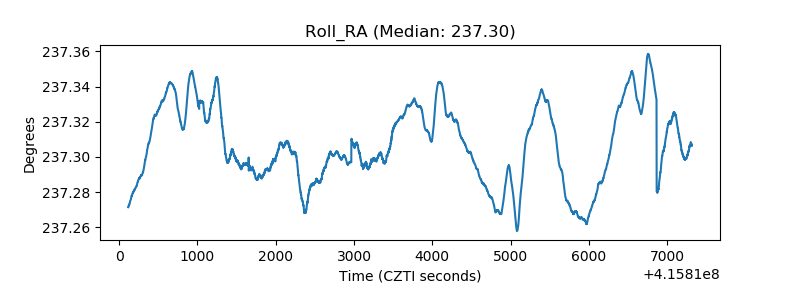 |
| Veto Counter | 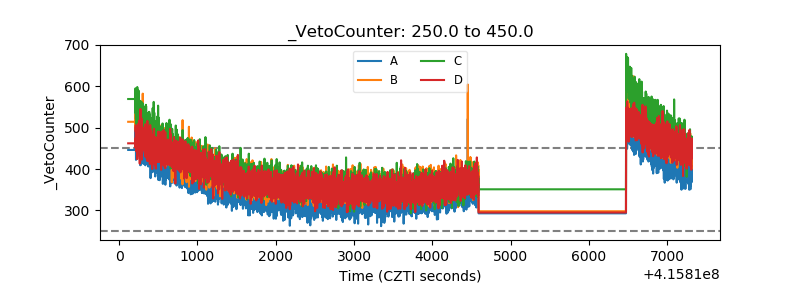 |