| Param | Original file | Final file |
|---|---|---|
| Filename | modeM0/AS1C07_001T01_9000005532_40213cztM0_level2.fits | modeM0/AS1C07_001T01_9000005532_40213cztM0_level2_quad_clean.evt |
| Size (bytes) | 297,362,880 | 89,899,200 |
| Size | 283.6 MB | 85.7 MB |
| Events in quadrant A | 2,732,457 | 602,068 |
| Events in quadrant B | 2,400,031 | 625,934 |
| Events in quadrant C | 2,534,475 | 603,380 |
| Events in quadrant D | 2,954,545 | 543,984 |
| Mode M0 | |||
|---|---|---|---|
| Quadrant | BADHDUFLAG | Total packets | Discarded packets |
| A | 0 | 11310 | 3 |
| B | 0 | 10535 | 2 |
| C | 0 | 10583 | 2 |
| D | 0 | 12311 | 2 |
| Mode M9 | |||
|---|---|---|---|
| Quadrant | BADHDUFLAG | Total packets | Discarded packets |
| A | 0 | 26 | 0 |
| B | 0 | 26 | 0 |
| C | 0 | 26 | 0 |
| D | 0 | 27 | 0 |
| Mode SS | |||
|---|---|---|---|
| Quadrant | BADHDUFLAG | Total packets | Discarded packets |
| A | 0 | 100 | 0 |
| B | 0 | 100 | 0 |
| C | 0 | 100 | 0 |
| D | 0 | 100 | 0 |
| Quadrant | Total seconds | Saturated seconds | Saturation percentage |
|---|---|---|---|
| A | 4950 | 18 | 0.363636% |
| B | 4950 | 9 | 0.181818% |
| C | 4950 | 21 | 0.424242% |
| D | 4950 | 114 | 2.303030% |
Noise dominated data is calculated using 1-second bins in cleaned event files. If a bin has >2000 counts, and if more than 50% of those come from <1% of pixels, then it is considered to be noise-dominated and hence unusable.
| Quadrant | # 1 sec bins | Bins with >0 counts | Bins with >2000 counts | High rate bins dominated by noise | Noise dominated (total time) | Noise dominated (detector-on time) | Marked lightcurve |
|---|---|---|---|---|---|---|---|
| A | 6923 | 4951 | 10 | 10 | 0.14% | 0.20% | 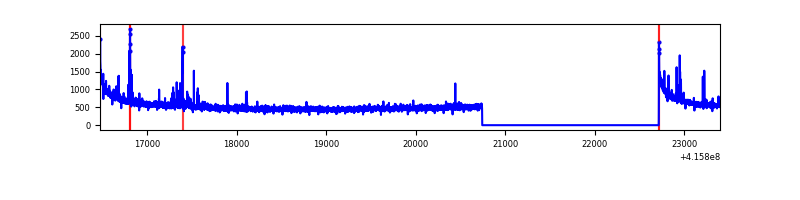 |
| B | 6923 | 4951 | 2 | 2 | 0.03% | 0.04% | 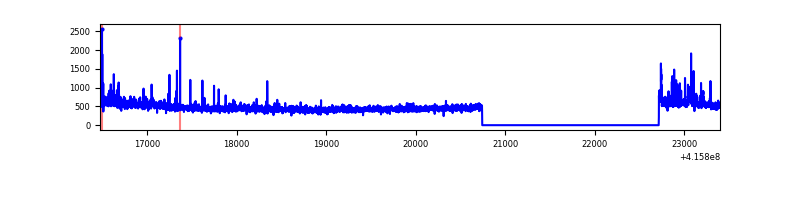 |
| C | 6923 | 4951 | 11 | 11 | 0.16% | 0.22% | 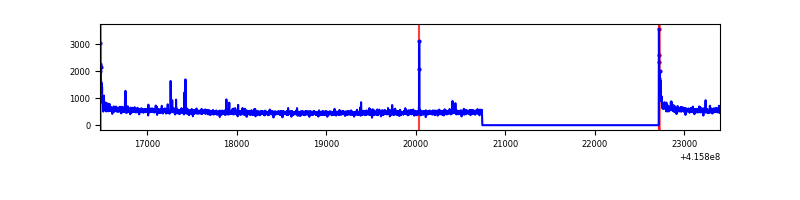 |
| D | 6923 | 4951 | 97 | 97 | 1.40% | 1.96% | 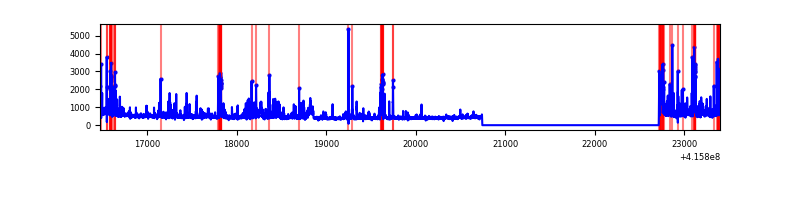 |
Top three noisy pixels from each quadrant. If the there are fewer than three noisy pixels in the level2.evt file, extra rows are filled as -1
| Pixel properties | Quadrant properties | ||||||
|---|---|---|---|---|---|---|---|
| Quadrant | DetID | PixID | Counts | Sigma | Mean | Median | Sigma |
| A | 10 | 83 | 465529 | 4100.86 | 560 | 549 | 113.4 |
| A | 13 | 248 | 87428 | 766.22 | 560 | 549 | 113.4 |
| A | 13 | 254 | 6788 | 55.02 | 560 | 549 | 113.4 |
| B | 0 | 229 | 51378 | 474.8 | 566 | 551 | 107.0 |
| B | 0 | 245 | 43129 | 397.74 | 566 | 551 | 107.0 |
| B | 4 | 171 | 29149 | 267.15 | 566 | 551 | 107.0 |
| C | 15 | 214 | 212616 | 1639.55 | 560 | 564 | 129.3 |
| C | 0 | 10 | 69869 | 535.86 | 560 | 564 | 129.3 |
| C | 9 | 187 | 30121 | 228.53 | 560 | 564 | 129.3 |
| D | 12 | 227 | 348802 | 2617.93 | 549 | 533 | 133.0 |
| D | 12 | 218 | 207509 | 1555.83 | 549 | 533 | 133.0 |
| D | 13 | 249 | 117369 | 878.25 | 549 | 533 | 133.0 |
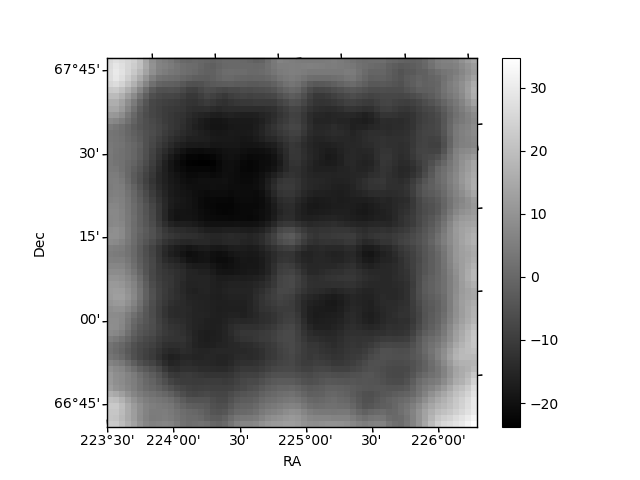
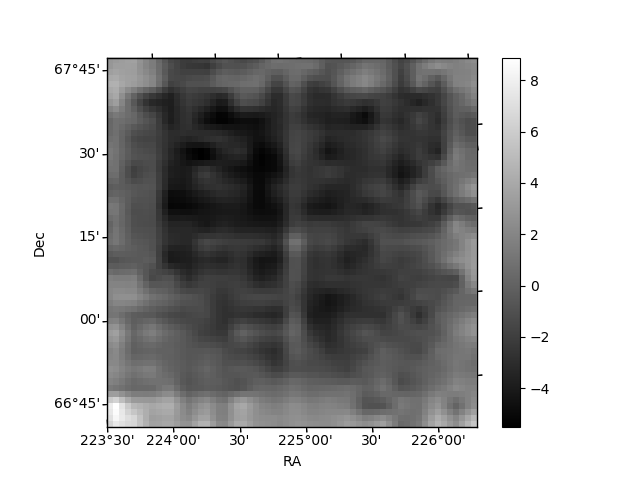
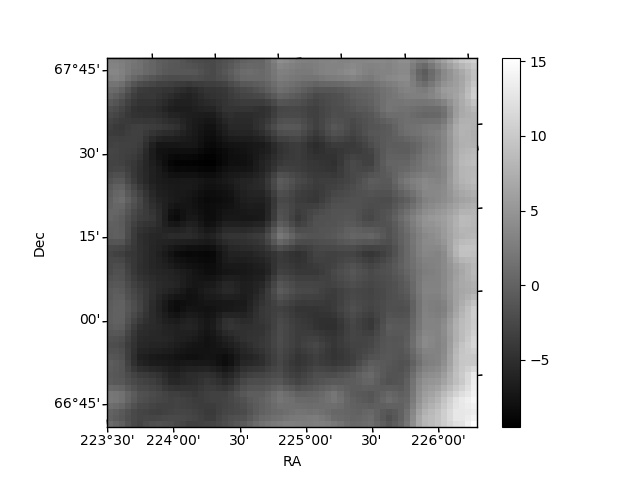
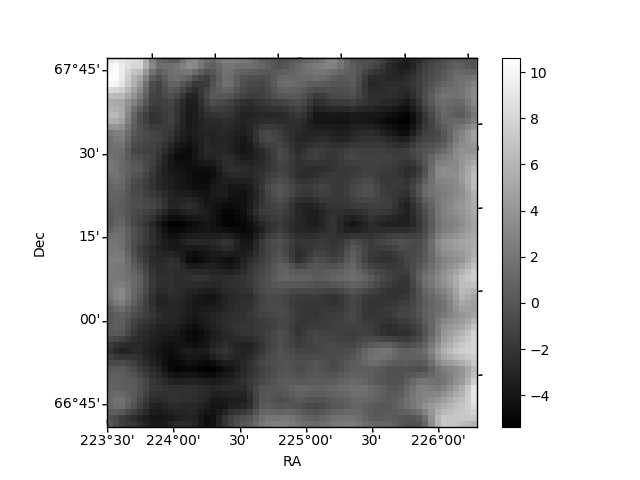
Histogram calculated using DETX and DETY for each event in the final _common_clean file
| Quadrant A | 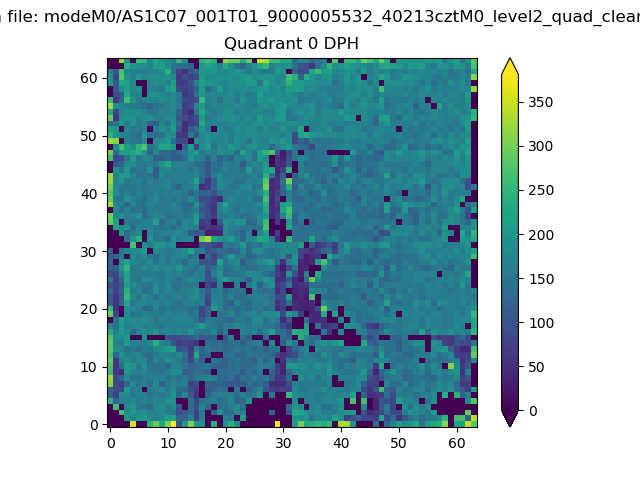 |
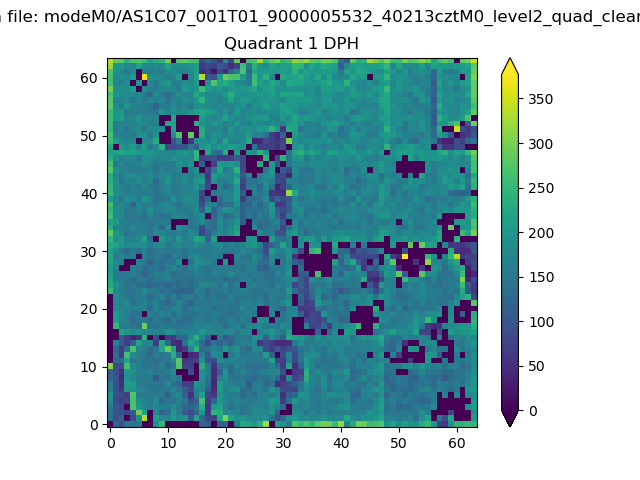 |
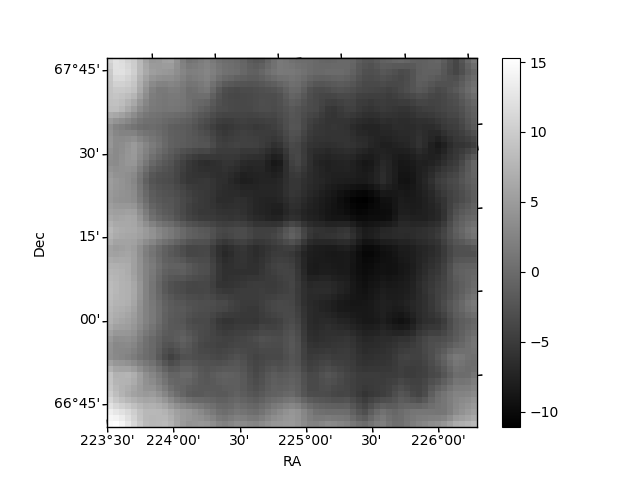
Quadrant B |
|---|---|---|---|
| Quadrant D | 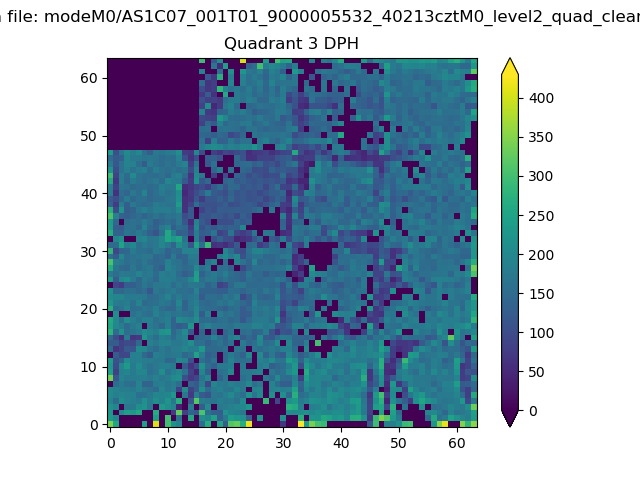 |
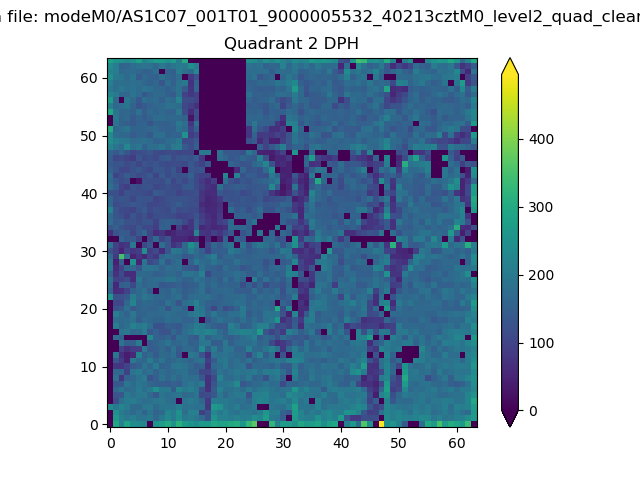 |
Quadrant C |
| Plot type | Count rate plots | Images |
|---|---|---|
| Comparison with Poisson distribution Blue bars denote a histogram of data divided into 1 sec bins. Red curve is a Poisson curve with rate = median count rate of data. |
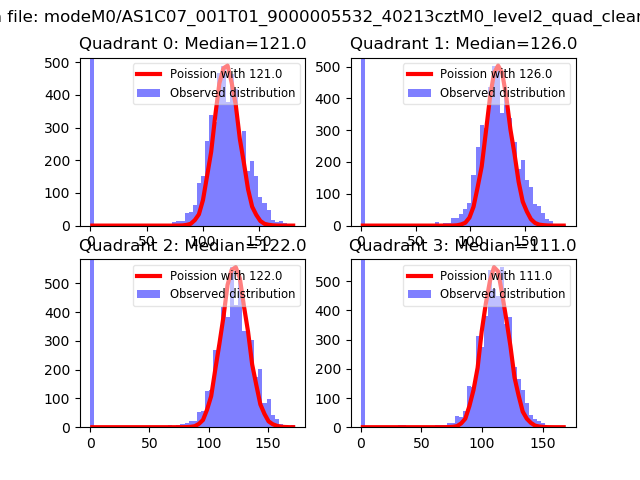 |
 |
| Quadrant-wise count rates Data is divided into 100 sec bins |
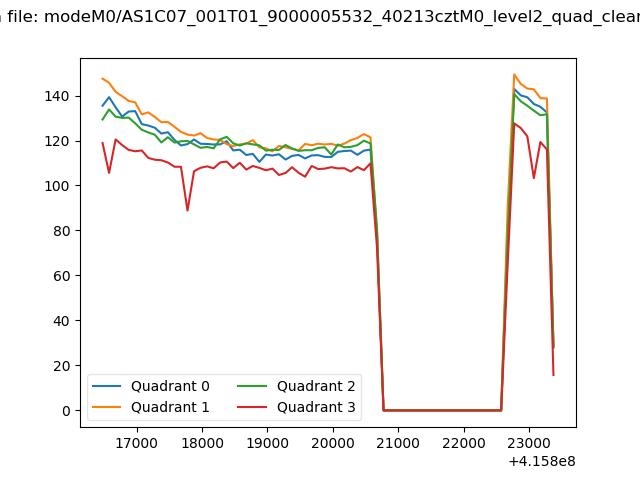 |
|
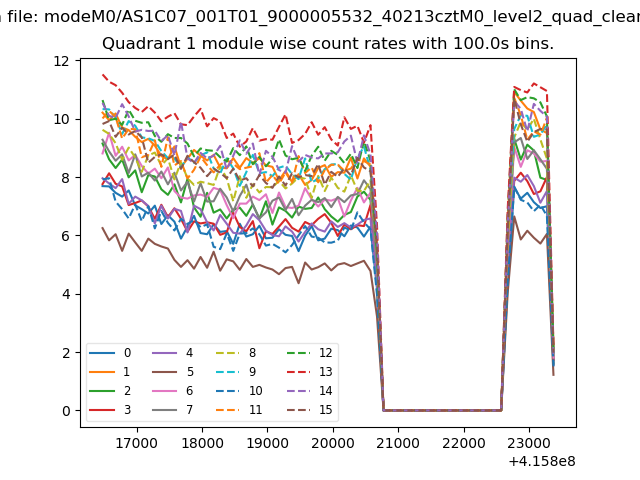
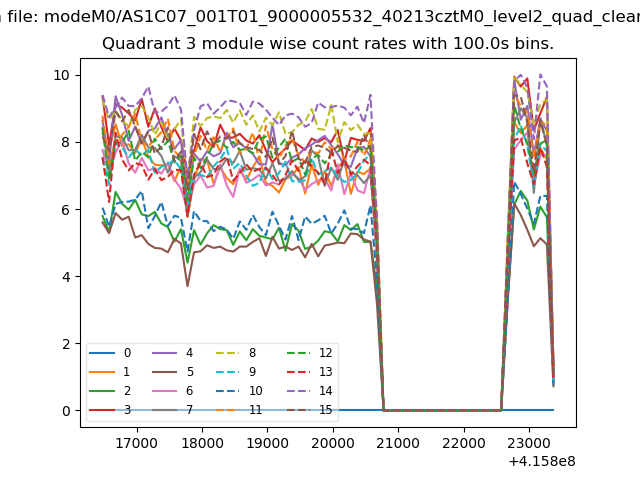
| Module-wise count rates for Quadrant A Data is divided into 100 sec bins |
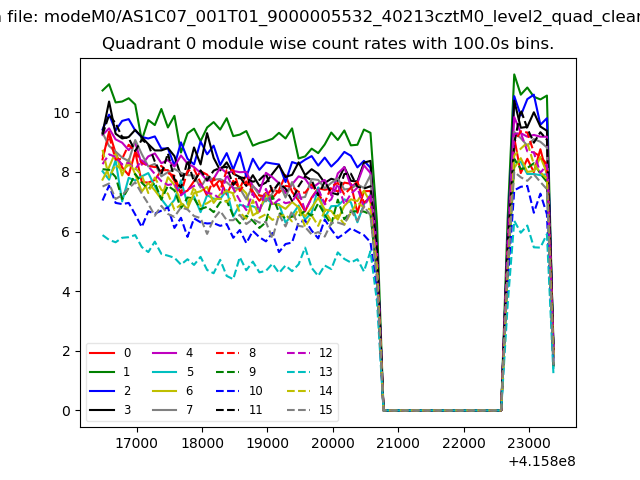 |
 |
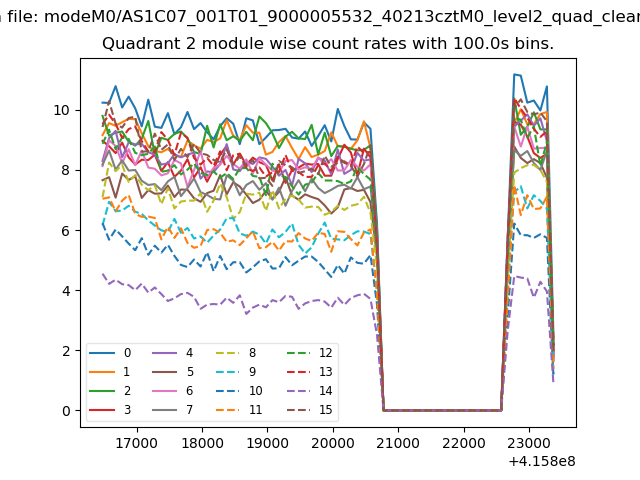
| Module-wise count rates for Quadrant B Data is divided into 100 sec bins |
 |
 |
| Module-wise count rates for Quadrant C Data is divided into 100 sec bins |
 |
 |
| Module-wise count rates for Quadrant D Data is divided into 100 sec bins |
 |
 |
| Parameter | Plot |
|---|---|
| CZT HV Monitor | 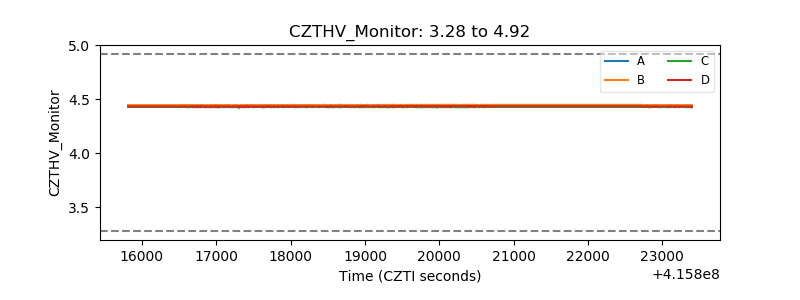 |
| D_VDD | 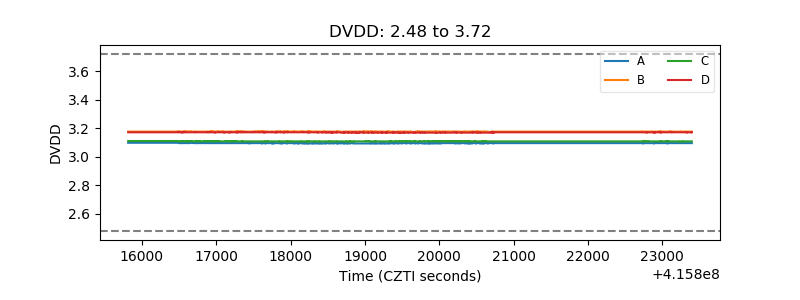 |
| Temperature 1 | 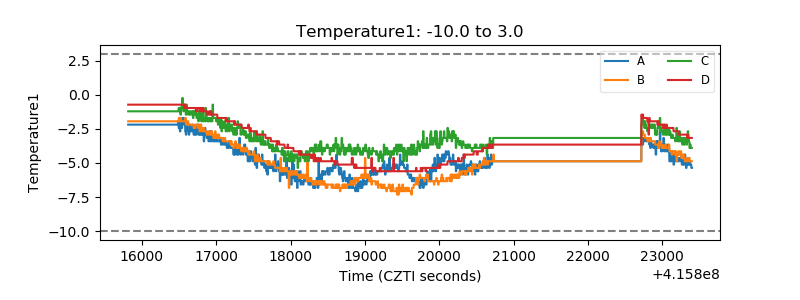 |
| Veto HV Monitor | 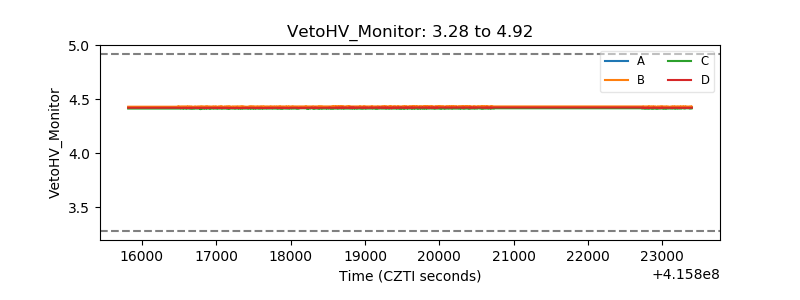 |
| Veto LLD | 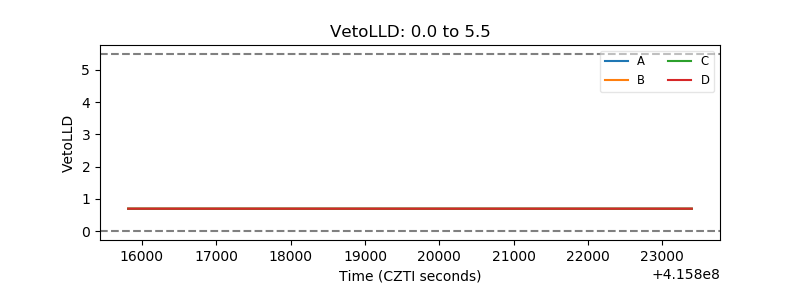 |
| Alpha Counter | 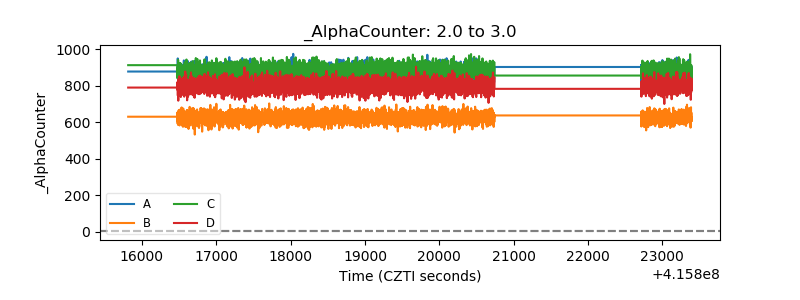 |
| _CPM_Rate | 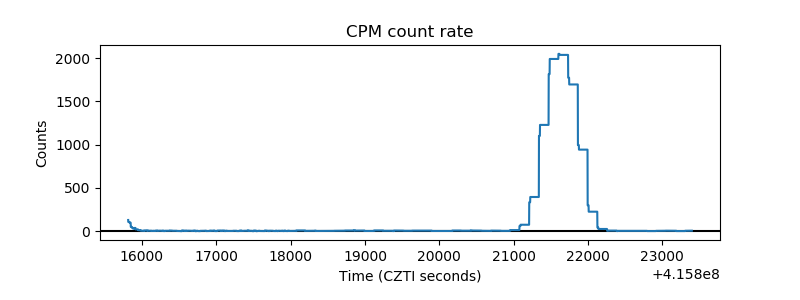 |
| CZT Counter | 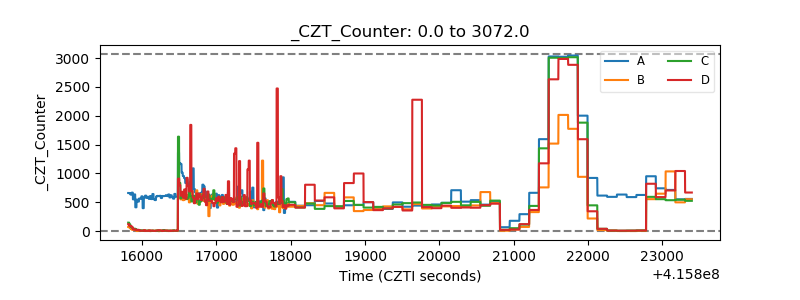 |
| +2.5 Volts monitor | 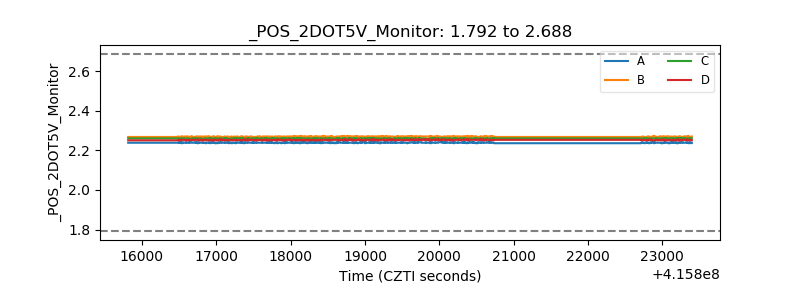 |
| +5 Volts monitor | 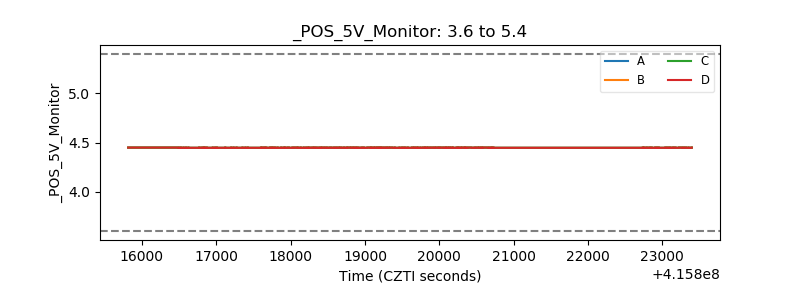 |
| _ROLL_ROT |  |
| _Roll_DEC | 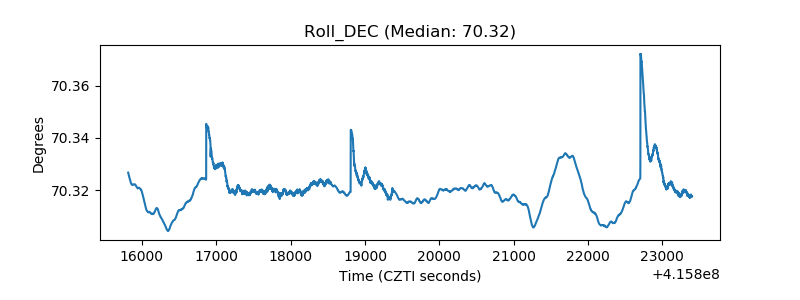 |
| _Roll_RA | 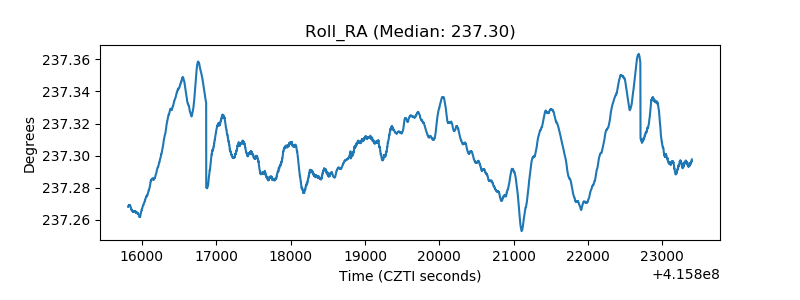 |
| Veto Counter | 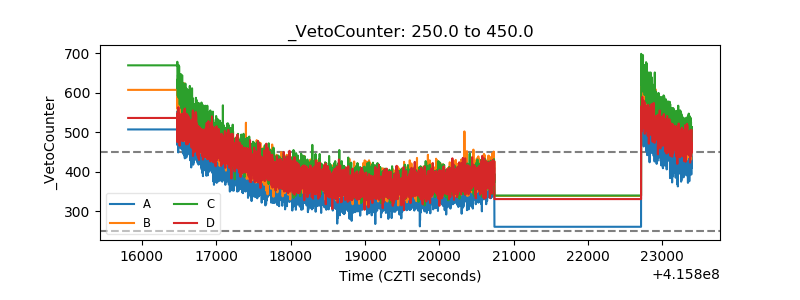 |