| Param | Original file | Final file |
|---|---|---|
| Filename | modeM0/AS1C07_001T01_9000005532_40214cztM0_level2.fits | modeM0/AS1C07_001T01_9000005532_40214cztM0_level2_quad_clean.evt |
| Size (bytes) | 292,760,640 | 89,256,960 |
| Size | 279.2 MB | 85.1 MB |
| Events in quadrant A | 2,668,440 | 594,120 |
| Events in quadrant B | 2,431,623 | 620,834 |
| Events in quadrant C | 2,563,553 | 602,594 |
| Events in quadrant D | 2,794,803 | 544,616 |
| Mode M0 | |||
|---|---|---|---|
| Quadrant | BADHDUFLAG | Total packets | Discarded packets |
| A | 0 | 11078 | 3 |
| B | 0 | 10491 | 2 |
| C | 0 | 10566 | 2 |
| D | 0 | 11759 | 2 |
| Mode M9 | |||
|---|---|---|---|
| Quadrant | BADHDUFLAG | Total packets | Discarded packets |
| A | 0 | 31 | 0 |
| B | 0 | 31 | 0 |
| C | 0 | 31 | 0 |
| D | 0 | 32 | 0 |
| Mode SS | |||
|---|---|---|---|
| Quadrant | BADHDUFLAG | Total packets | Discarded packets |
| A | 0 | 100 | 0 |
| B | 0 | 100 | 0 |
| C | 0 | 100 | 0 |
| D | 0 | 100 | 0 |
| Quadrant | Total seconds | Saturated seconds | Saturation percentage |
|---|---|---|---|
| A | 4854 | 29 | 0.597445% |
| B | 4854 | 15 | 0.309023% |
| C | 4854 | 31 | 0.638649% |
| D | 4854 | 86 | 1.771735% |
Noise dominated data is calculated using 1-second bins in cleaned event files. If a bin has >2000 counts, and if more than 50% of those come from <1% of pixels, then it is considered to be noise-dominated and hence unusable.
| Quadrant | # 1 sec bins | Bins with >0 counts | Bins with >2000 counts | High rate bins dominated by noise | Noise dominated (total time) | Noise dominated (detector-on time) | Marked lightcurve |
|---|---|---|---|---|---|---|---|
| A | 6916 | 4855 | 17 | 17 | 0.25% | 0.35% | 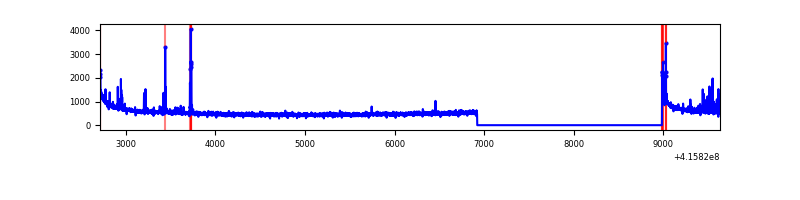 |
| B | 6916 | 4855 | 6 | 6 | 0.09% | 0.12% | 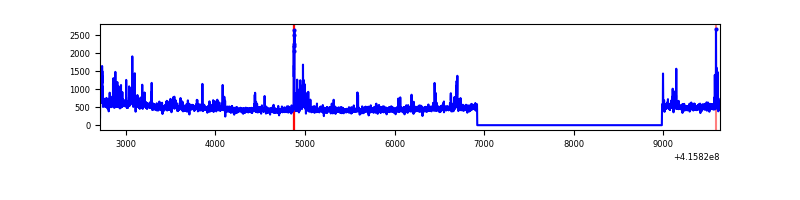 |
| C | 6916 | 4855 | 19 | 19 | 0.27% | 0.39% | 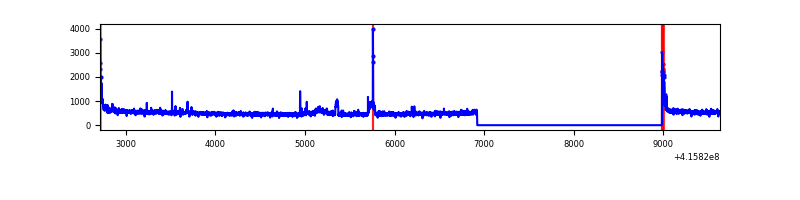 |
| D | 6916 | 4855 | 61 | 61 | 0.88% | 1.26% | 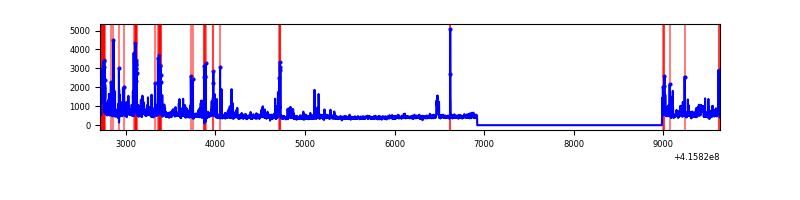 |
Top three noisy pixels from each quadrant. If the there are fewer than three noisy pixels in the level2.evt file, extra rows are filled as -1
| Pixel properties | Quadrant properties | ||||||
|---|---|---|---|---|---|---|---|
| Quadrant | DetID | PixID | Counts | Sigma | Mean | Median | Sigma |
| A | 10 | 83 | 439520 | 3961.91 | 547 | 537 | 110.8 |
| A | 13 | 248 | 110354 | 991.12 | 547 | 537 | 110.8 |
| A | 3 | 137 | 5624 | 45.91 | 547 | 537 | 110.8 |
| B | 0 | 229 | 159078 | 1518.81 | 553 | 539 | 104.4 |
| B | 0 | 245 | 56317 | 534.36 | 553 | 539 | 104.4 |
| B | 5 | 255 | 20332 | 189.62 | 553 | 539 | 104.4 |
| C | 15 | 214 | 209972 | 1649.67 | 549 | 552 | 126.9 |
| C | 12 | 250 | 101467 | 794.94 | 549 | 552 | 126.9 |
| C | 0 | 10 | 82111 | 642.47 | 549 | 552 | 126.9 |
| D | 12 | 227 | 179074 | 1364.41 | 538 | 524 | 130.9 |
| D | 12 | 218 | 168621 | 1284.53 | 538 | 524 | 130.9 |
| D | 12 | 79 | 164380 | 1252.12 | 538 | 524 | 130.9 |
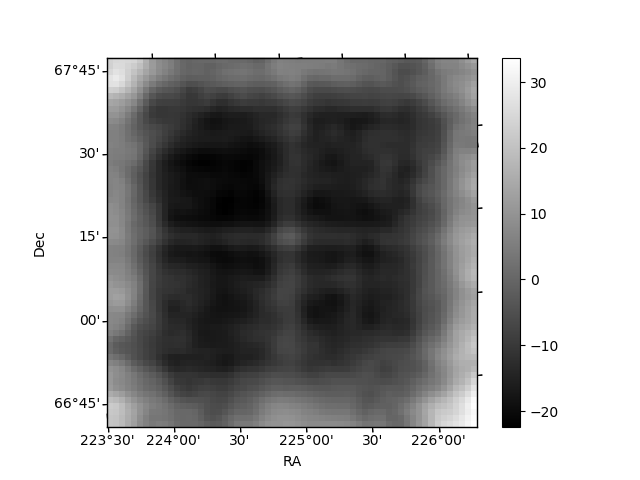
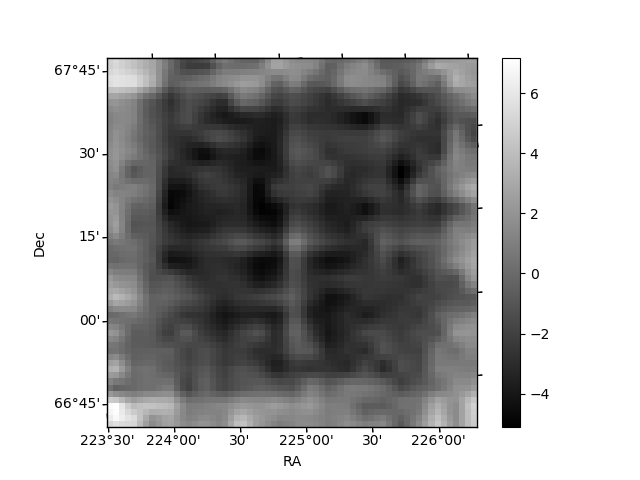
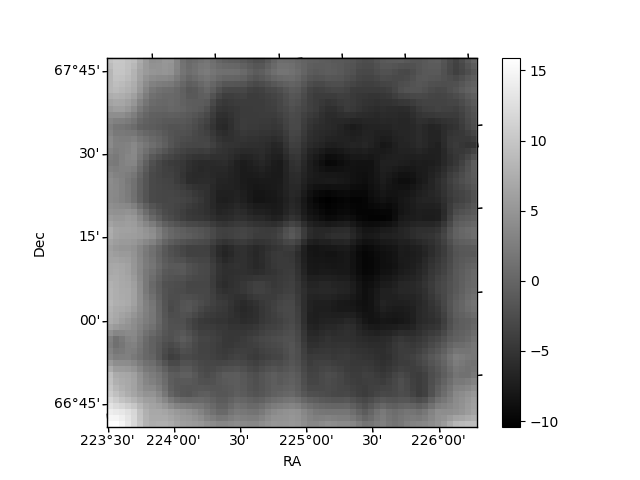
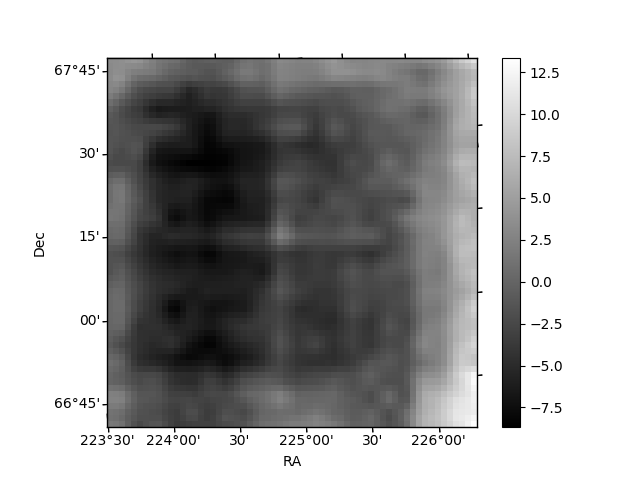
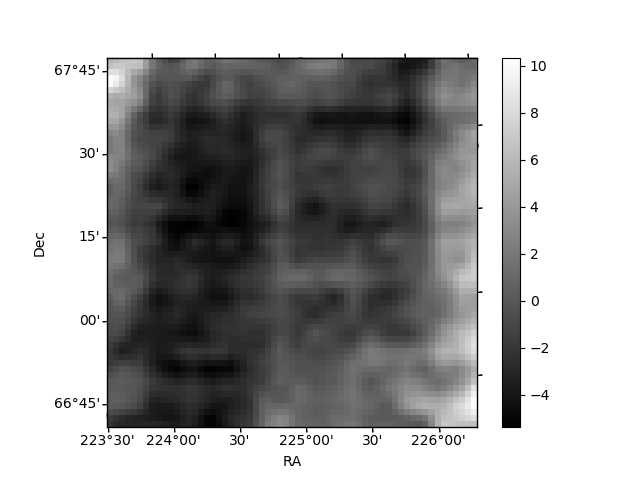
Histogram calculated using DETX and DETY for each event in the final _common_clean file
| Quadrant A | 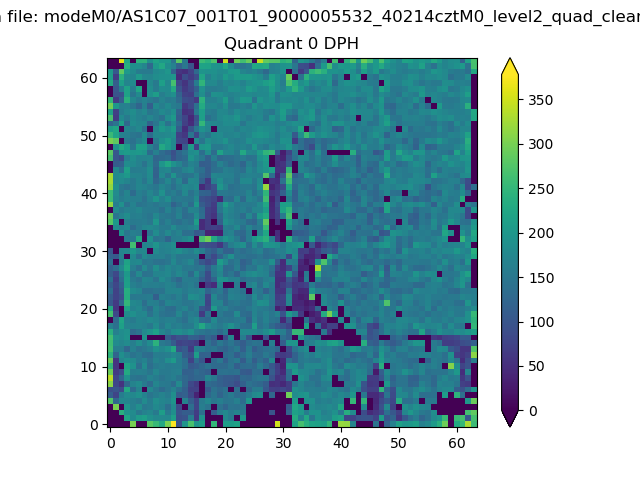 |
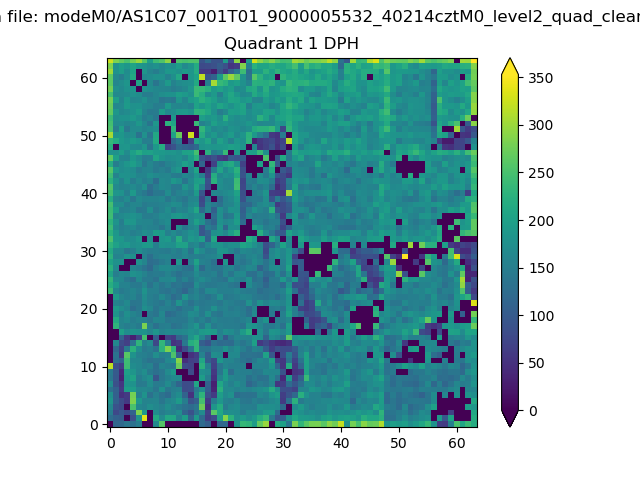 |
Quadrant B |
|---|---|---|---|
| Quadrant D | 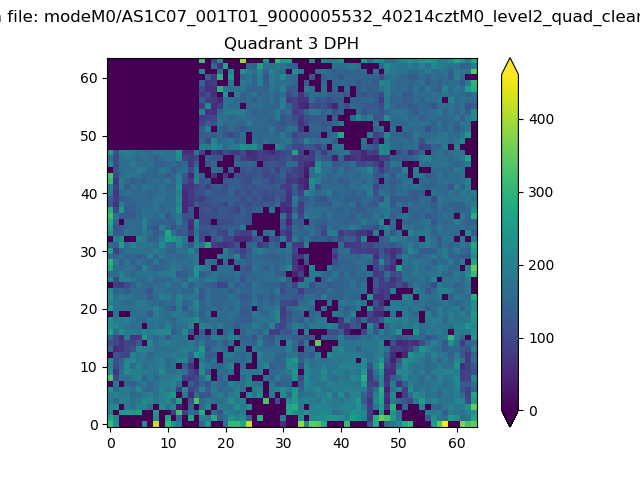 |
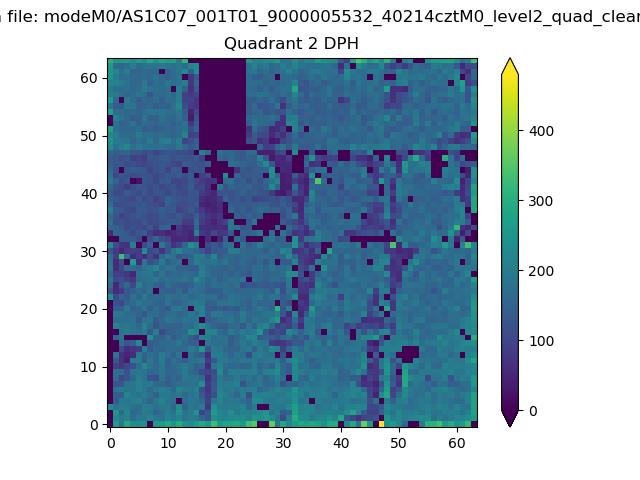 |
Quadrant C |
| Plot type | Count rate plots | Images |
|---|---|---|
| Comparison with Poisson distribution Blue bars denote a histogram of data divided into 1 sec bins. Red curve is a Poisson curve with rate = median count rate of data. |
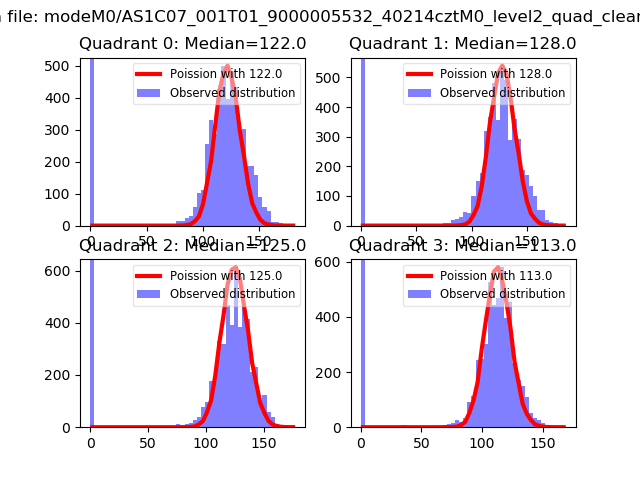 |
 |
| Quadrant-wise count rates Data is divided into 100 sec bins |
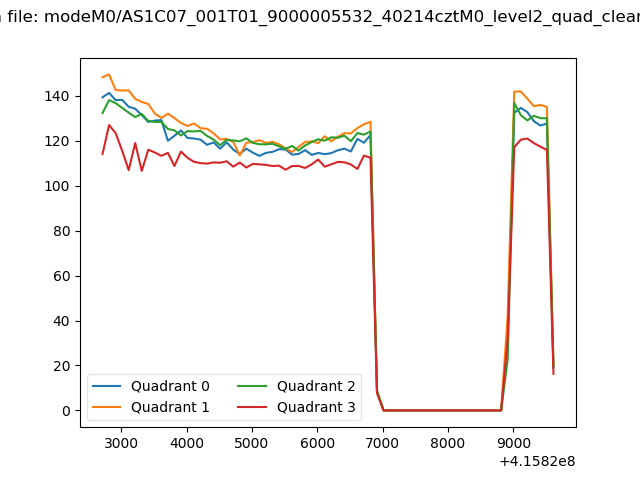 |
|
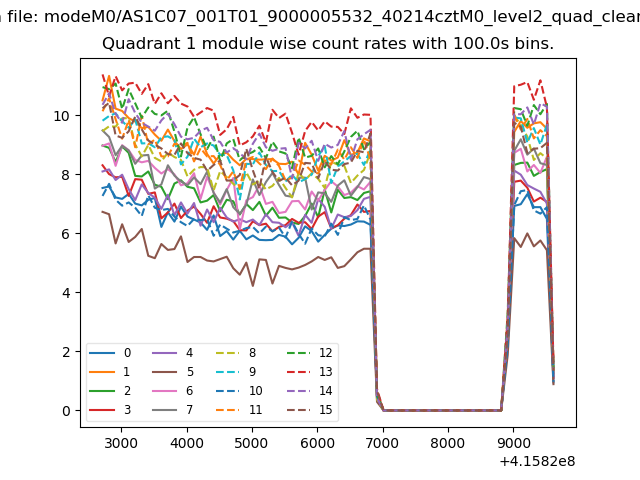
| Module-wise count rates for Quadrant A Data is divided into 100 sec bins |
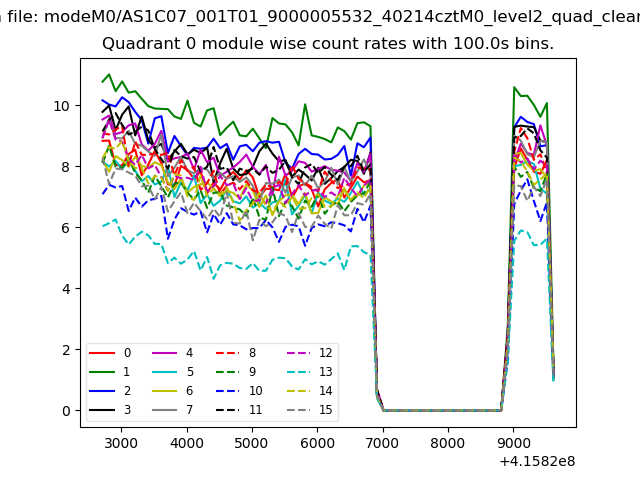 |
 |
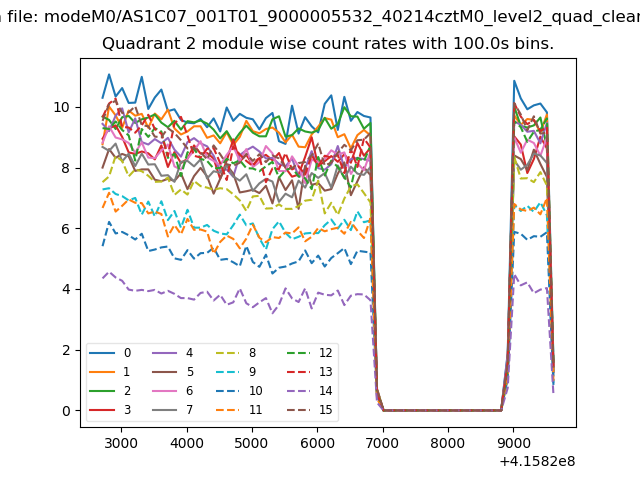
| Module-wise count rates for Quadrant B Data is divided into 100 sec bins |
 |
 |
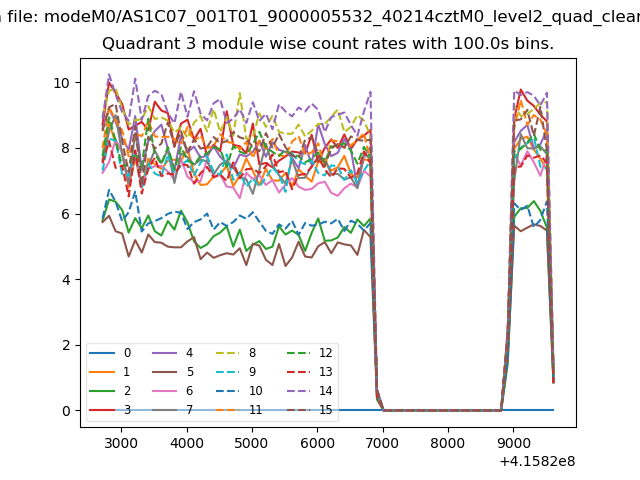
| Module-wise count rates for Quadrant C Data is divided into 100 sec bins |
 |
 |
| Module-wise count rates for Quadrant D Data is divided into 100 sec bins |
 |
 |
| Parameter | Plot |
|---|---|
| CZT HV Monitor | 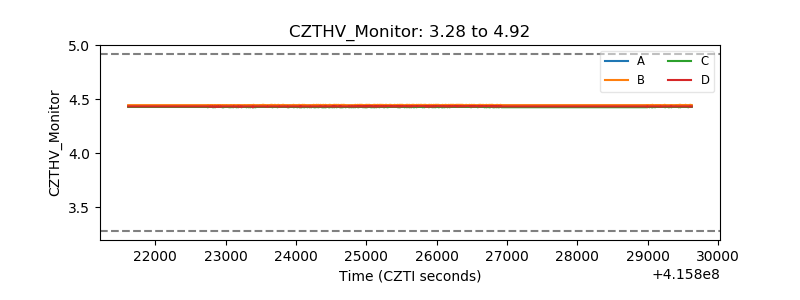 |
| D_VDD | 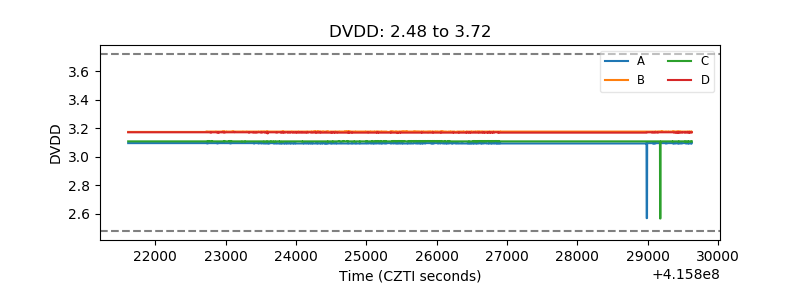 |
| Temperature 1 | 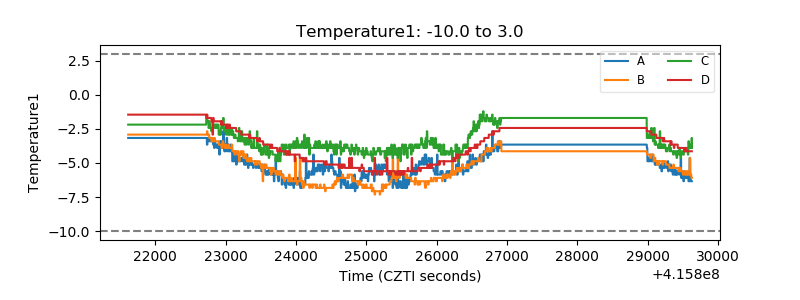 |
| Veto HV Monitor | 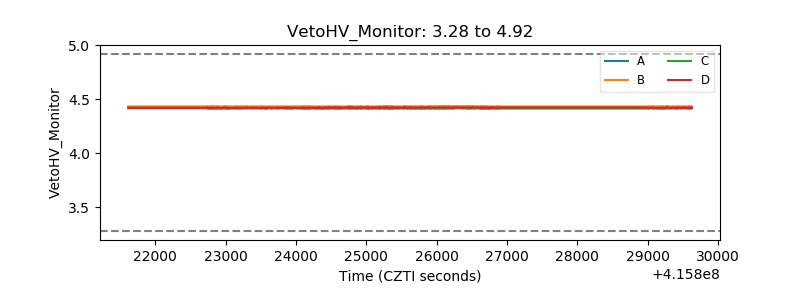 |
| Veto LLD | 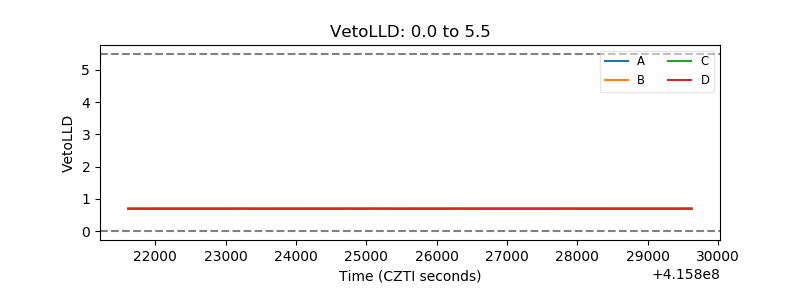 |
| Alpha Counter | 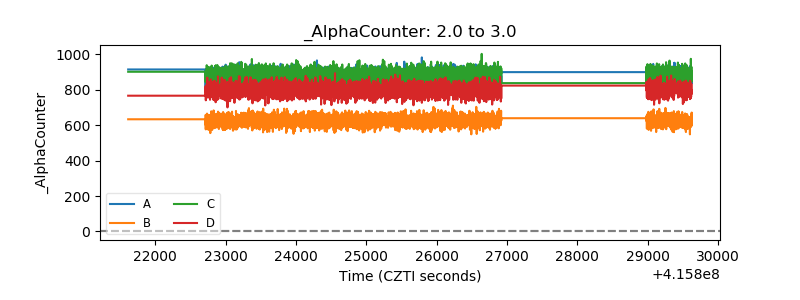 |
| _CPM_Rate | 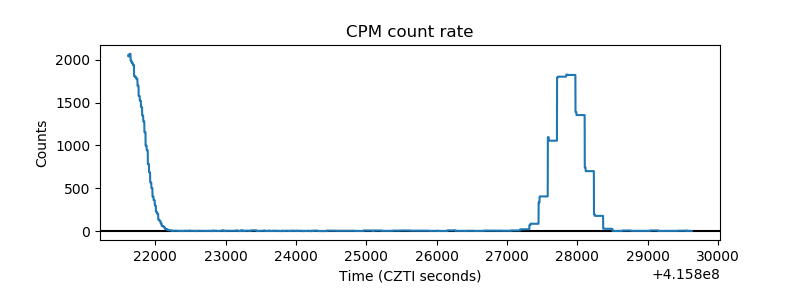 |
| CZT Counter | 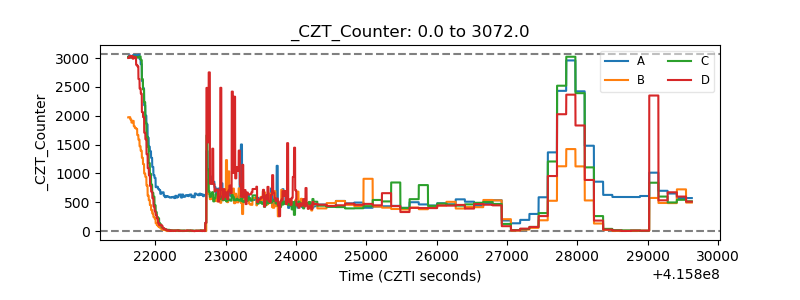 |
| +2.5 Volts monitor |  |
| +5 Volts monitor | 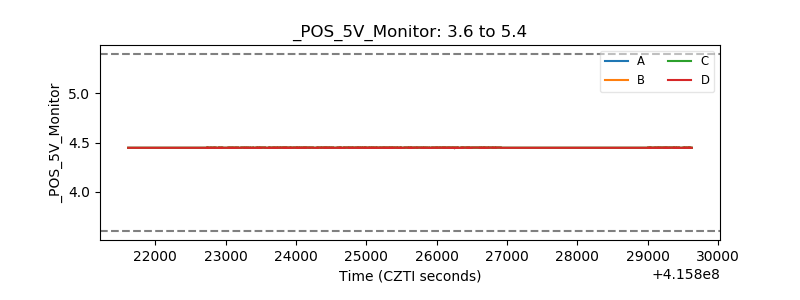 |
| _ROLL_ROT | 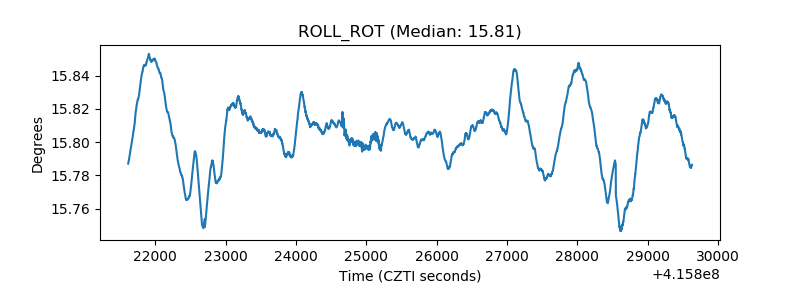 |
| _Roll_DEC | 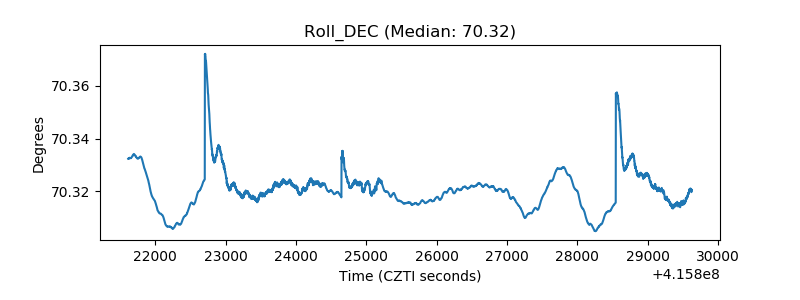 |
| _Roll_RA | 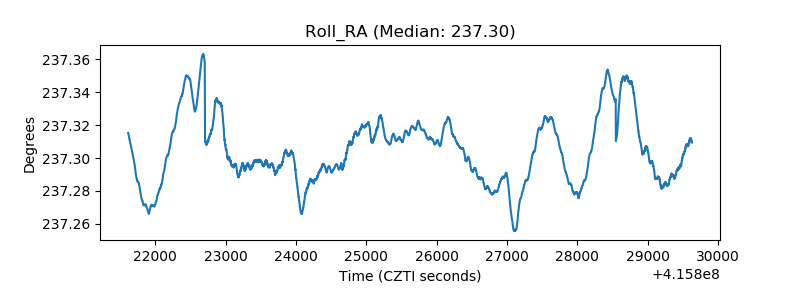 |
| Veto Counter | 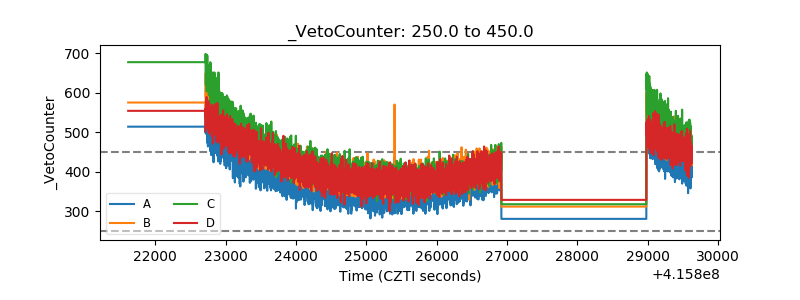 |