| Param | Original file | Final file |
|---|---|---|
| Filename | modeM0/AS1C07_001T01_9000005532_40215cztM0_level2.fits | modeM0/AS1C07_001T01_9000005532_40215cztM0_level2_quad_clean.evt |
| Size (bytes) | 322,387,200 | 85,841,280 |
| Size | 307.5 MB | 81.9 MB |
| Events in quadrant A | 3,370,384 | 549,864 |
| Events in quadrant B | 2,323,667 | 600,403 |
| Events in quadrant C | 2,538,356 | 584,358 |
| Events in quadrant D | 3,324,127 | 525,050 |
| Mode M0 | |||
|---|---|---|---|
| Quadrant | BADHDUFLAG | Total packets | Discarded packets |
| A | 0 | 13109 | 3 |
| B | 0 | 10170 | 2 |
| C | 0 | 10509 | 2 |
| D | 0 | 13167 | 2 |
| Mode M9 | |||
|---|---|---|---|
| Quadrant | BADHDUFLAG | Total packets | Discarded packets |
| A | 0 | 37 | 0 |
| B | 0 | 37 | 0 |
| C | 0 | 37 | 0 |
| D | 0 | 38 | 0 |
| Mode SS | |||
|---|---|---|---|
| Quadrant | BADHDUFLAG | Total packets | Discarded packets |
| A | 0 | 100 | 0 |
| B | 0 | 100 | 0 |
| C | 0 | 100 | 0 |
| D | 0 | 100 | 0 |
| Quadrant | Total seconds | Saturated seconds | Saturation percentage |
|---|---|---|---|
| A | 4838 | 296 | 6.118231% |
| B | 4838 | 30 | 0.620091% |
| C | 4838 | 56 | 1.157503% |
| D | 4838 | 147 | 3.038446% |
Noise dominated data is calculated using 1-second bins in cleaned event files. If a bin has >2000 counts, and if more than 50% of those come from <1% of pixels, then it is considered to be noise-dominated and hence unusable.
| Quadrant | # 1 sec bins | Bins with >0 counts | Bins with >2000 counts | High rate bins dominated by noise | Noise dominated (total time) | Noise dominated (detector-on time) | Marked lightcurve |
|---|---|---|---|---|---|---|---|
| A | 6961 | 4839 | 213 | 213 | 3.06% | 4.40% | 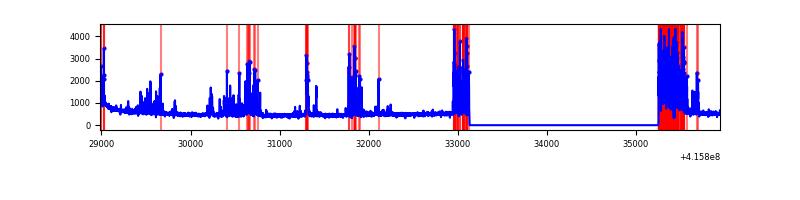 |
| B | 6961 | 4839 | 23 | 23 | 0.33% | 0.48% | 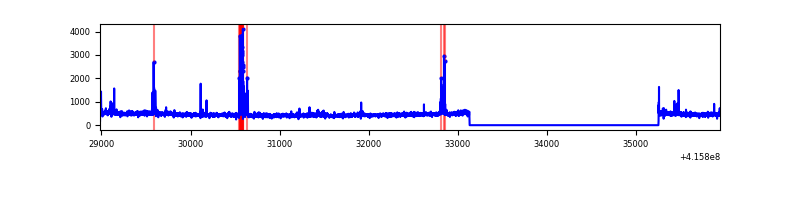 |
| C | 6961 | 4839 | 48 | 48 | 0.69% | 0.99% | 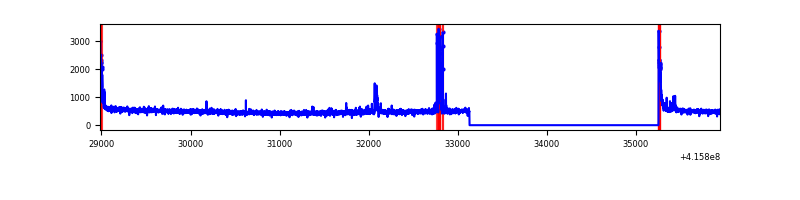 |
| D | 6961 | 4839 | 163 | 163 | 2.34% | 3.37% | 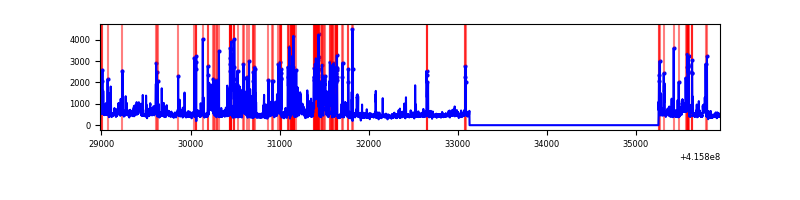 |
Top three noisy pixels from each quadrant. If the there are fewer than three noisy pixels in the level2.evt file, extra rows are filled as -1
| Pixel properties | Quadrant properties | ||||||
|---|---|---|---|---|---|---|---|
| Quadrant | DetID | PixID | Counts | Sigma | Mean | Median | Sigma |
| A | 13 | 248 | 964948 | 9186.09 | 516 | 507 | 105.0 |
| A | 10 | 83 | 404740 | 3850.23 | 516 | 507 | 105.0 |
| A | 3 | 137 | 5542 | 47.96 | 516 | 507 | 105.0 |
| B | 5 | 255 | 144297 | 1422.25 | 536 | 522 | 101.1 |
| B | 0 | 230 | 21534 | 207.85 | 536 | 522 | 101.1 |
| B | 0 | 229 | 20602 | 198.63 | 536 | 522 | 101.1 |
| C | 15 | 214 | 210187 | 1690.33 | 532 | 536 | 124.0 |
| C | 0 | 10 | 103157 | 827.39 | 532 | 536 | 124.0 |
| C | 12 | 250 | 84604 | 677.8 | 532 | 536 | 124.0 |
| D | 12 | 227 | 720966 | 5751.13 | 518 | 505 | 125.3 |
| D | 12 | 79 | 164599 | 1309.89 | 518 | 505 | 125.3 |
| D | 1 | 47 | 145909 | 1160.7 | 518 | 505 | 125.3 |
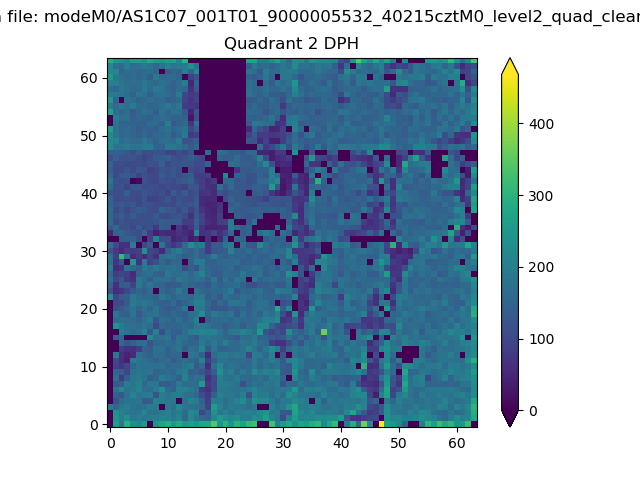
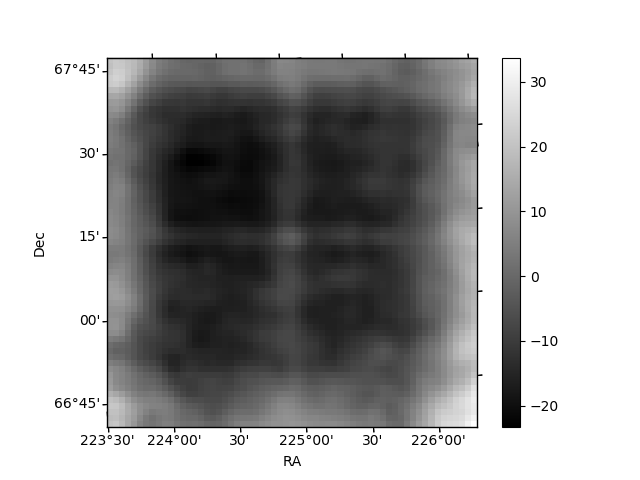
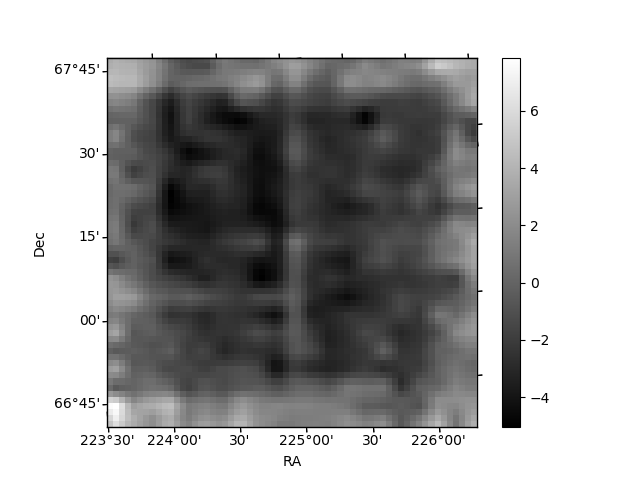
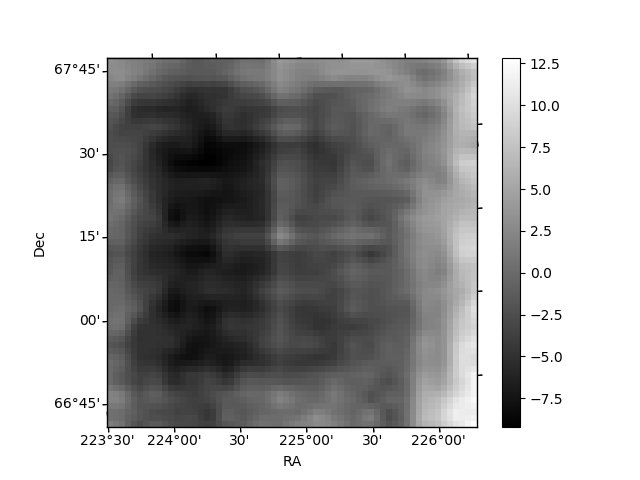
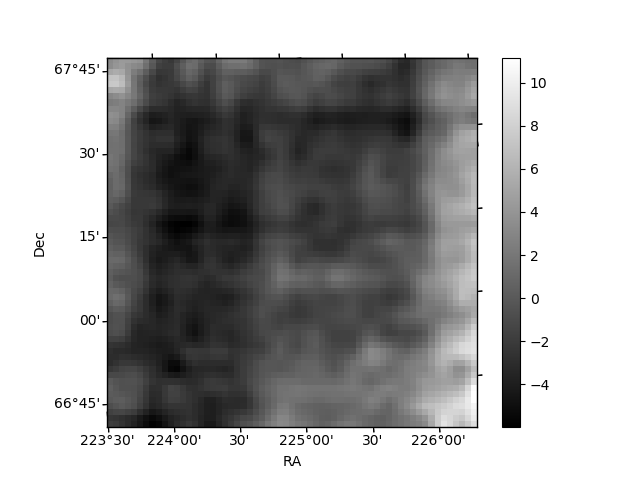
Histogram calculated using DETX and DETY for each event in the final _common_clean file
| Quadrant A | 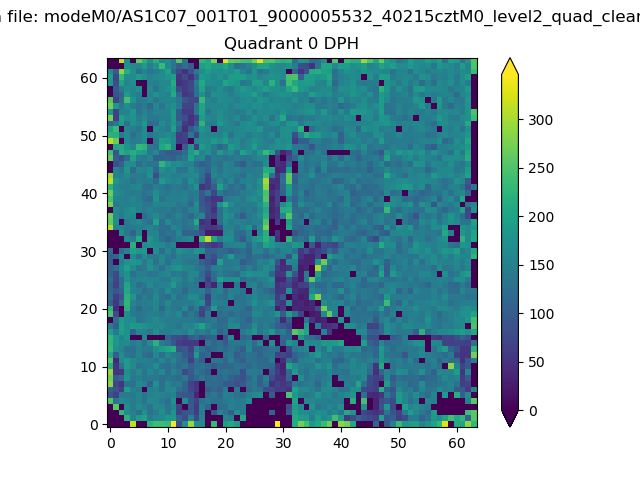 |
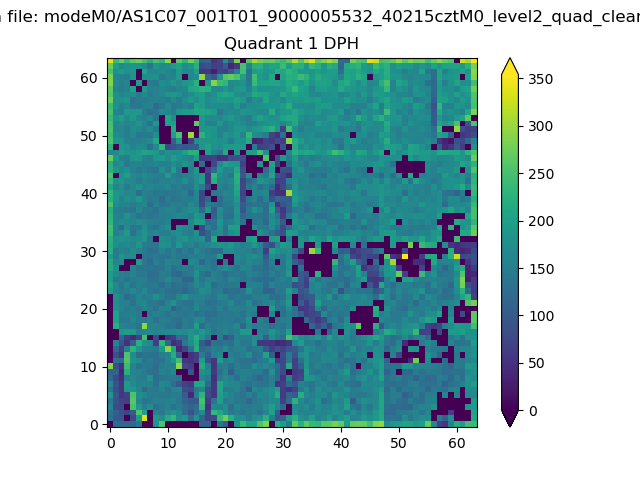 |
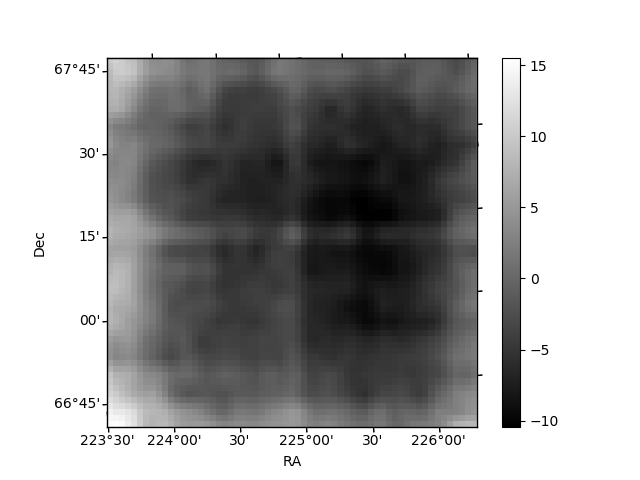
Quadrant B |
|---|---|---|---|
| Quadrant D | 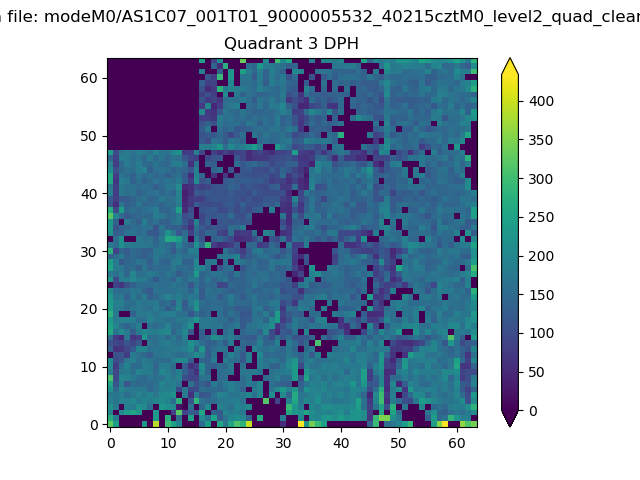 |
 |
Quadrant C |
| Plot type | Count rate plots | Images |
|---|---|---|
| Comparison with Poisson distribution Blue bars denote a histogram of data divided into 1 sec bins. Red curve is a Poisson curve with rate = median count rate of data. |
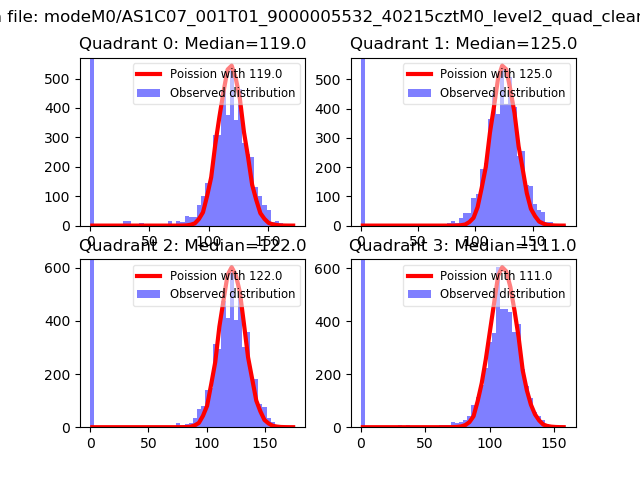 |
 |
| Quadrant-wise count rates Data is divided into 100 sec bins |
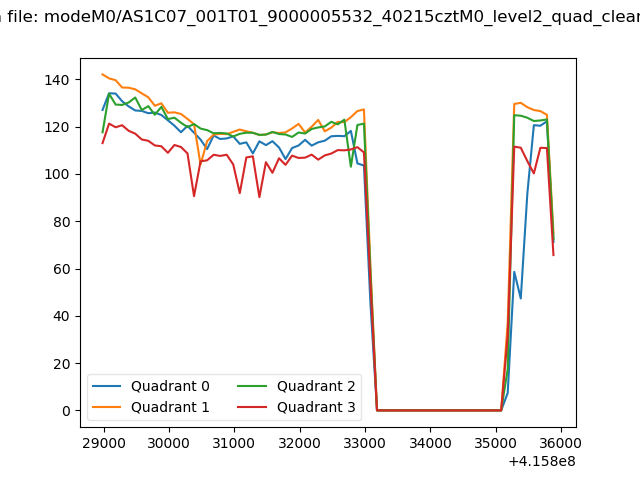 |
|
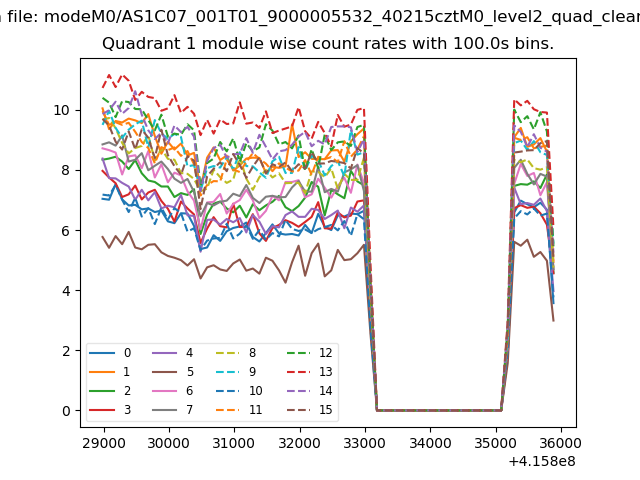
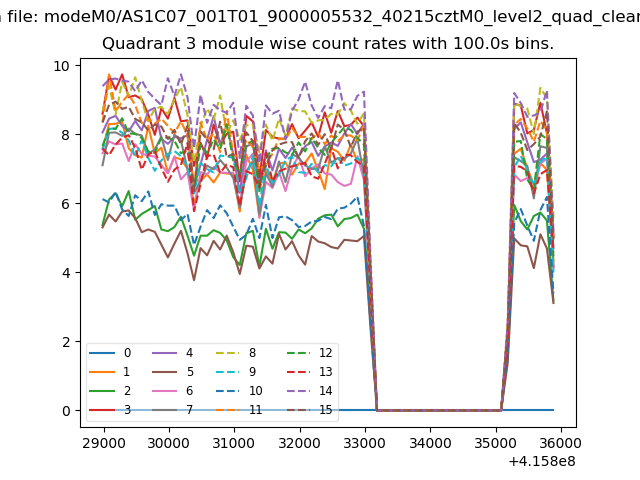
| Module-wise count rates for Quadrant A Data is divided into 100 sec bins |
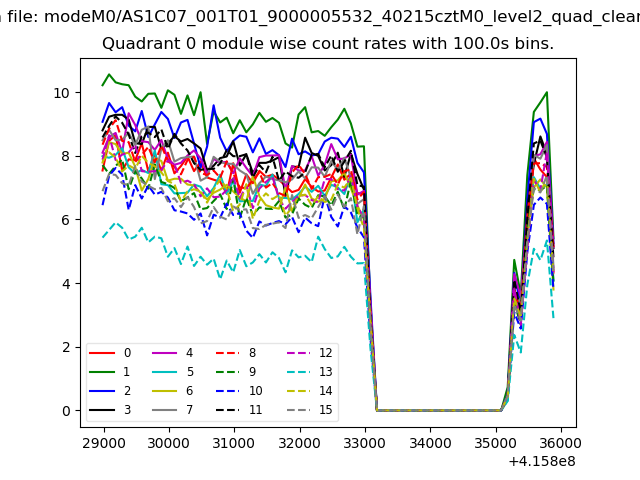 |
 |
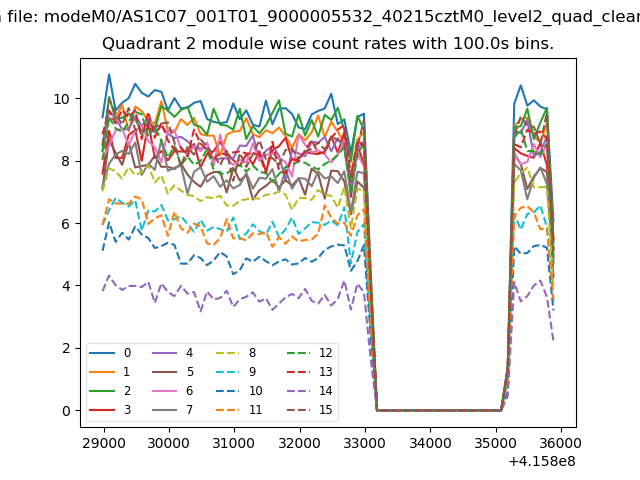
| Module-wise count rates for Quadrant B Data is divided into 100 sec bins |
 |
 |
| Module-wise count rates for Quadrant C Data is divided into 100 sec bins |
 |
 |
| Module-wise count rates for Quadrant D Data is divided into 100 sec bins |
 |
 |
| Parameter | Plot |
|---|---|
| CZT HV Monitor | 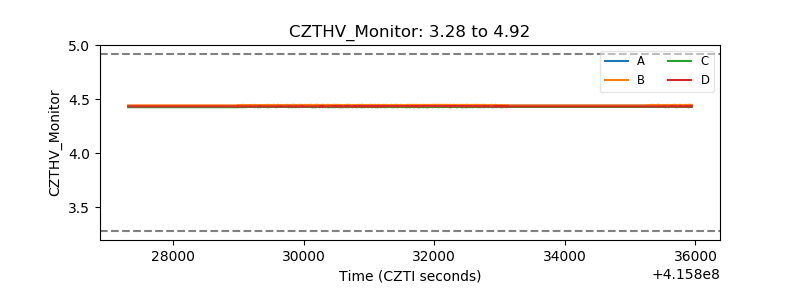 |
| D_VDD | 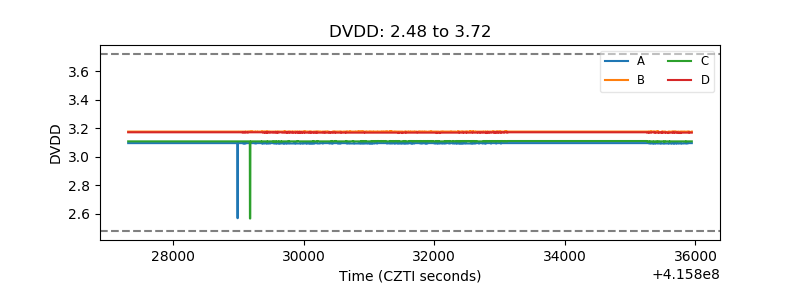 |
| Temperature 1 | 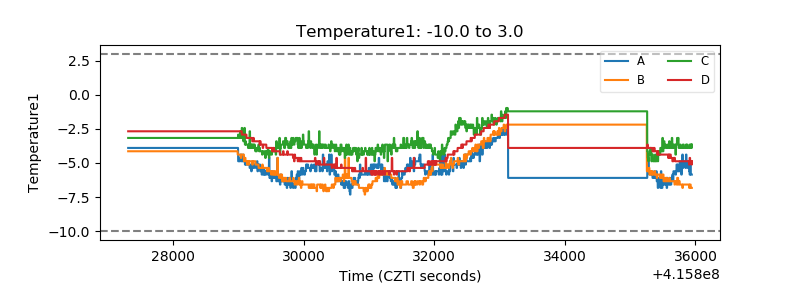 |
| Veto HV Monitor | 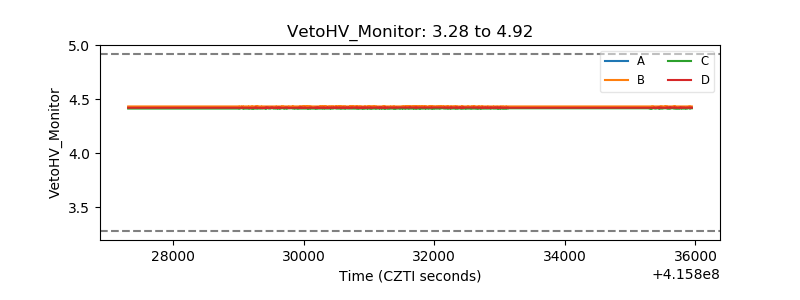 |
| Veto LLD | 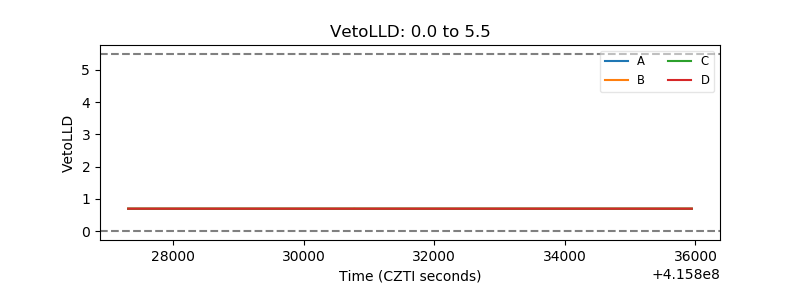 |
| Alpha Counter | 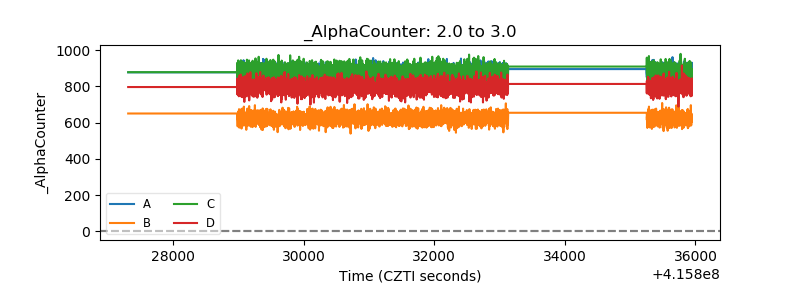 |
| _CPM_Rate | 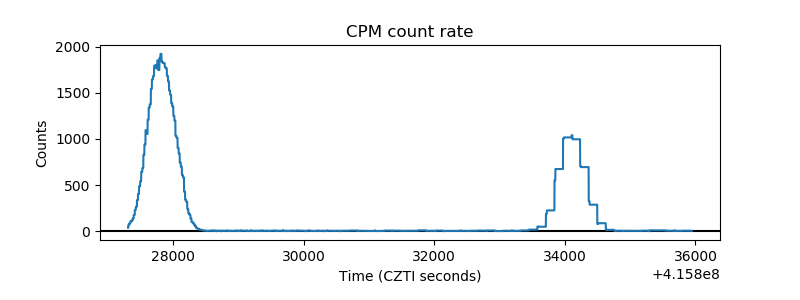 |
| CZT Counter | 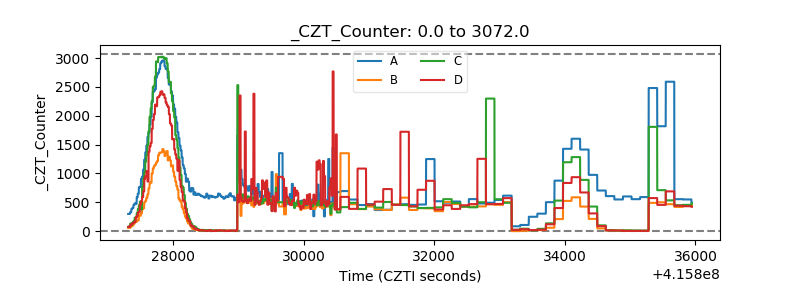 |
| +2.5 Volts monitor | 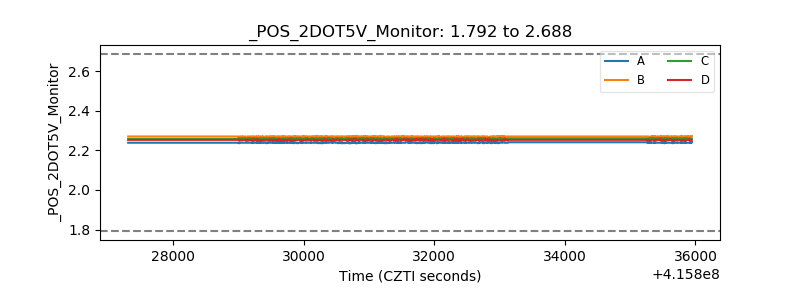 |
| +5 Volts monitor | 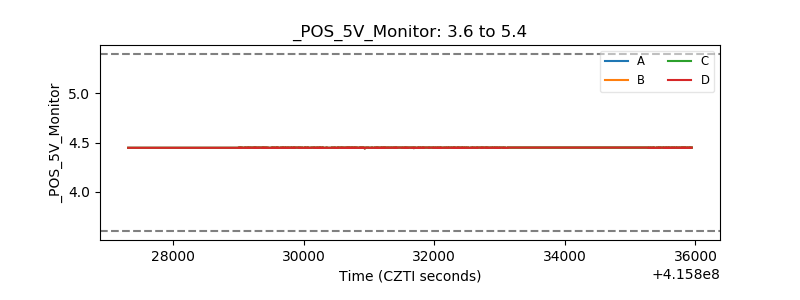 |
| _ROLL_ROT | 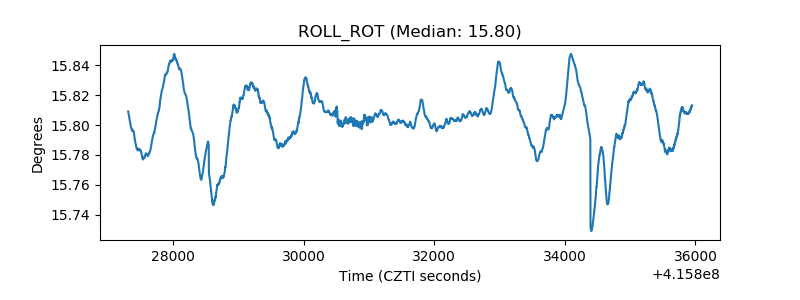 |
| _Roll_DEC | 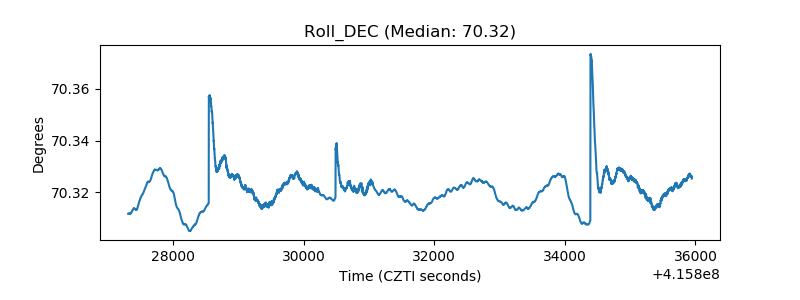 |
| _Roll_RA | 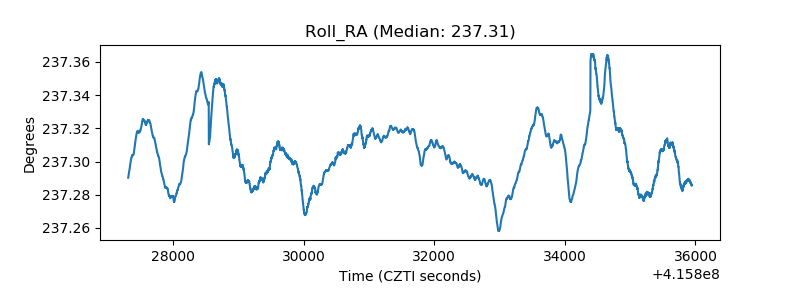 |
| Veto Counter | 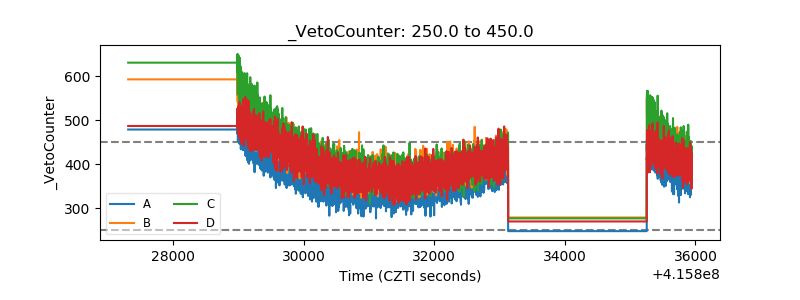 |