| Param | Original file | Final file |
|---|---|---|
| Filename | modeM0/AS1C07_001T01_9000005532_40216cztM0_level2.fits | modeM0/AS1C07_001T01_9000005532_40216cztM0_level2_quad_clean.evt |
| Size (bytes) | 288,838,080 | 84,847,680 |
| Size | 275.5 MB | 80.9 MB |
| Events in quadrant A | 3,256,303 | 536,816 |
| Events in quadrant B | 2,205,412 | 588,242 |
| Events in quadrant C | 2,387,632 | 574,174 |
| Events in quadrant D | 2,456,151 | 522,749 |
| Mode M0 | |||
|---|---|---|---|
| Quadrant | BADHDUFLAG | Total packets | Discarded packets |
| A | 0 | 12948 | 3 |
| B | 0 | 10105 | 2 |
| C | 0 | 10335 | 2 |
| D | 0 | 11001 | 2 |
| Mode M9 | |||
|---|---|---|---|
| Quadrant | BADHDUFLAG | Total packets | Discarded packets |
| A | 0 | 42 | 0 |
| B | 0 | 42 | 0 |
| C | 0 | 42 | 0 |
| D | 0 | 42 | 0 |
| Mode SS | |||
|---|---|---|---|
| Quadrant | BADHDUFLAG | Total packets | Discarded packets |
| A | 0 | 104 | 0 |
| B | 0 | 104 | 0 |
| C | 0 | 104 | 0 |
| D | 0 | 104 | 0 |
| Quadrant | Total seconds | Saturated seconds | Saturation percentage |
|---|---|---|---|
| A | 4950 | 300 | 6.060606% |
| B | 4950 | 3 | 0.060606% |
| C | 4950 | 22 | 0.444444% |
| D | 4950 | 49 | 0.989899% |
Noise dominated data is calculated using 1-second bins in cleaned event files. If a bin has >2000 counts, and if more than 50% of those come from <1% of pixels, then it is considered to be noise-dominated and hence unusable.
| Quadrant | # 1 sec bins | Bins with >0 counts | Bins with >2000 counts | High rate bins dominated by noise | Noise dominated (total time) | Noise dominated (detector-on time) | Marked lightcurve |
|---|---|---|---|---|---|---|---|
| A | 9166 | 4952 | 212 | 212 | 2.31% | 4.28% | 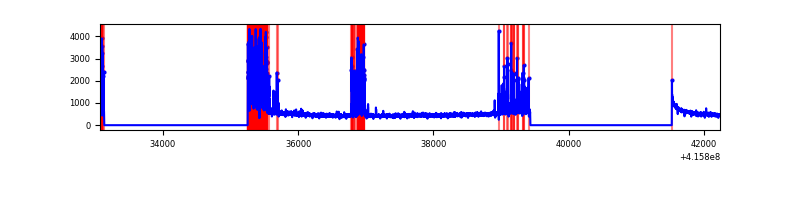 |
| B | 9166 | 4952 | 0 | 0 | 0.00% | 0.00% | 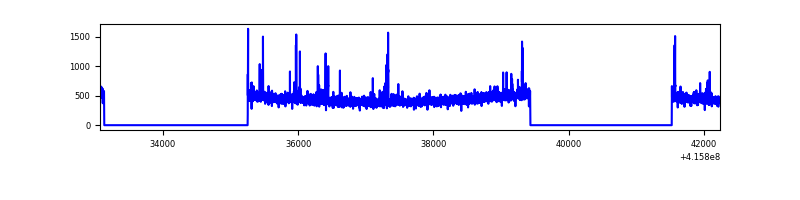 |
| C | 9166 | 4952 | 19 | 19 | 0.21% | 0.38% | 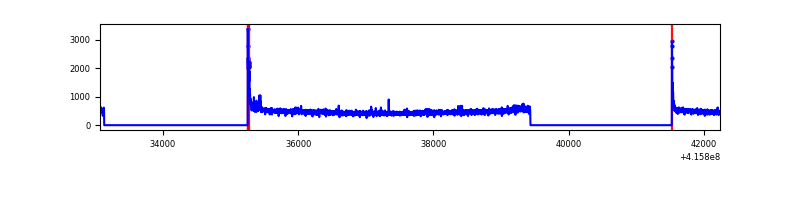 |
| D | 9166 | 4952 | 47 | 47 | 0.51% | 0.95% | 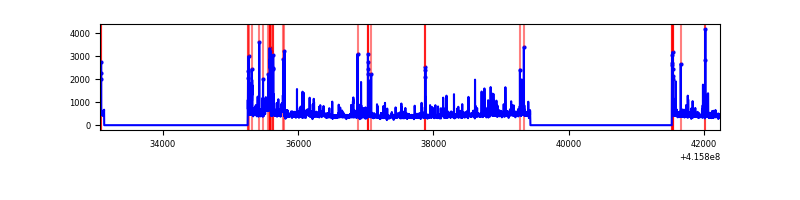 |
Top three noisy pixels from each quadrant. If the there are fewer than three noisy pixels in the level2.evt file, extra rows are filled as -1
| Pixel properties | Quadrant properties | ||||||
|---|---|---|---|---|---|---|---|
| Quadrant | DetID | PixID | Counts | Sigma | Mean | Median | Sigma |
| A | 13 | 248 | 860261 | 8223.87 | 514 | 504 | 104.5 |
| A | 10 | 83 | 404344 | 3862.87 | 514 | 504 | 104.5 |
| A | 3 | 137 | 5628 | 49.01 | 514 | 504 | 104.5 |
| B | 0 | 245 | 46113 | 444.67 | 533 | 519 | 102.5 |
| B | 5 | 255 | 40598 | 390.89 | 533 | 519 | 102.5 |
| B | 12 | 111 | 12421 | 116.08 | 533 | 519 | 102.5 |
| C | 15 | 214 | 214036 | 1744.0 | 526 | 529 | 122.4 |
| C | 0 | 10 | 84588 | 686.62 | 526 | 529 | 122.4 |
| C | 9 | 187 | 21636 | 172.41 | 526 | 529 | 122.4 |
| D | 12 | 227 | 166881 | 1328.78 | 514 | 501 | 125.2 |
| D | 13 | 249 | 78747 | 624.91 | 514 | 501 | 125.2 |
| D | 1 | 47 | 71428 | 566.45 | 514 | 501 | 125.2 |
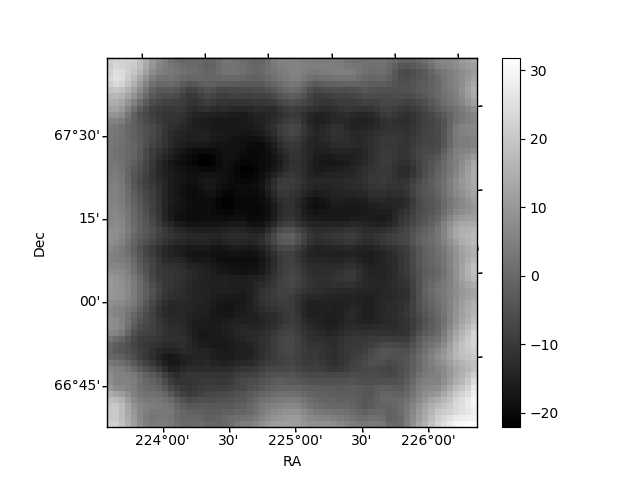
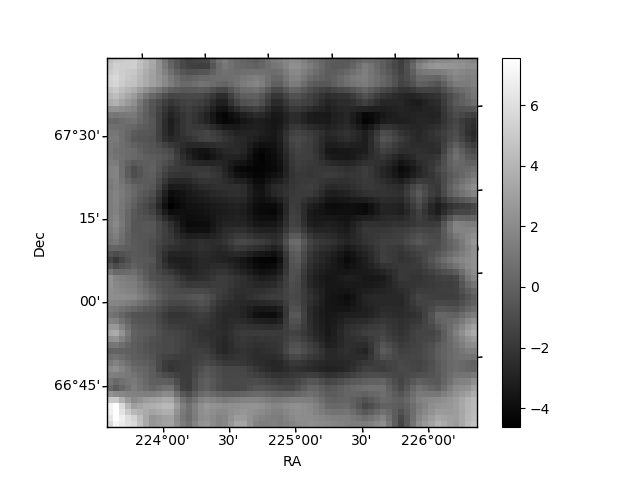
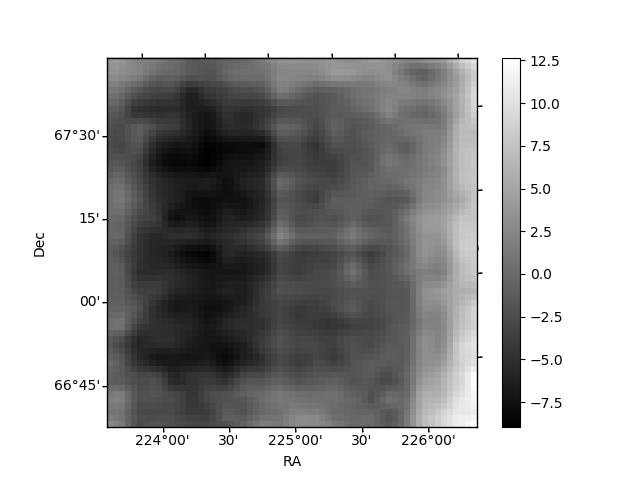
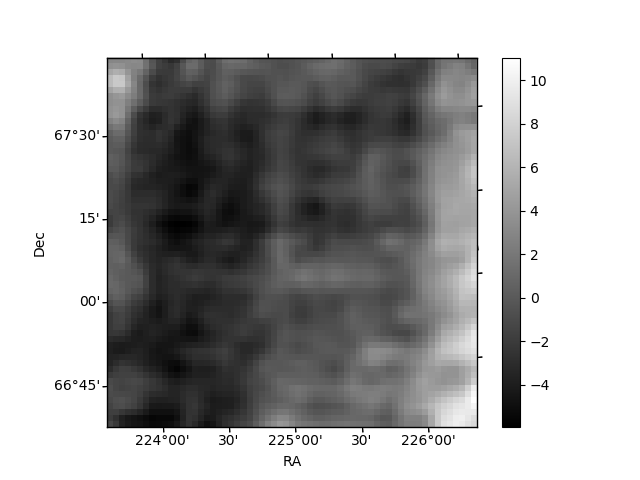
Histogram calculated using DETX and DETY for each event in the final _common_clean file
| Quadrant A | 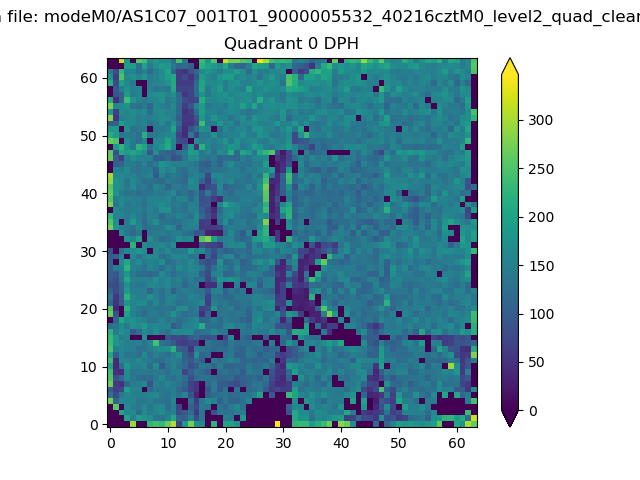 |
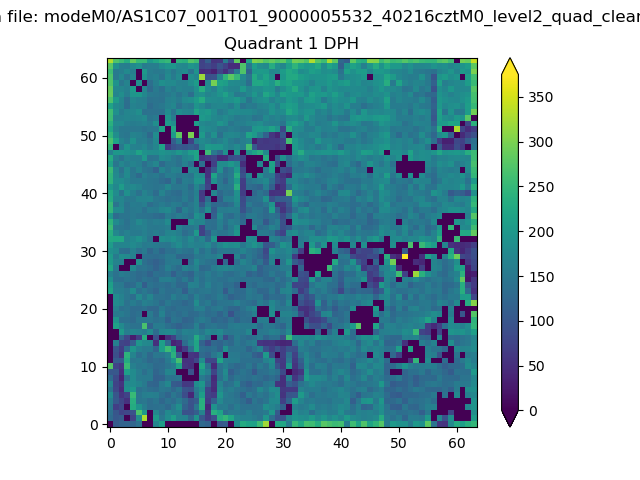 |
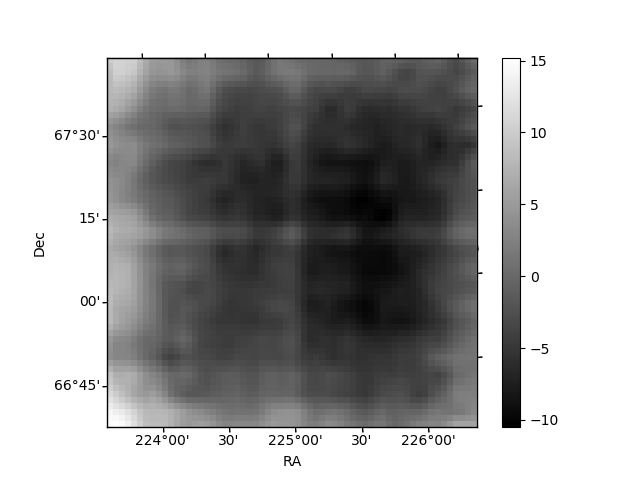
Quadrant B |
|---|---|---|---|
| Quadrant D | 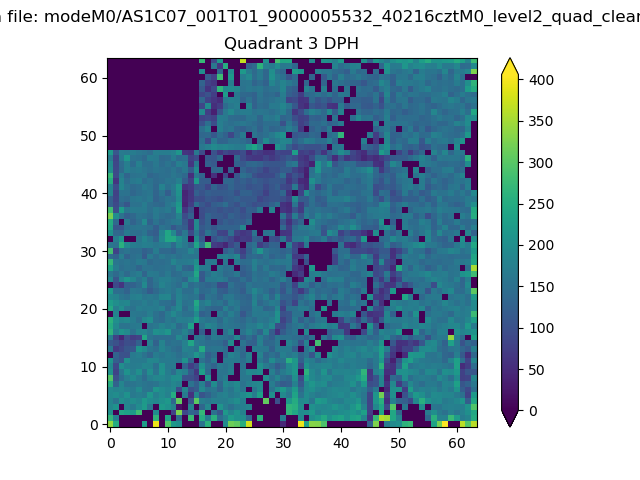 |
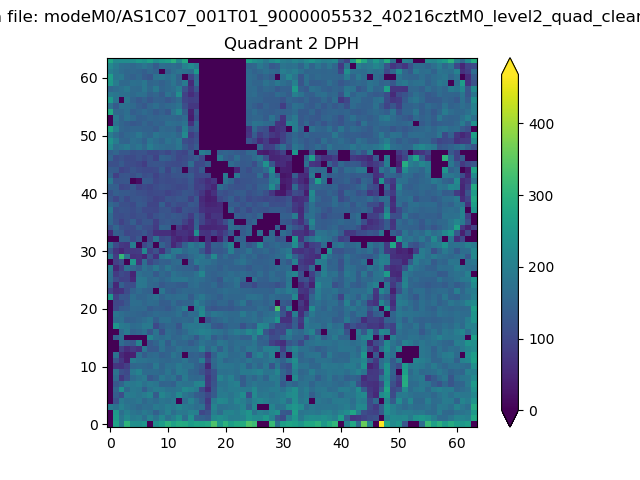 |
Quadrant C |
| Plot type | Count rate plots | Images |
|---|---|---|
| Comparison with Poisson distribution Blue bars denote a histogram of data divided into 1 sec bins. Red curve is a Poisson curve with rate = median count rate of data. |
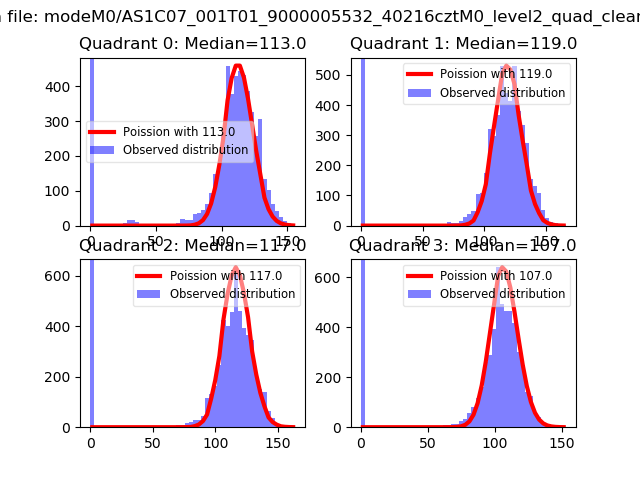 |
 |
| Quadrant-wise count rates Data is divided into 100 sec bins |
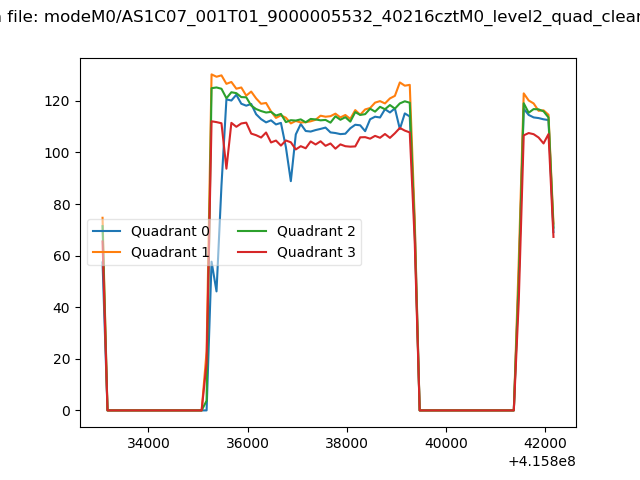 |
|
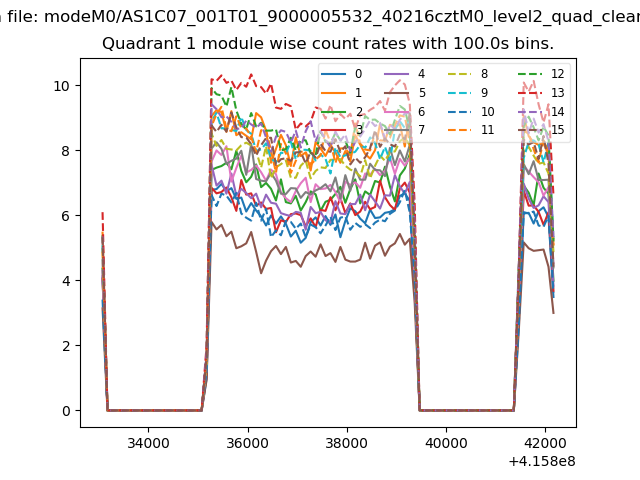
| Module-wise count rates for Quadrant A Data is divided into 100 sec bins |
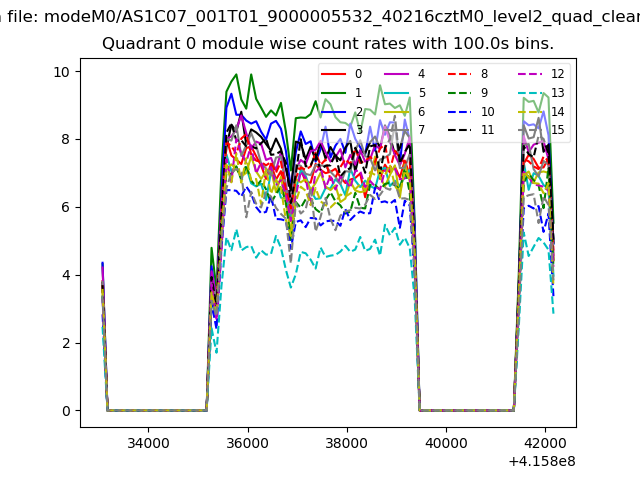 |
 |
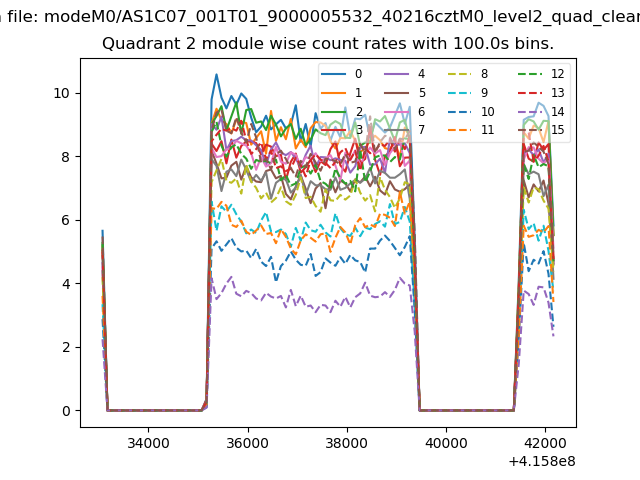
| Module-wise count rates for Quadrant B Data is divided into 100 sec bins |
 |
 |
| Module-wise count rates for Quadrant C Data is divided into 100 sec bins |
 |
 |
| Module-wise count rates for Quadrant D Data is divided into 100 sec bins |
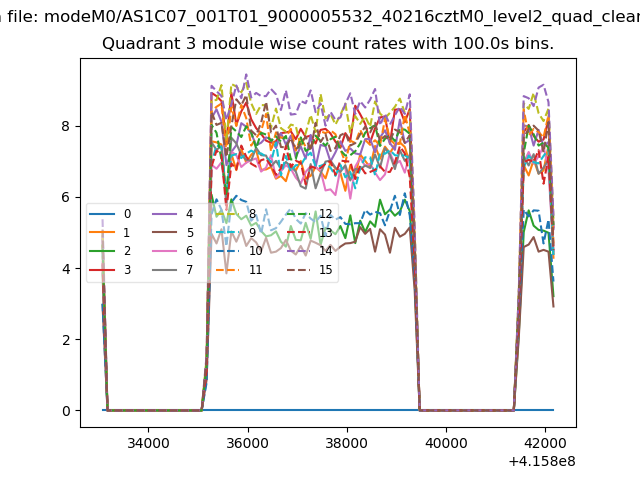 |
 |
| Parameter | Plot |
|---|---|
| CZT HV Monitor | 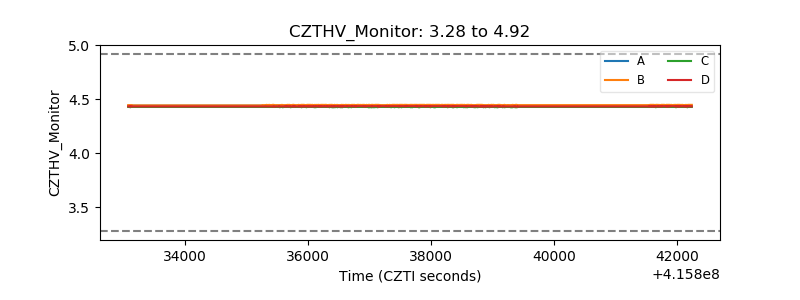 |
| D_VDD | 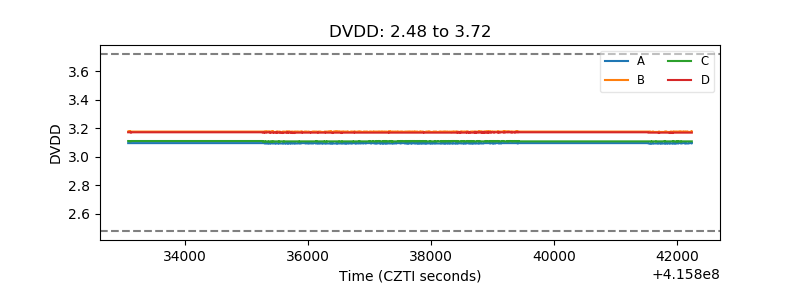 |
| Temperature 1 | 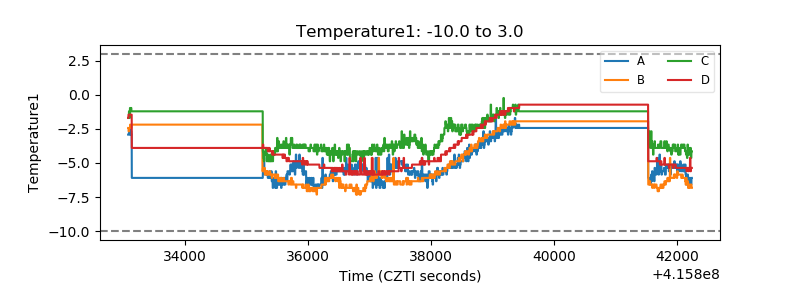 |
| Veto HV Monitor | 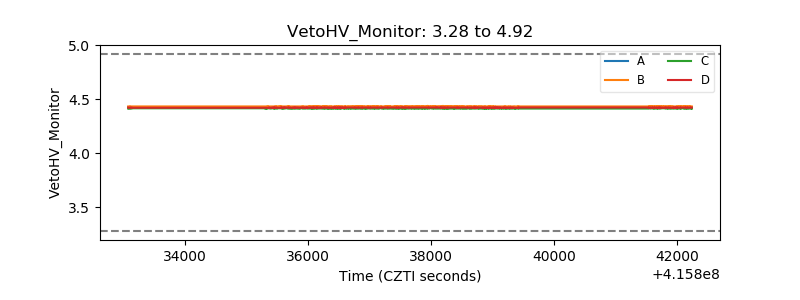 |
| Veto LLD | 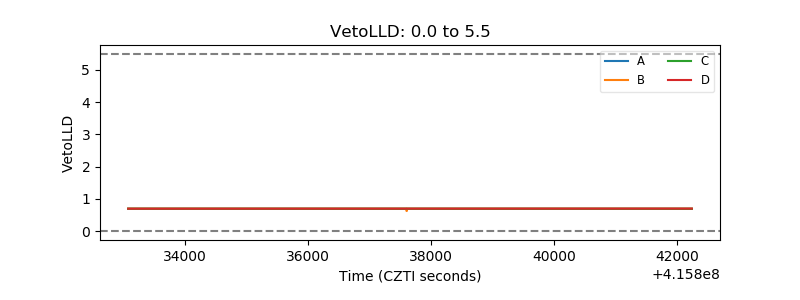 |
| Alpha Counter | 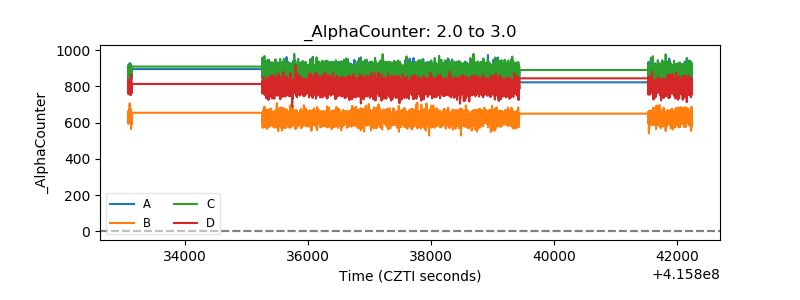 |
| _CPM_Rate | 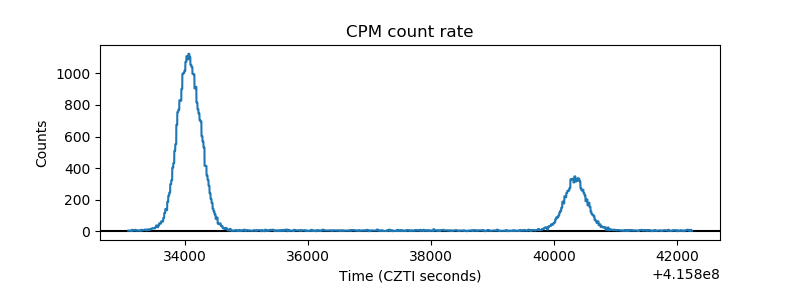 |
| CZT Counter | 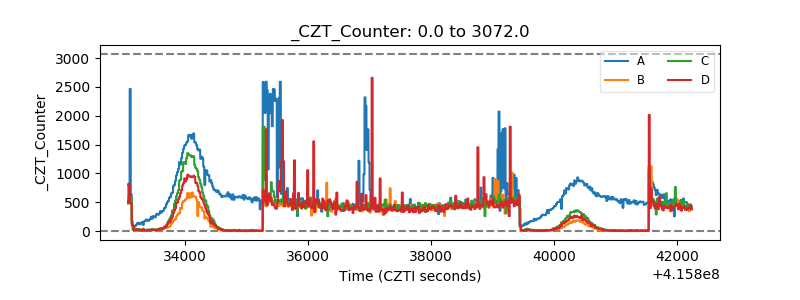 |
| +2.5 Volts monitor | 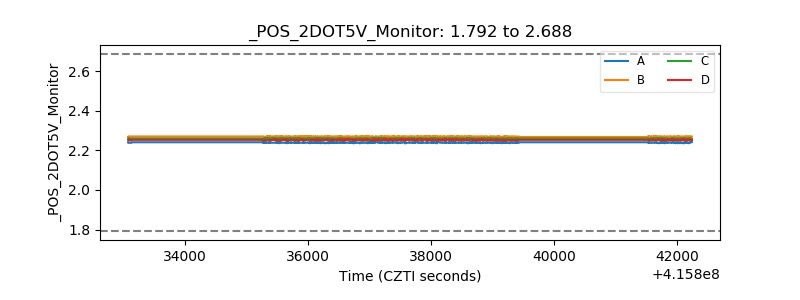 |
| +5 Volts monitor | 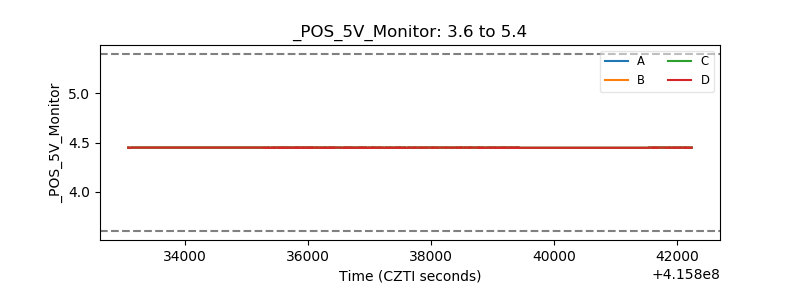 |
| _ROLL_ROT | 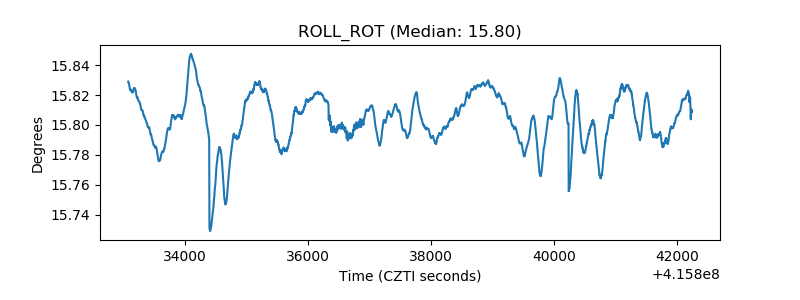 |
| _Roll_DEC | 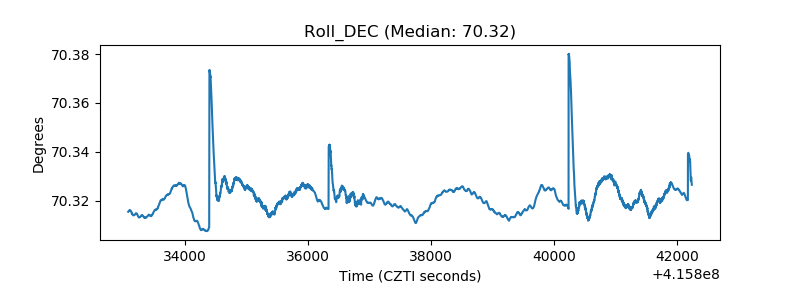 |
| _Roll_RA | 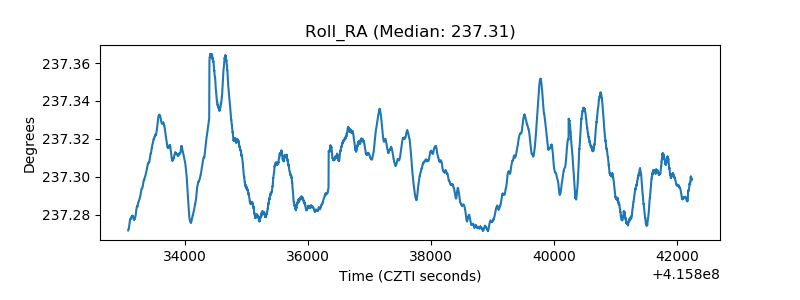 |
| Veto Counter | 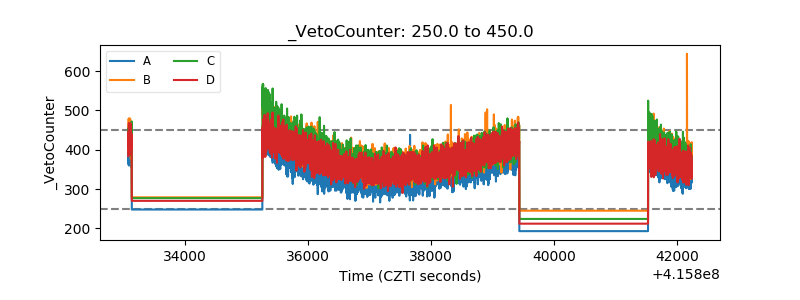 |