| Param | Original file | Final file |
|---|---|---|
| Filename | modeM0/AS1C07_001T01_9000005532_40218cztM0_level2.fits | modeM0/AS1C07_001T01_9000005532_40218cztM0_level2_quad_clean.evt |
| Size (bytes) | 347,221,440 | 93,277,440 |
| Size | 331.1 MB | 89.0 MB |
| Events in quadrant A | 3,493,334 | 604,505 |
| Events in quadrant B | 2,571,269 | 639,280 |
| Events in quadrant C | 2,775,087 | 621,999 |
| Events in quadrant D | 3,565,176 | 556,746 |
| Mode M0 | |||
|---|---|---|---|
| Quadrant | BADHDUFLAG | Total packets | Discarded packets |
| A | 0 | 14113 | 3 |
| B | 0 | 11895 | 2 |
| C | 0 | 12049 | 2 |
| D | 0 | 14876 | 2 |
| Mode M9 | |||
|---|---|---|---|
| Quadrant | BADHDUFLAG | Total packets | Discarded packets |
| A | 0 | 35 | 0 |
| B | 0 | 35 | 0 |
| C | 0 | 35 | 0 |
| D | 0 | 35 | 0 |
| Mode SS | |||
|---|---|---|---|
| Quadrant | BADHDUFLAG | Total packets | Discarded packets |
| A | 0 | 118 | 0 |
| B | 0 | 118 | 0 |
| C | 0 | 118 | 0 |
| D | 0 | 118 | 0 |
| Quadrant | Total seconds | Saturated seconds | Saturation percentage |
|---|---|---|---|
| A | 5751 | 221 | 3.842810% |
| B | 5751 | 17 | 0.295601% |
| C | 5751 | 15 | 0.260824% |
| D | 5751 | 190 | 3.303773% |
Noise dominated data is calculated using 1-second bins in cleaned event files. If a bin has >2000 counts, and if more than 50% of those come from <1% of pixels, then it is considered to be noise-dominated and hence unusable.
| Quadrant | # 1 sec bins | Bins with >0 counts | Bins with >2000 counts | High rate bins dominated by noise | Noise dominated (total time) | Noise dominated (detector-on time) | Marked lightcurve |
|---|---|---|---|---|---|---|---|
| A | 9247 | 5753 | 160 | 160 | 1.73% | 2.78% | 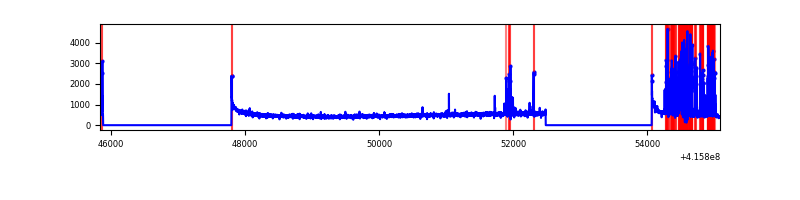 |
| B | 9247 | 5753 | 8 | 8 | 0.09% | 0.14% | 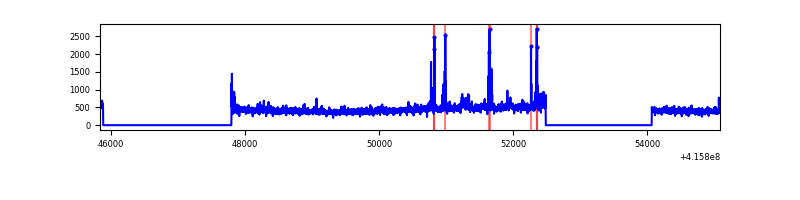 |
| C | 9247 | 5753 | 8 | 8 | 0.09% | 0.14% | 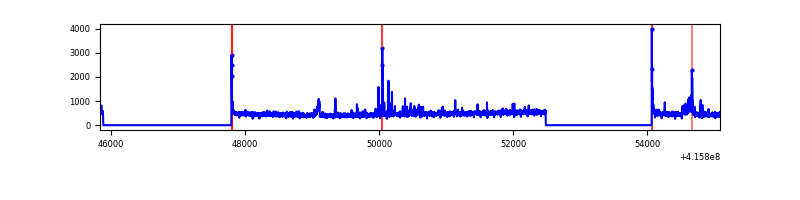 |
| D | 9247 | 5753 | 152 | 152 | 1.64% | 2.64% | 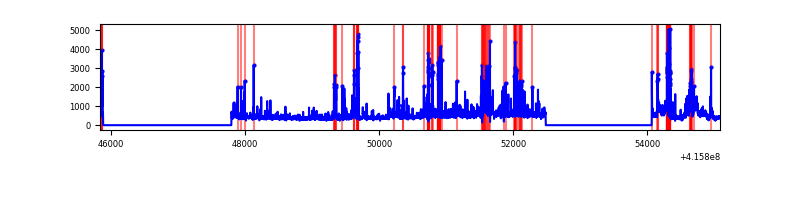 |
Top three noisy pixels from each quadrant. If the there are fewer than three noisy pixels in the level2.evt file, extra rows are filled as -1
| Pixel properties | Quadrant properties | ||||||
|---|---|---|---|---|---|---|---|
| Quadrant | DetID | PixID | Counts | Sigma | Mean | Median | Sigma |
| A | 13 | 248 | 674588 | 5516.68 | 596 | 584 | 122.2 |
| A | 10 | 83 | 478788 | 3914.07 | 596 | 584 | 122.2 |
| A | 2 | 79 | 26199 | 209.66 | 596 | 584 | 122.2 |
| B | 5 | 255 | 82740 | 704.67 | 604 | 587 | 116.6 |
| B | 0 | 229 | 34689 | 292.51 | 604 | 587 | 116.6 |
| B | 0 | 245 | 32530 | 273.99 | 604 | 587 | 116.6 |
| C | 15 | 214 | 247845 | 1800.6 | 593 | 597 | 137.3 |
| C | 9 | 187 | 126049 | 913.61 | 593 | 597 | 137.3 |
| C | 0 | 10 | 39221 | 281.28 | 593 | 597 | 137.3 |
| D | 12 | 227 | 1024764 | 7277.16 | 579 | 561 | 140.7 |
| D | 9 | 19 | 177328 | 1255.96 | 579 | 561 | 140.7 |
| D | 13 | 249 | 75437 | 532.01 | 579 | 561 | 140.7 |
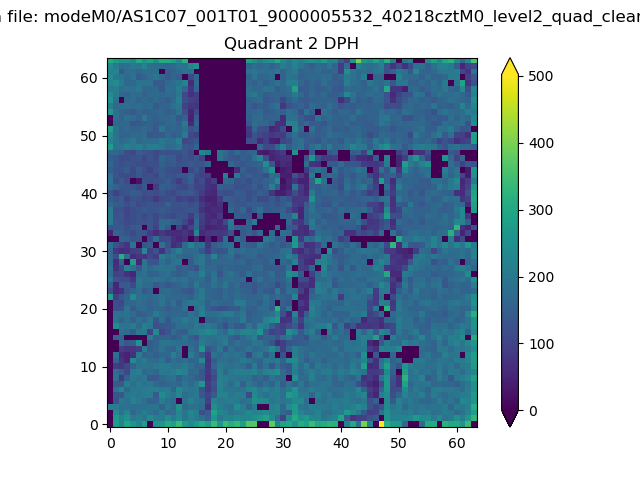
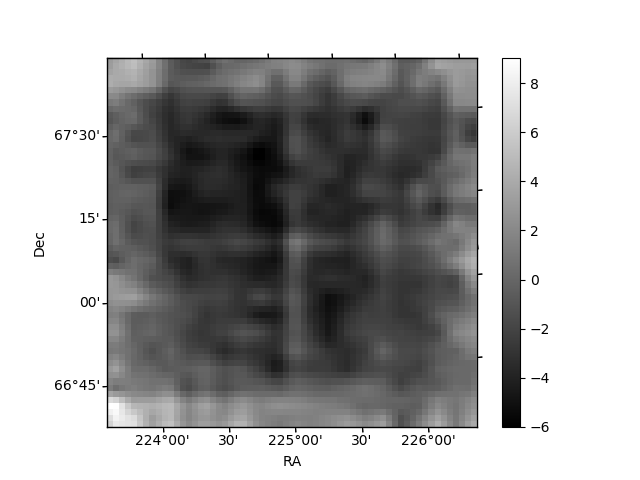
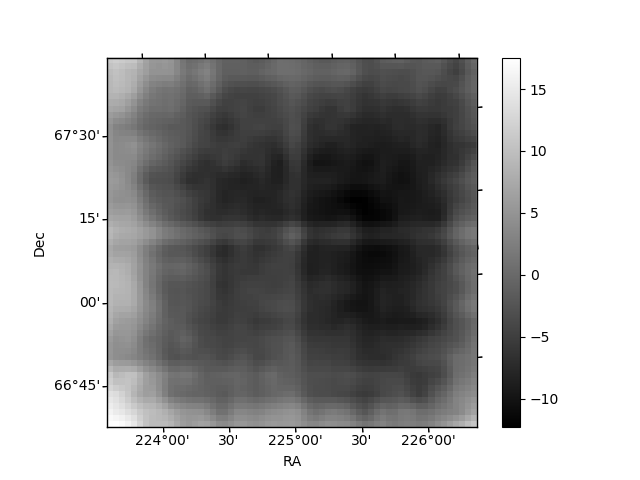
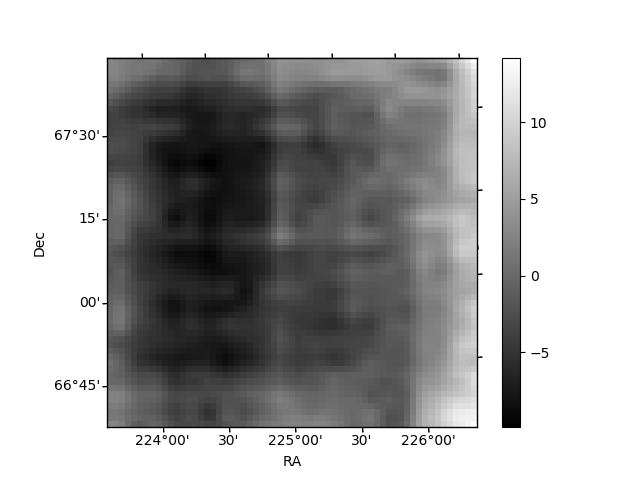
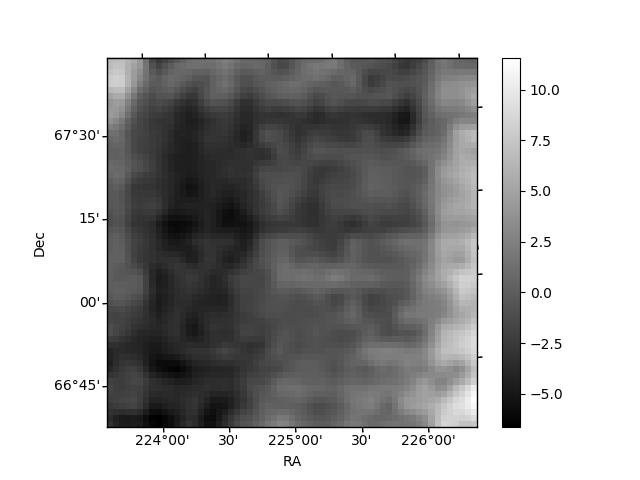
Histogram calculated using DETX and DETY for each event in the final _common_clean file
| Quadrant A | 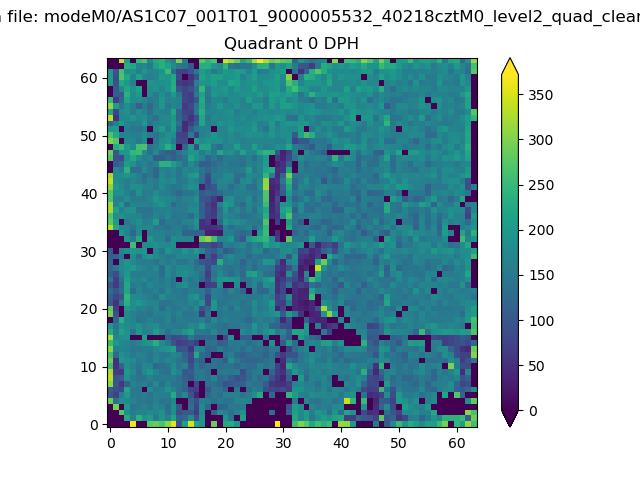 |
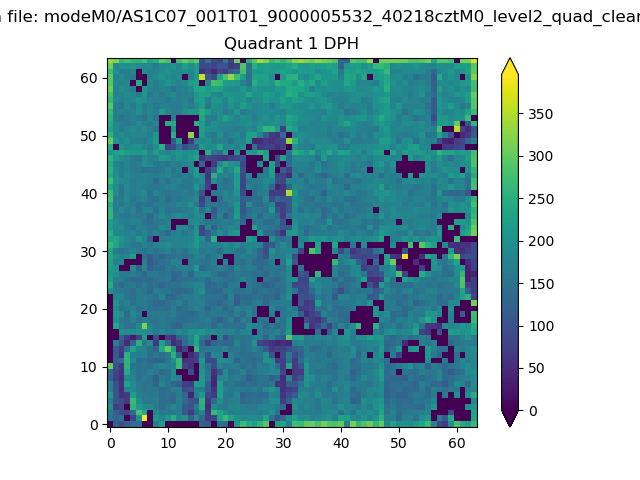 |
Quadrant B |
|---|---|---|---|
| Quadrant D | 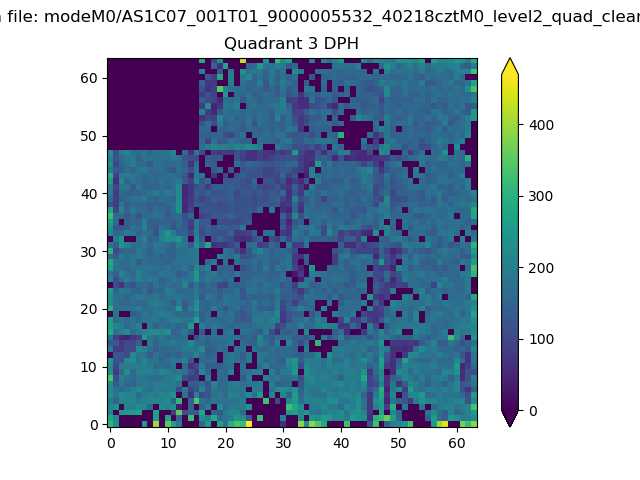 |
 |
Quadrant C |
| Plot type | Count rate plots | Images |
|---|---|---|
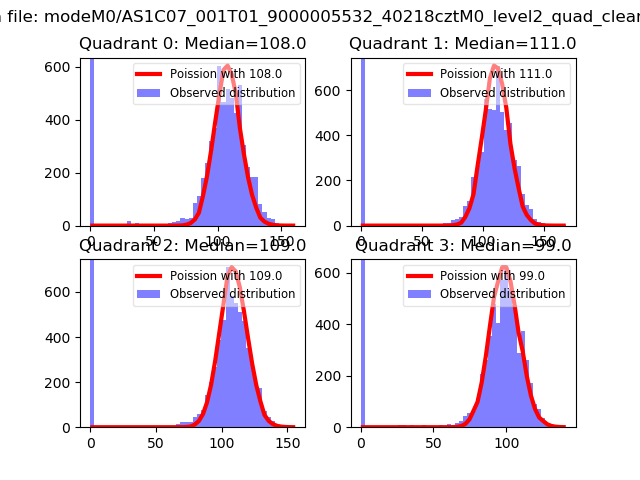
| Comparison with Poisson distribution Blue bars denote a histogram of data divided into 1 sec bins. Red curve is a Poisson curve with rate = median count rate of data. |
 |
 |
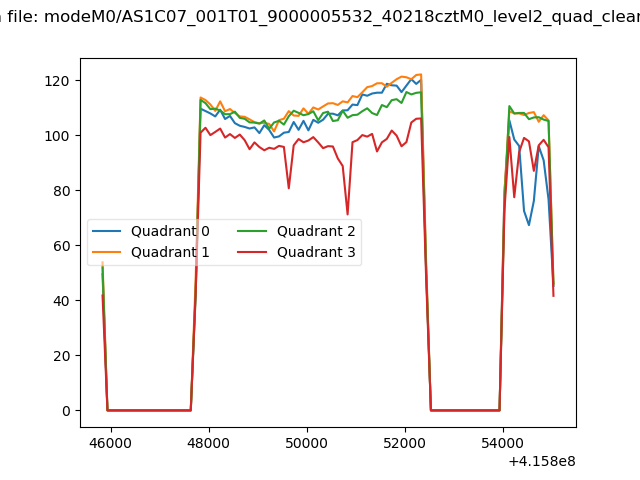
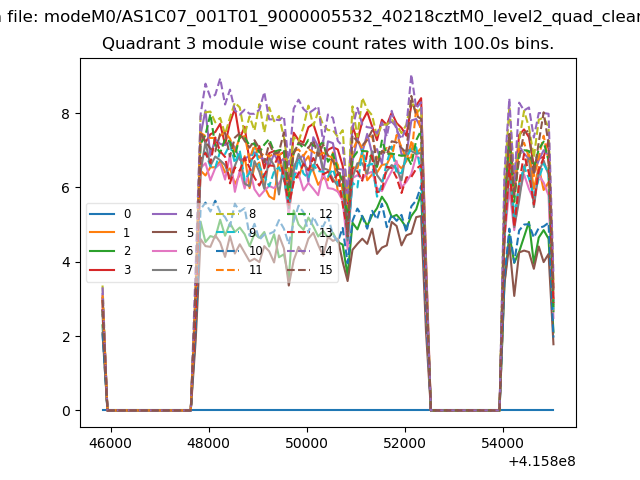
| Quadrant-wise count rates Data is divided into 100 sec bins |
 |
|
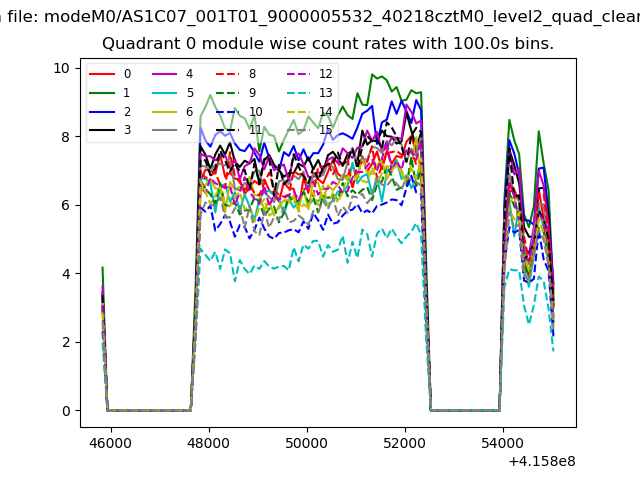
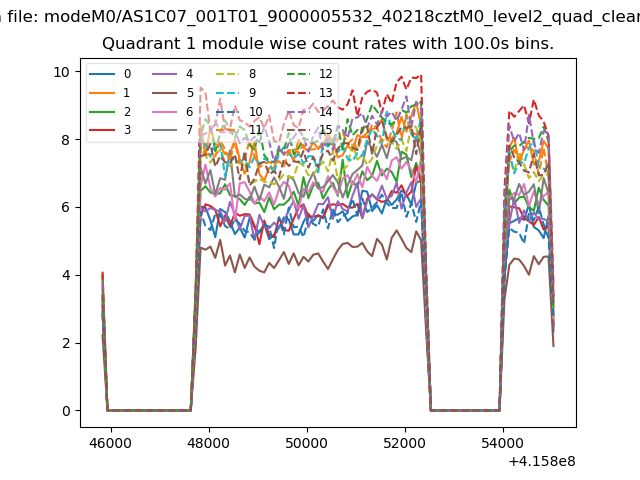
| Module-wise count rates for Quadrant A Data is divided into 100 sec bins |
 |
 |
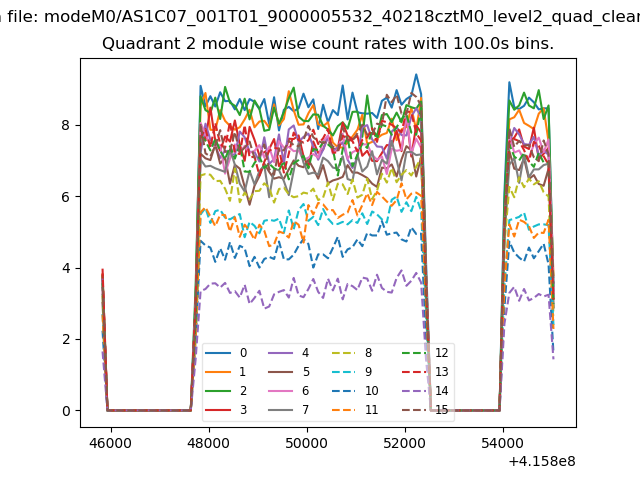
| Module-wise count rates for Quadrant B Data is divided into 100 sec bins |
 |
 |
| Module-wise count rates for Quadrant C Data is divided into 100 sec bins |
 |
 |
| Module-wise count rates for Quadrant D Data is divided into 100 sec bins |
 |
 |
| Parameter | Plot |
|---|---|
| CZT HV Monitor | 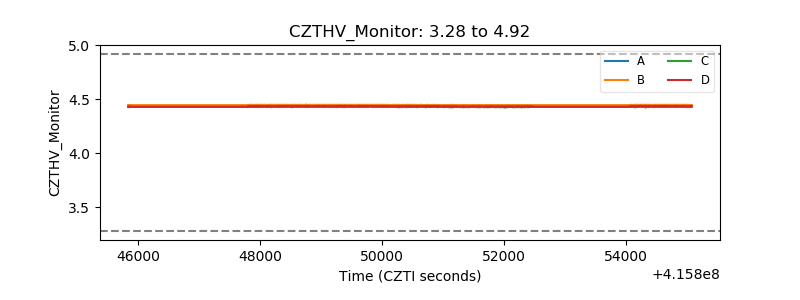 |
| D_VDD |  |
| Temperature 1 | 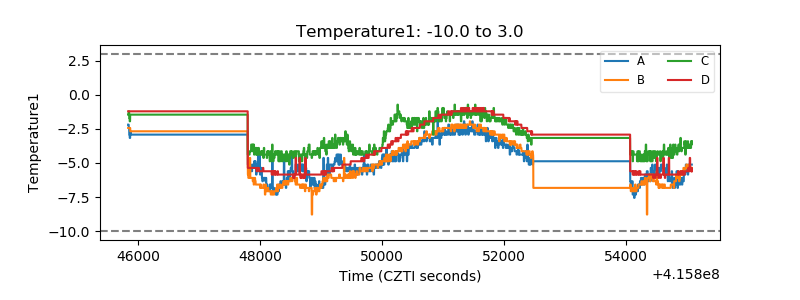 |
| Veto HV Monitor | 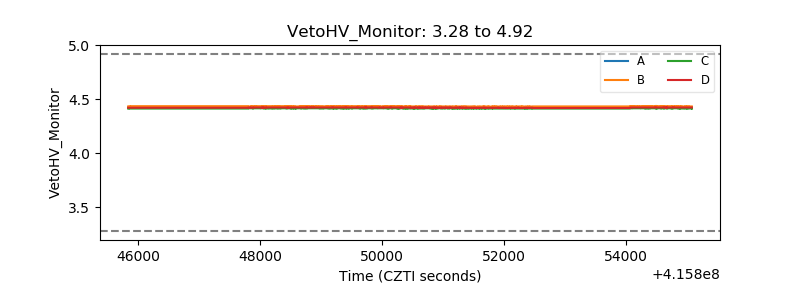 |
| Veto LLD | 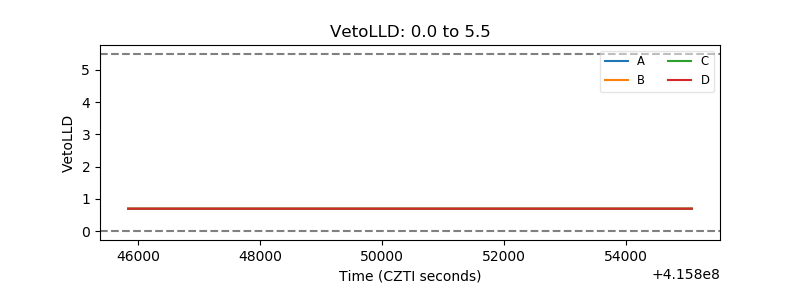 |
| Alpha Counter | 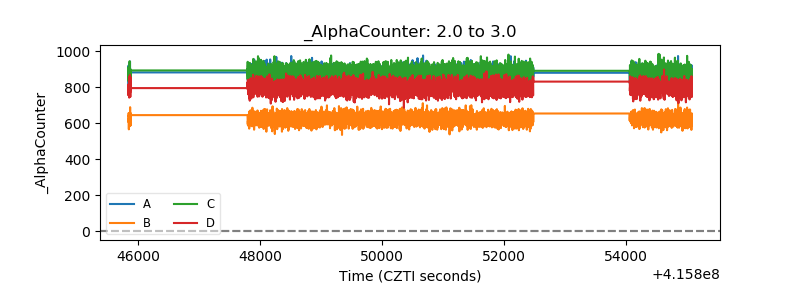 |
| _CPM_Rate | 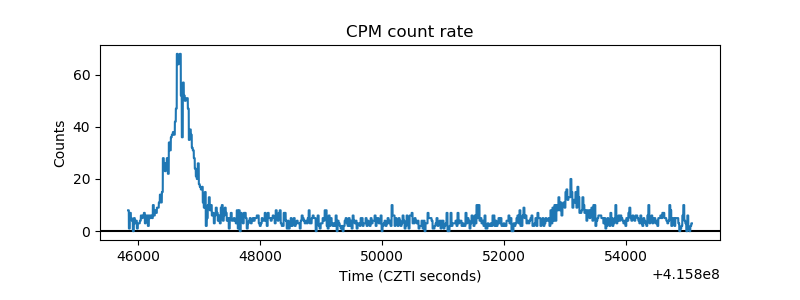 |
| CZT Counter | 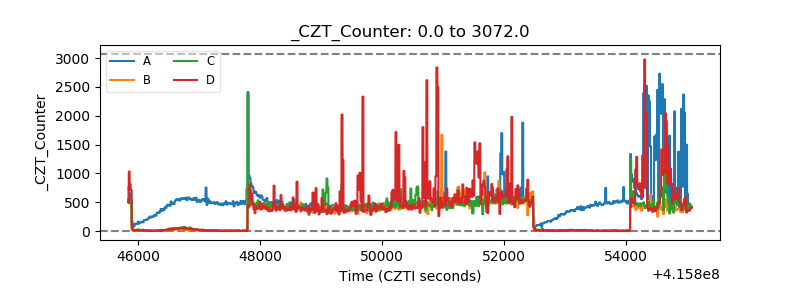 |
| +2.5 Volts monitor |  |
| +5 Volts monitor | 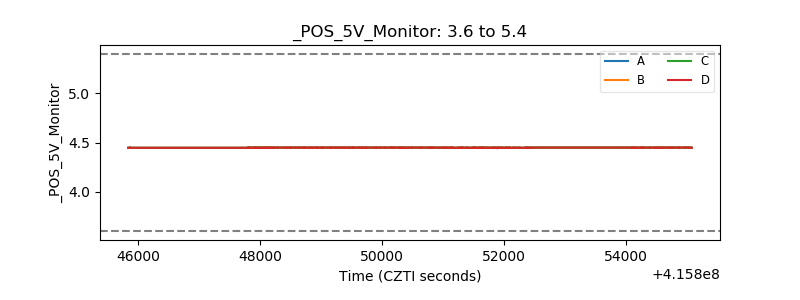 |
| _ROLL_ROT | 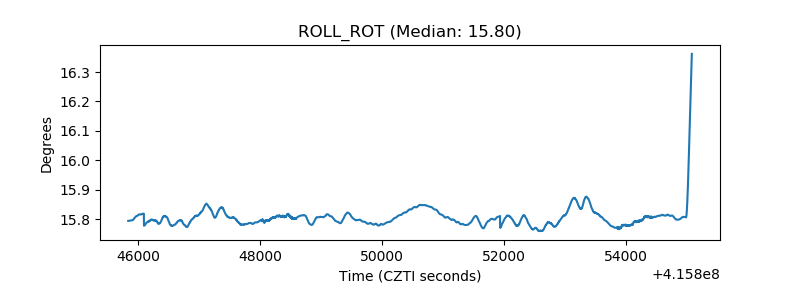 |
| _Roll_DEC | 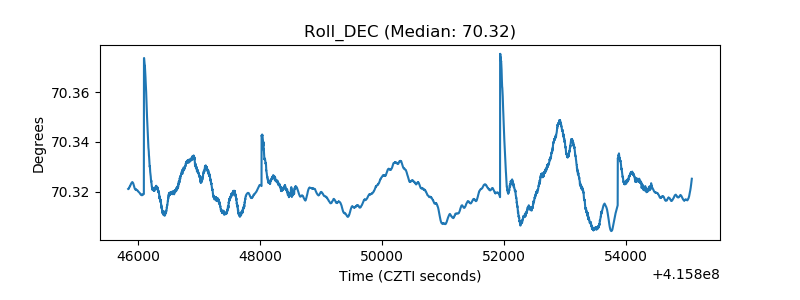 |
| _Roll_RA | 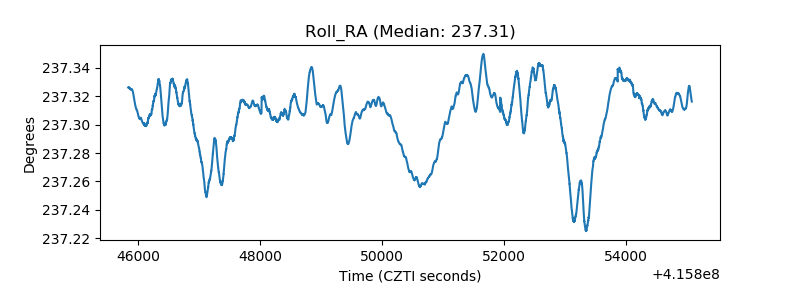 |
| Veto Counter | 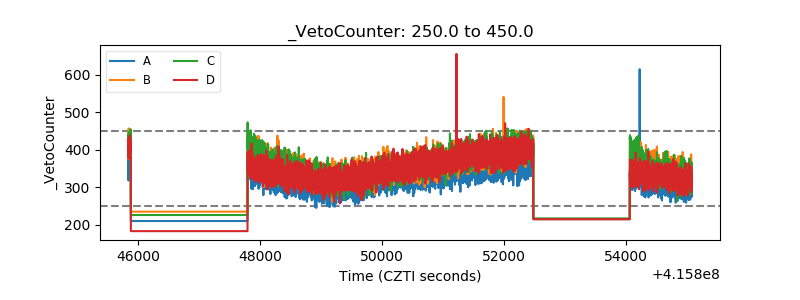 |