| Param | Original file | Final file |
|---|---|---|
| Filename | modeM0/AS1C07_001T01_9000005532_40219cztM0_level2.fits | modeM0/AS1C07_001T01_9000005532_40219cztM0_level2_quad_clean.evt |
| Size (bytes) | 427,783,680 | 90,982,080 |
| Size | 408.0 MB | 86.8 MB |
| Events in quadrant A | 4,528,805 | 579,345 |
| Events in quadrant B | 2,678,850 | 646,606 |
| Events in quadrant C | 2,812,936 | 629,539 |
| Events in quadrant D | 5,358,554 | 490,139 |
| Mode M0 | |||
|---|---|---|---|
| Quadrant | BADHDUFLAG | Total packets | Discarded packets |
| A | 0 | 17176 | 3 |
| B | 0 | 12188 | 2 |
| C | 0 | 12200 | 2 |
| D | 0 | 20053 | 2 |
| Mode M9 | |||
|---|---|---|---|
| Quadrant | BADHDUFLAG | Total packets | Discarded packets |
| A | 0 | 18 | 0 |
| B | 0 | 18 | 0 |
| C | 0 | 18 | 0 |
| D | 0 | 19 | 0 |
| Mode SS | |||
|---|---|---|---|
| Quadrant | BADHDUFLAG | Total packets | Discarded packets |
| A | 0 | 118 | 0 |
| B | 0 | 118 | 0 |
| C | 0 | 118 | 0 |
| D | 0 | 118 | 0 |
| Quadrant | Total seconds | Saturated seconds | Saturation percentage |
|---|---|---|---|
| A | 5857 | 561 | 9.578282% |
| B | 5857 | 26 | 0.443913% |
| C | 5857 | 16 | 0.273177% |
| D | 5857 | 929 | 15.861362% |
Noise dominated data is calculated using 1-second bins in cleaned event files. If a bin has >2000 counts, and if more than 50% of those come from <1% of pixels, then it is considered to be noise-dominated and hence unusable.
| Quadrant | # 1 sec bins | Bins with >0 counts | Bins with >2000 counts | High rate bins dominated by noise | Noise dominated (total time) | Noise dominated (detector-on time) | Marked lightcurve |
|---|---|---|---|---|---|---|---|
| A | 7229 | 5858 | 392 | 392 | 5.42% | 6.69% | 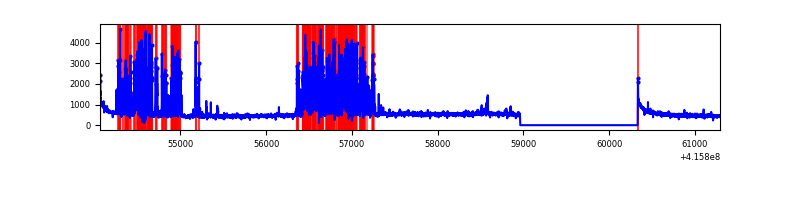 |
| B | 7229 | 5858 | 11 | 11 | 0.15% | 0.19% | 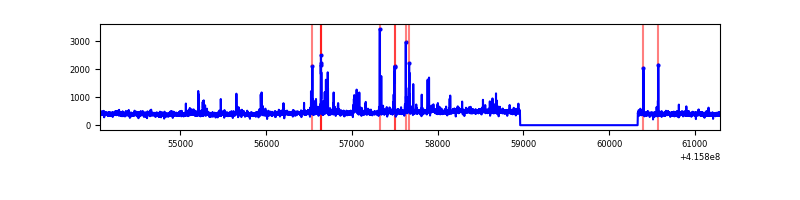 |
| C | 7229 | 5858 | 7 | 7 | 0.10% | 0.12% | 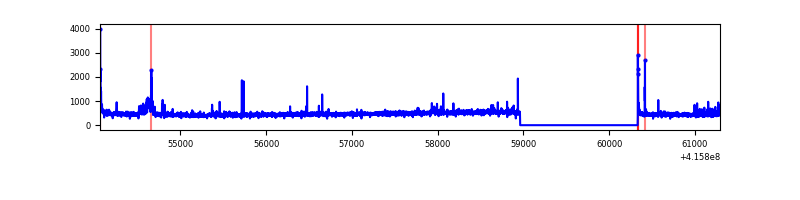 |
| D | 7229 | 5858 | 771 | 771 | 10.67% | 13.16% | 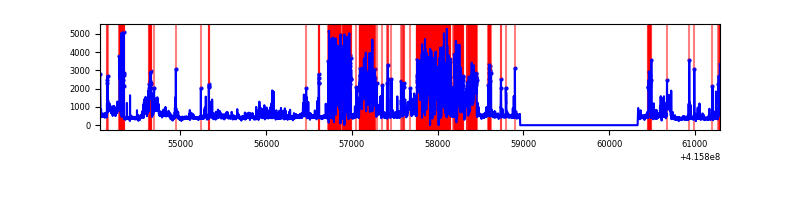 |
Top three noisy pixels from each quadrant. If the there are fewer than three noisy pixels in the level2.evt file, extra rows are filled as -1
| Pixel properties | Quadrant properties | ||||||
|---|---|---|---|---|---|---|---|
| Quadrant | DetID | PixID | Counts | Sigma | Mean | Median | Sigma |
| A | 13 | 248 | 1610433 | 13153.75 | 598 | 585 | 122.4 |
| A | 10 | 83 | 489402 | 3994.03 | 598 | 585 | 122.4 |
| A | 2 | 79 | 85976 | 697.71 | 598 | 585 | 122.4 |
| B | 0 | 245 | 122049 | 1013.33 | 620 | 602 | 119.8 |
| B | 5 | 255 | 32898 | 269.47 | 620 | 602 | 119.8 |
| B | 0 | 229 | 32253 | 264.09 | 620 | 602 | 119.8 |
| C | 15 | 214 | 251292 | 1769.55 | 610 | 613 | 141.7 |
| C | 9 | 187 | 103944 | 729.42 | 610 | 613 | 141.7 |
| C | 0 | 10 | 32176 | 222.8 | 610 | 613 | 141.7 |
| D | 12 | 227 | 2059905 | 15259.84 | 553 | 535 | 135.0 |
| D | 12 | 233 | 648470 | 4801.17 | 553 | 535 | 135.0 |
| D | 12 | 79 | 184676 | 1364.48 | 553 | 535 | 135.0 |
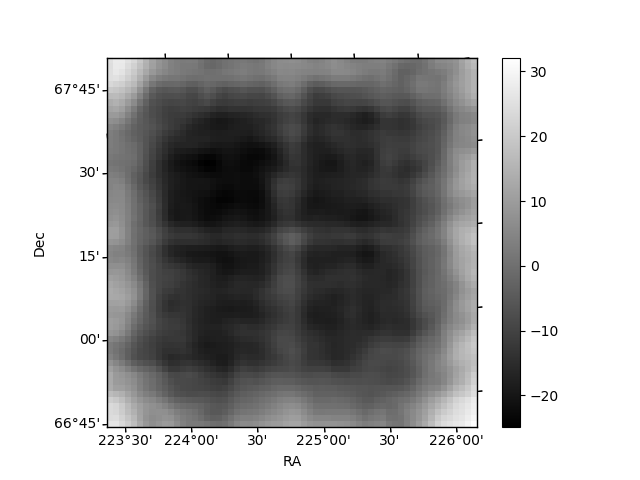
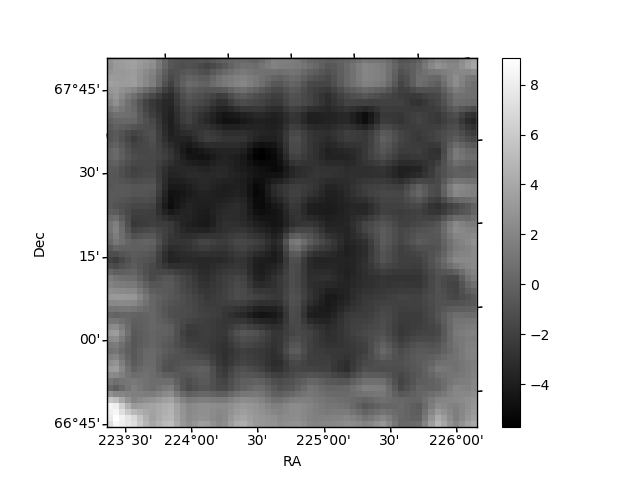
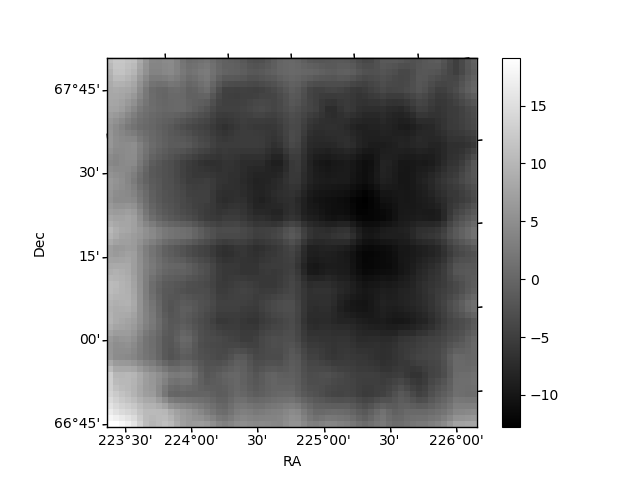
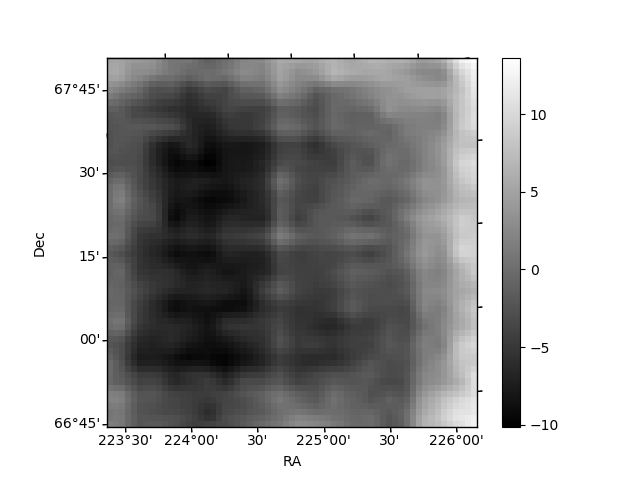
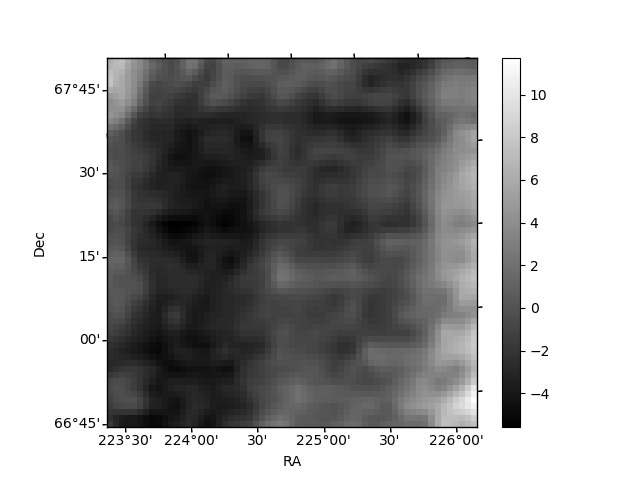
Histogram calculated using DETX and DETY for each event in the final _common_clean file
| Quadrant A | 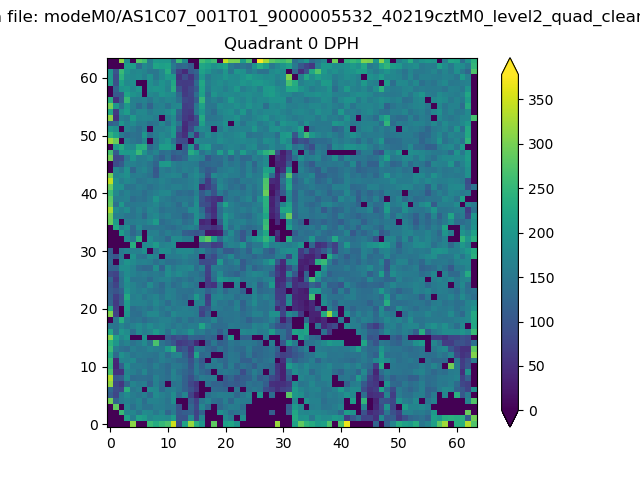 |
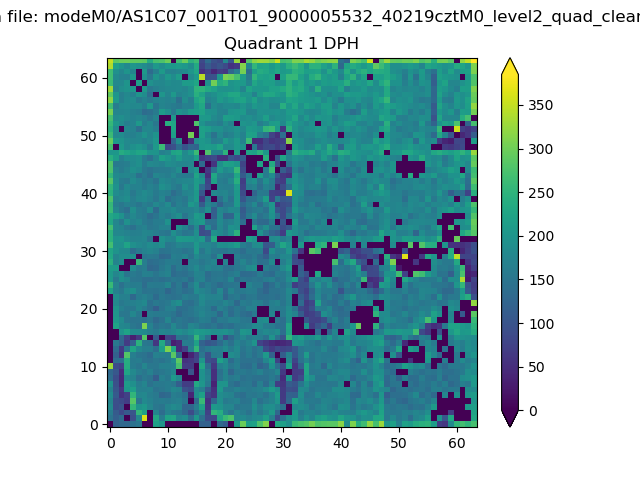 |
Quadrant B |
|---|---|---|---|
| Quadrant D |  |
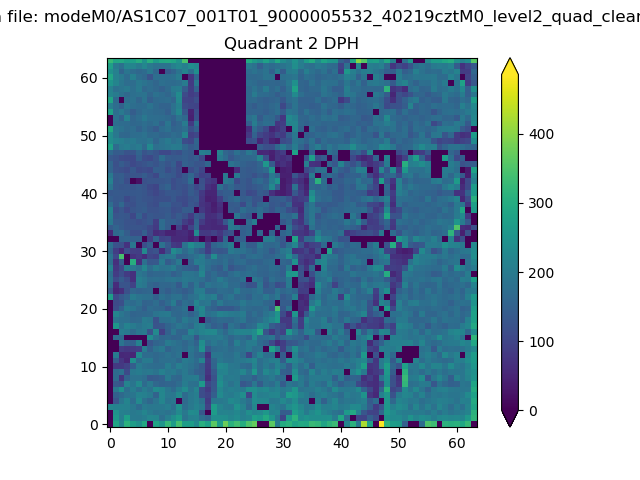 |
Quadrant C |
| Plot type | Count rate plots | Images |
|---|---|---|
| Comparison with Poisson distribution Blue bars denote a histogram of data divided into 1 sec bins. Red curve is a Poisson curve with rate = median count rate of data. |
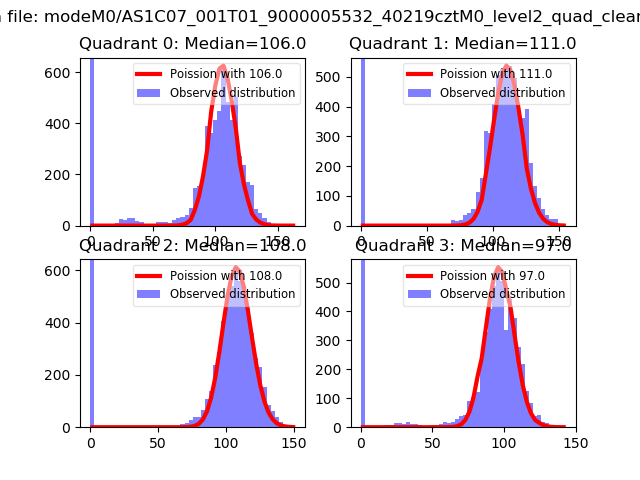 |
 |
| Quadrant-wise count rates Data is divided into 100 sec bins |
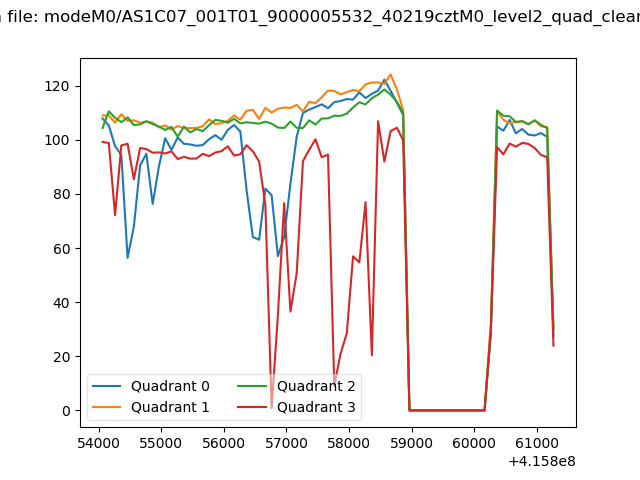 |
|
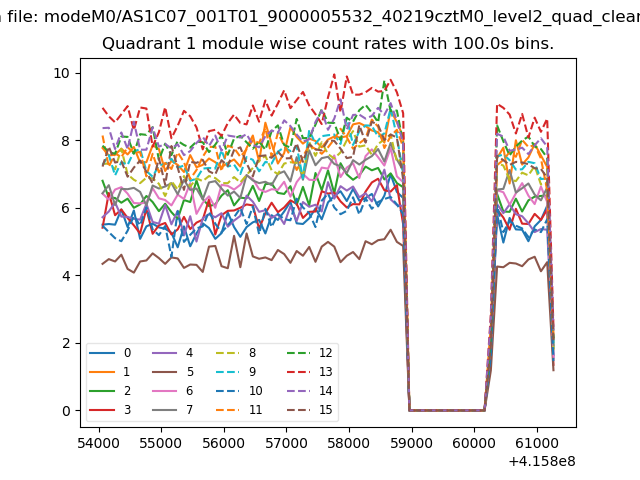
| Module-wise count rates for Quadrant A Data is divided into 100 sec bins |
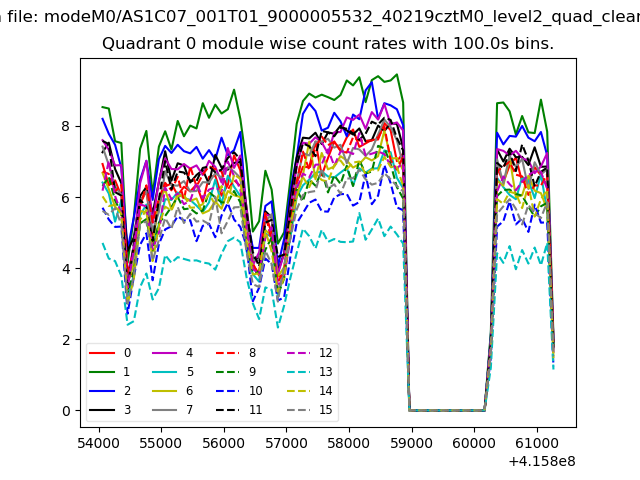 |
 |
| Module-wise count rates for Quadrant B Data is divided into 100 sec bins |
 |
 |
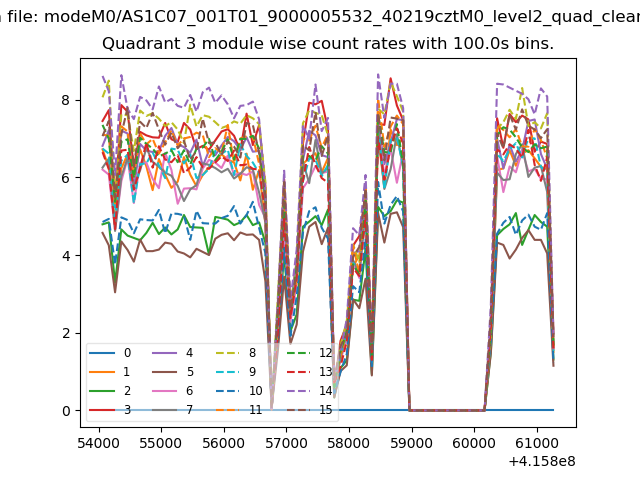
| Module-wise count rates for Quadrant C Data is divided into 100 sec bins |
 |
 |
| Module-wise count rates for Quadrant D Data is divided into 100 sec bins |
 |
 |
| Parameter | Plot |
|---|---|
| CZT HV Monitor | 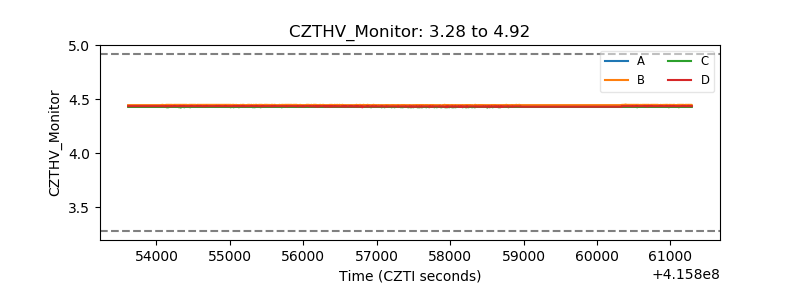 |
| D_VDD | 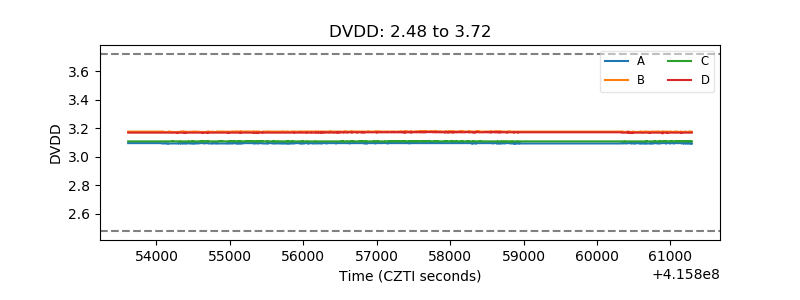 |
| Temperature 1 | 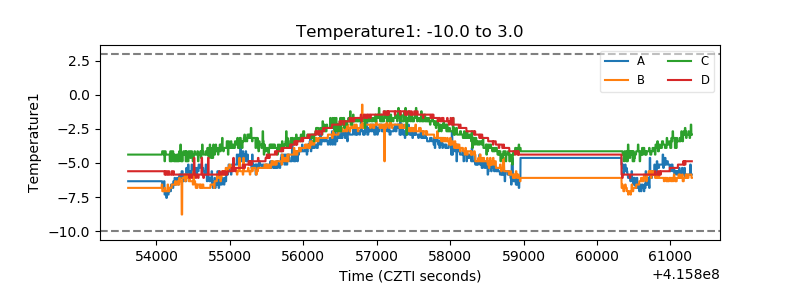 |
| Veto HV Monitor | 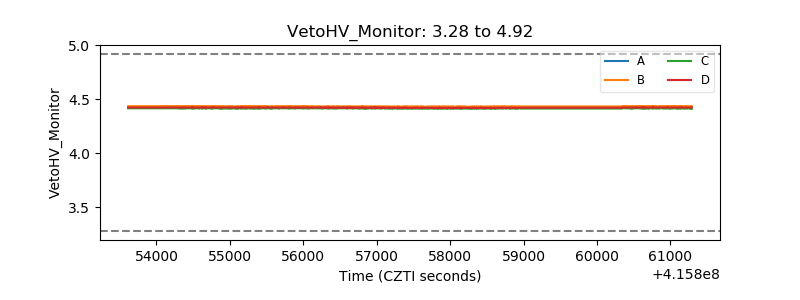 |
| Veto LLD | 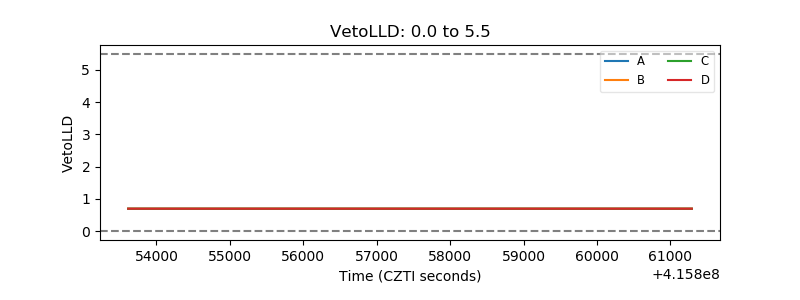 |
| Alpha Counter | 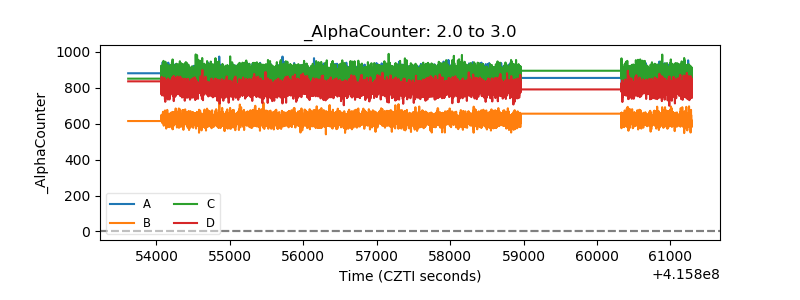 |
| _CPM_Rate | 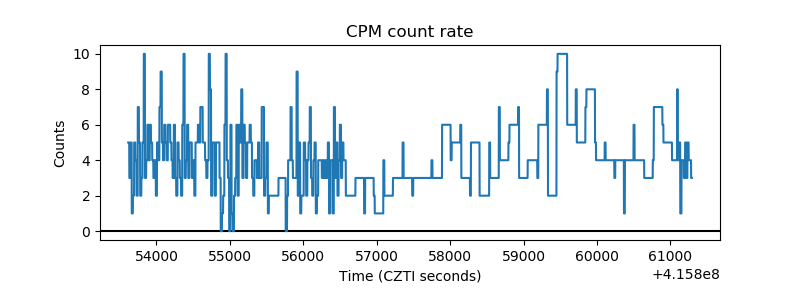 |
| CZT Counter | 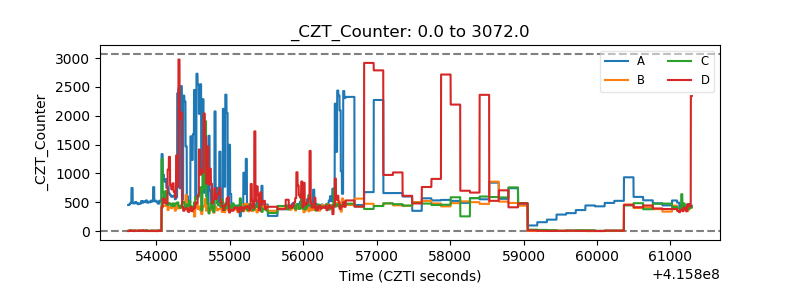 |
| +2.5 Volts monitor | 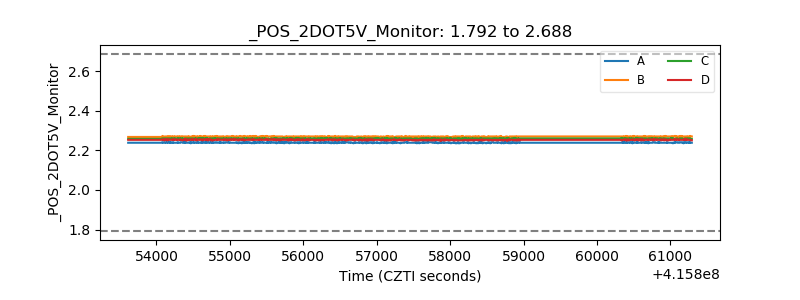 |
| +5 Volts monitor | 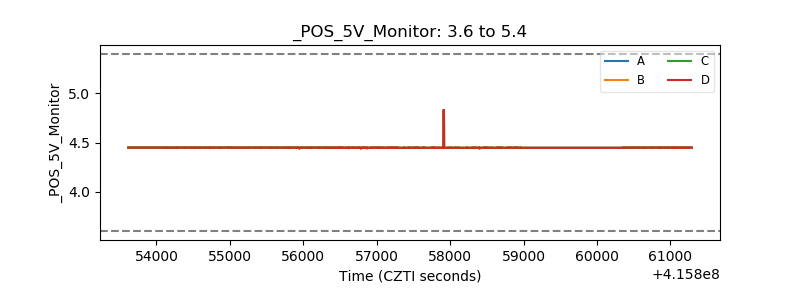 |
| _ROLL_ROT | 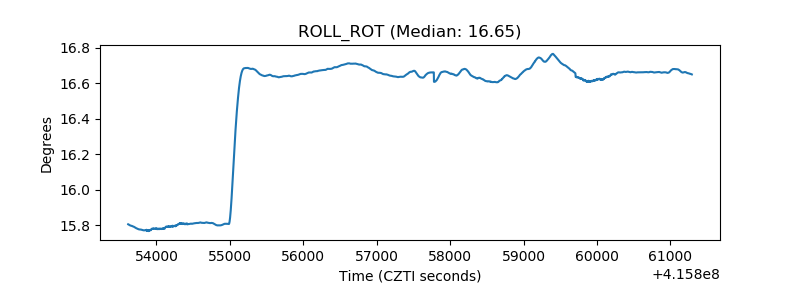 |
| _Roll_DEC | 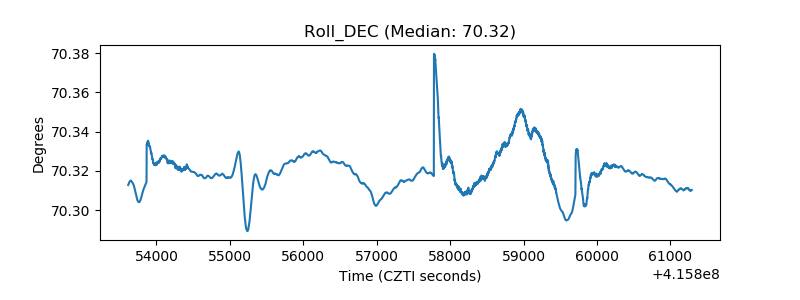 |
| _Roll_RA | 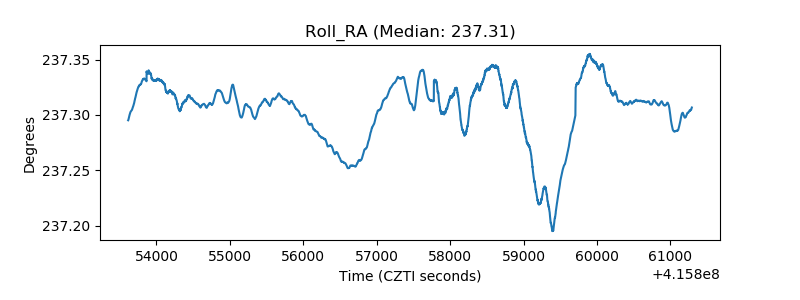 |
| Veto Counter | 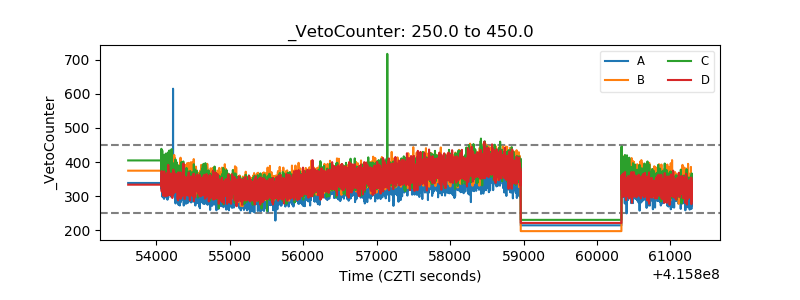 |