| Param | Original file | Final file |
|---|---|---|
| Filename | modeM0/AS1C07_001T01_9000005532_40222cztM0_level2.fits | modeM0/AS1C07_001T01_9000005532_40222cztM0_level2_quad_clean.evt |
| Size (bytes) | 679,164,480 | 152,461,440 |
| Size | 647.7 MB | 145.4 MB |
| Events in quadrant A | 5,233,698 | 1,032,313 |
| Events in quadrant B | 4,907,022 | 1,071,449 |
| Events in quadrant C | 4,730,976 | 1,027,601 |
| Events in quadrant D | 9,521,403 | 816,752 |
| Mode M0 | |||
|---|---|---|---|
| Quadrant | BADHDUFLAG | Total packets | Discarded packets |
| A | 0 | 21215 | 1 |
| B | 0 | 21156 | 1 |
| C | 0 | 20009 | 1 |
| D | 0 | 34909 | 1 |
| Mode M9 | |||
|---|---|---|---|
| Quadrant | BADHDUFLAG | Total packets | Discarded packets |
| A | 0 | 14 | 0 |
| B | 0 | 13 | 0 |
| C | 0 | 13 | 0 |
| D | 0 | 13 | 0 |
| Mode SS | |||
|---|---|---|---|
| Quadrant | BADHDUFLAG | Total packets | Discarded packets |
| A | 0 | 194 | 0 |
| B | 0 | 194 | 0 |
| C | 0 | 194 | 0 |
| D | 0 | 194 | 0 |
| Quadrant | Total seconds | Saturated seconds | Saturation percentage |
|---|---|---|---|
| A | 9637 | 90 | 0.933901% |
| B | 9637 | 41 | 0.425444% |
| C | 9637 | 38 | 0.394314% |
| D | 9637 | 1525 | 15.824427% |
Noise dominated data is calculated using 1-second bins in cleaned event files. If a bin has >2000 counts, and if more than 50% of those come from <1% of pixels, then it is considered to be noise-dominated and hence unusable.
| Quadrant | # 1 sec bins | Bins with >0 counts | Bins with >2000 counts | High rate bins dominated by noise | Noise dominated (total time) | Noise dominated (detector-on time) | Marked lightcurve |
|---|---|---|---|---|---|---|---|
| A | 10980 | 9638 | 54 | 54 | 0.49% | 0.56% | 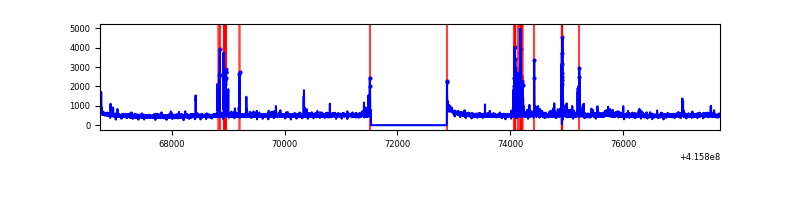 |
| B | 10980 | 9638 | 21 | 21 | 0.19% | 0.22% | 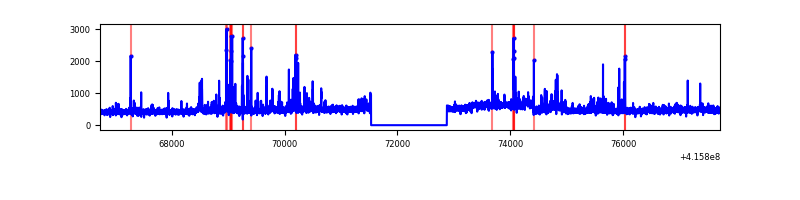 |
| C | 10980 | 9638 | 22 | 22 | 0.20% | 0.23% | 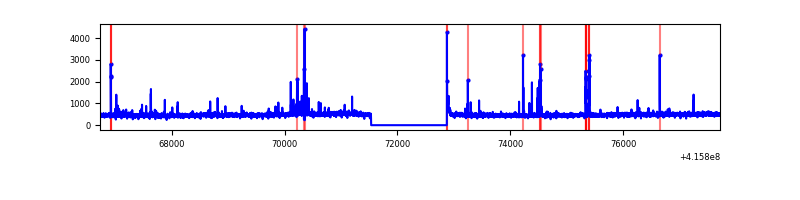 |
| D | 10980 | 9638 | 1261 | 1261 | 11.48% | 13.08% | 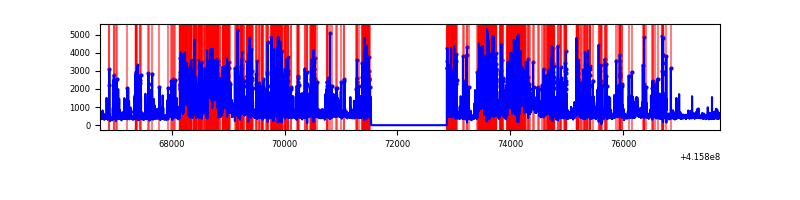 |
Top three noisy pixels from each quadrant. If the there are fewer than three noisy pixels in the level2.evt file, extra rows are filled as -1
| Pixel properties | Quadrant properties | ||||||
|---|---|---|---|---|---|---|---|
| Quadrant | DetID | PixID | Counts | Sigma | Mean | Median | Sigma |
| A | 10 | 83 | 660537 | 3093.41 | 1046 | 1022 | 213.2 |
| A | 13 | 248 | 271747 | 1269.82 | 1046 | 1022 | 213.2 |
| A | 6 | 10 | 195890 | 914.02 | 1046 | 1022 | 213.2 |
| B | 7 | 202 | 306192 | 1505.28 | 1046 | 1018 | 202.7 |
| B | 5 | 255 | 179510 | 880.42 | 1046 | 1018 | 202.7 |
| B | 0 | 229 | 103390 | 504.95 | 1046 | 1018 | 202.7 |
| C | 15 | 214 | 403797 | 1685.92 | 1031 | 1039 | 238.9 |
| C | 14 | 254 | 108789 | 451.04 | 1031 | 1039 | 238.9 |
| C | 4 | 254 | 63824 | 262.81 | 1031 | 1039 | 238.9 |
| D | 12 | 227 | 4340875 | 18548.47 | 953 | 924 | 234.0 |
| D | 12 | 233 | 701741 | 2995.21 | 953 | 924 | 234.0 |
| D | 13 | 249 | 502042 | 2141.72 | 953 | 924 | 234.0 |
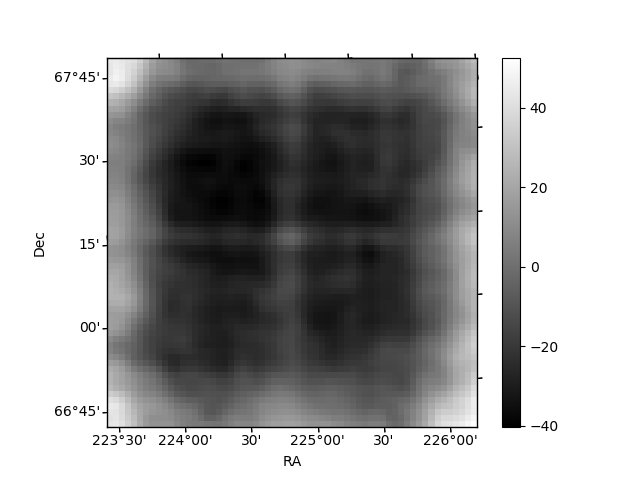
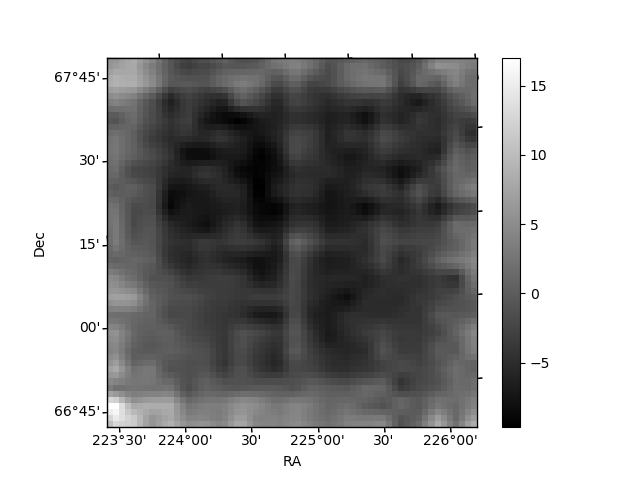
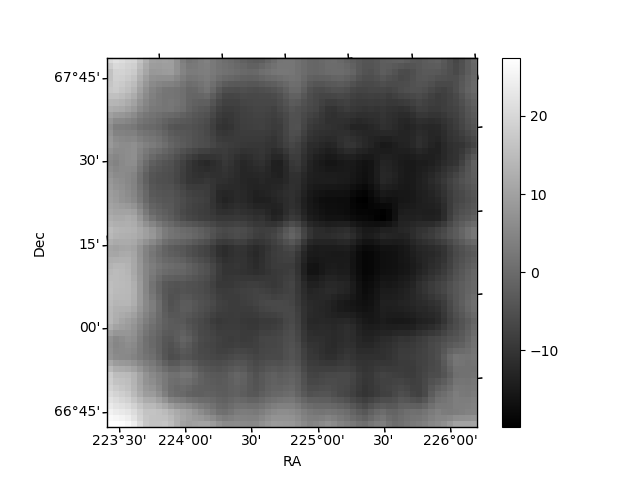
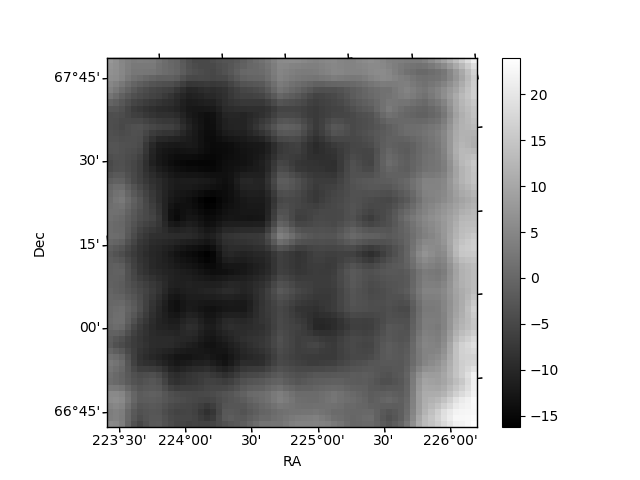
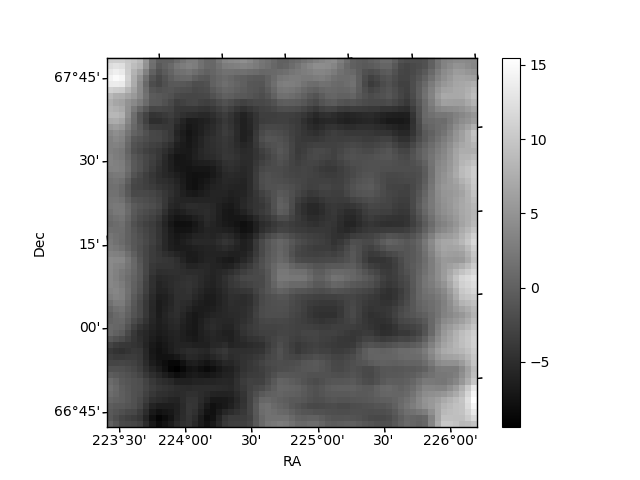
Histogram calculated using DETX and DETY for each event in the final _common_clean file
| Quadrant A | 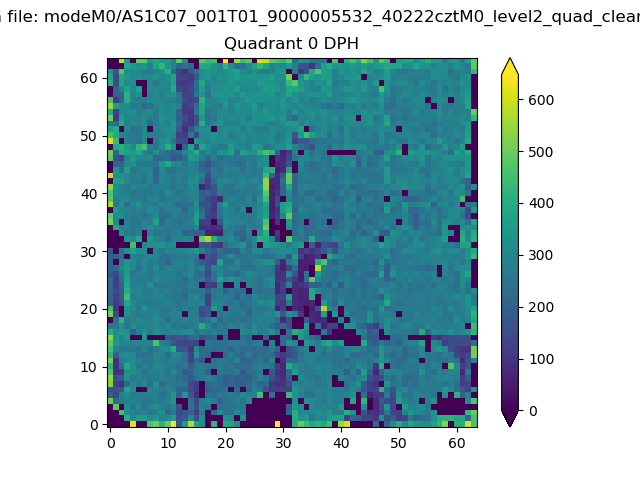 |
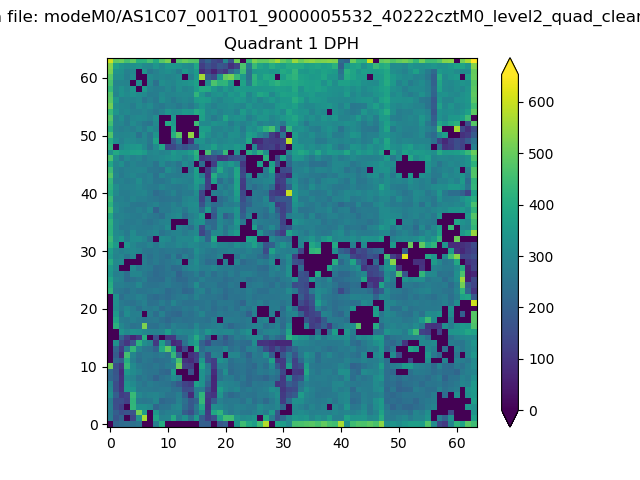 |
Quadrant B |
|---|---|---|---|
| Quadrant D | 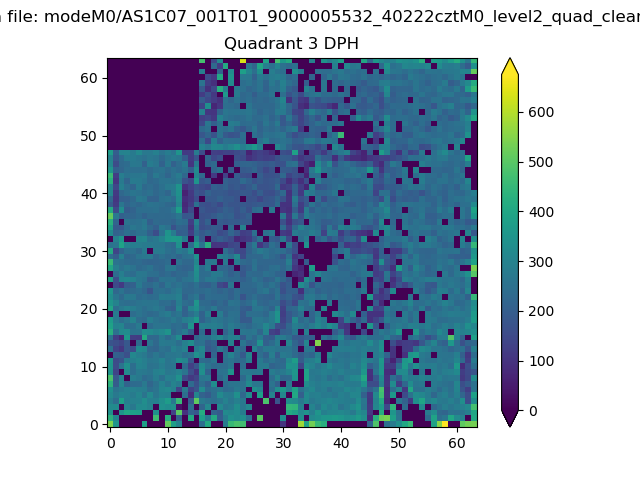 |
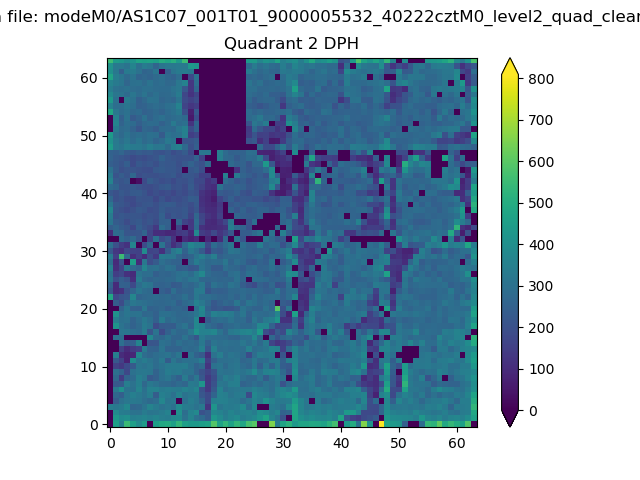 |
Quadrant C |
| Plot type | Count rate plots | Images |
|---|---|---|
| Comparison with Poisson distribution Blue bars denote a histogram of data divided into 1 sec bins. Red curve is a Poisson curve with rate = median count rate of data. |
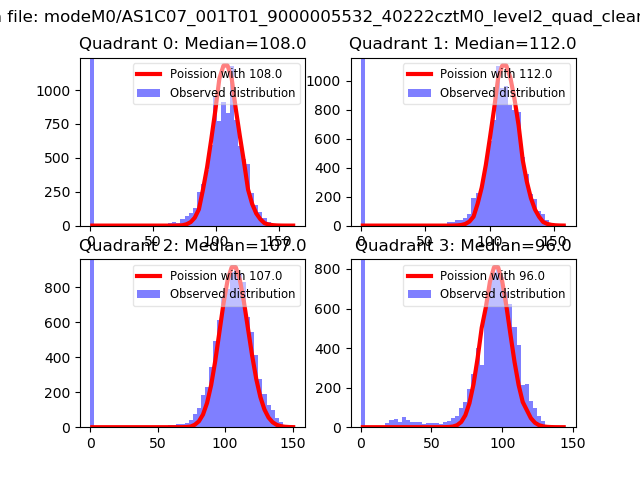 |
 |
| Quadrant-wise count rates Data is divided into 100 sec bins |
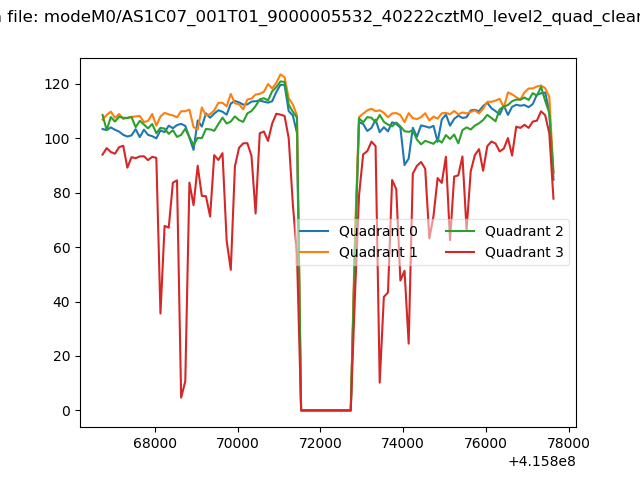 |
|
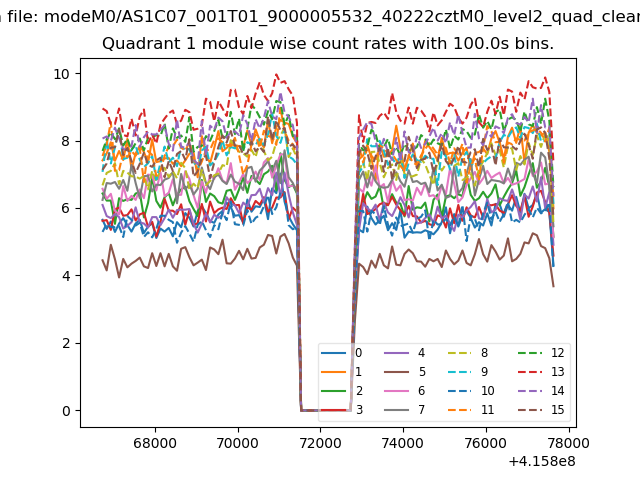
| Module-wise count rates for Quadrant A Data is divided into 100 sec bins |
 |
 |
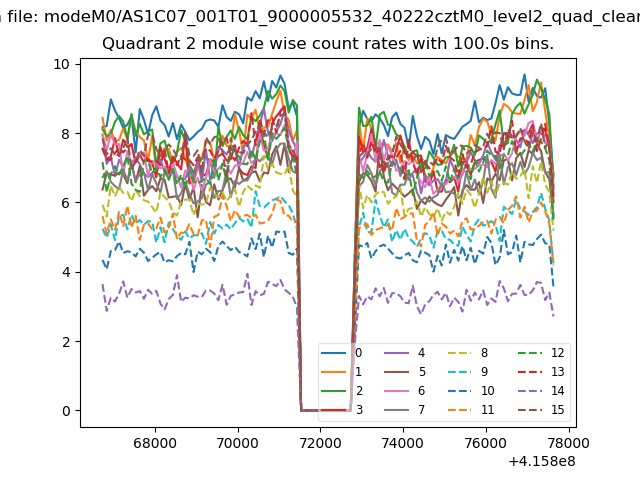
| Module-wise count rates for Quadrant B Data is divided into 100 sec bins |
 |
 |
| Module-wise count rates for Quadrant C Data is divided into 100 sec bins |
 |
 |
| Module-wise count rates for Quadrant D Data is divided into 100 sec bins |
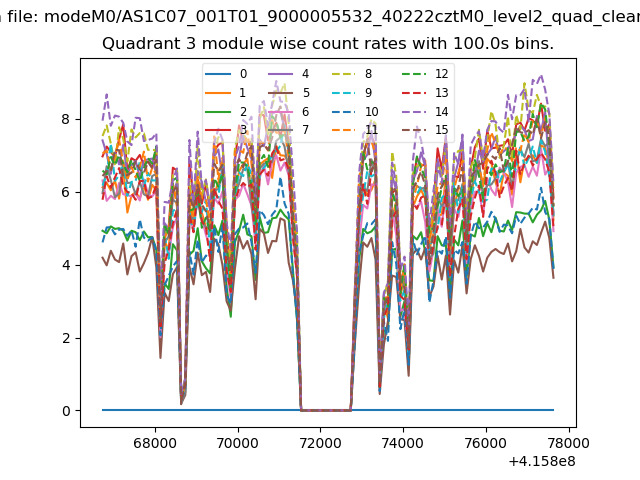 |
 |
| Parameter | Plot |
|---|---|
| CZT HV Monitor | 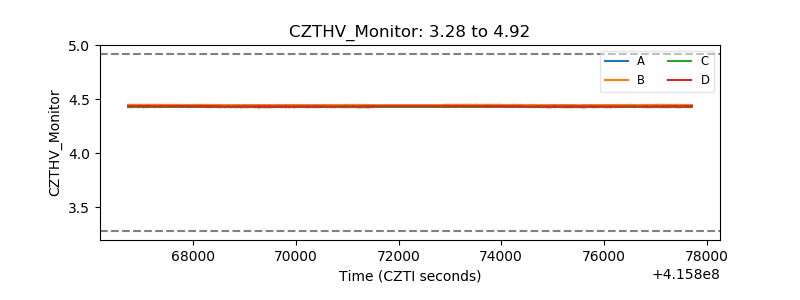 |
| D_VDD | 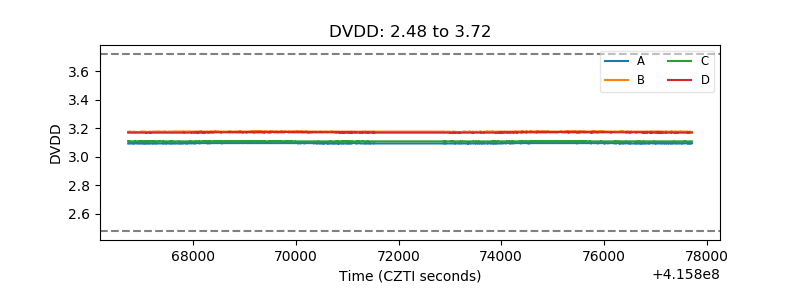 |
| Temperature 1 | 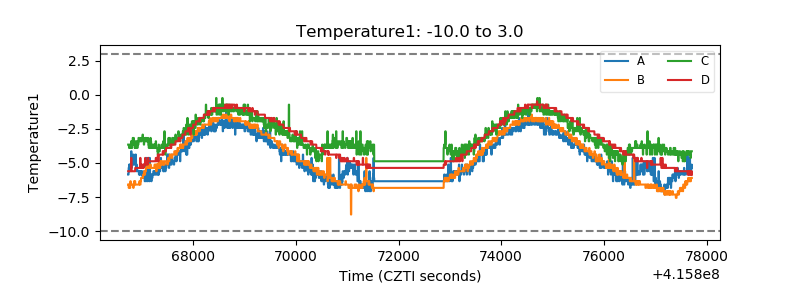 |
| Veto HV Monitor | 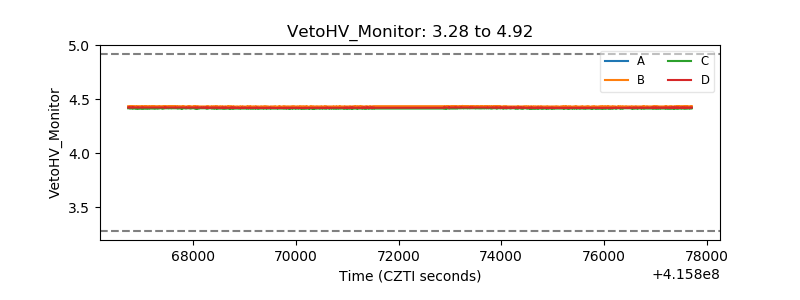 |
| Veto LLD | 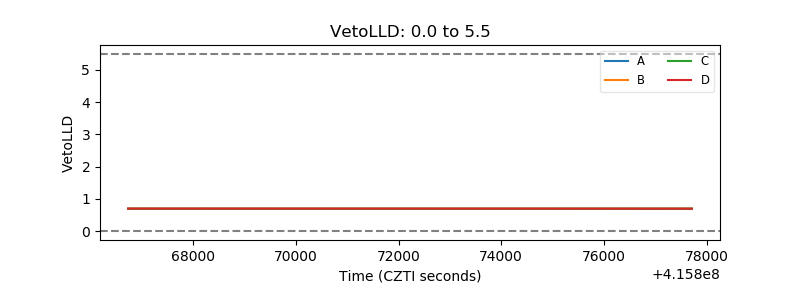 |
| Alpha Counter | 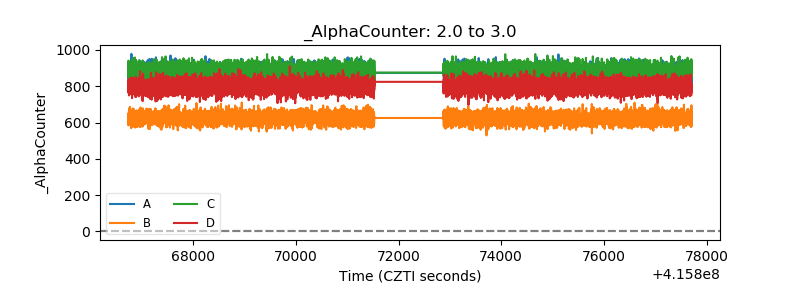 |
| _CPM_Rate | 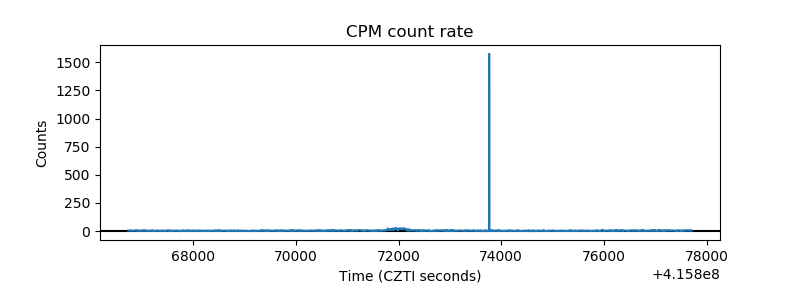 |
| CZT Counter | 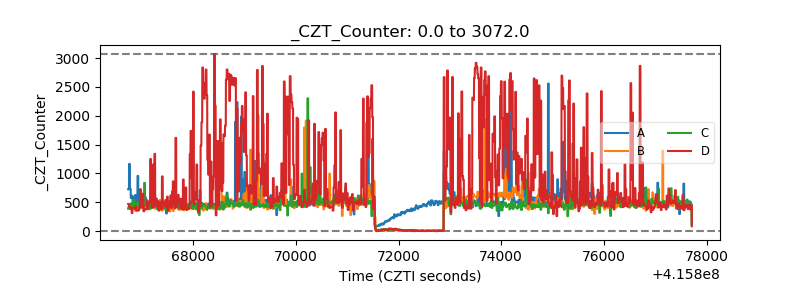 |
| +2.5 Volts monitor | 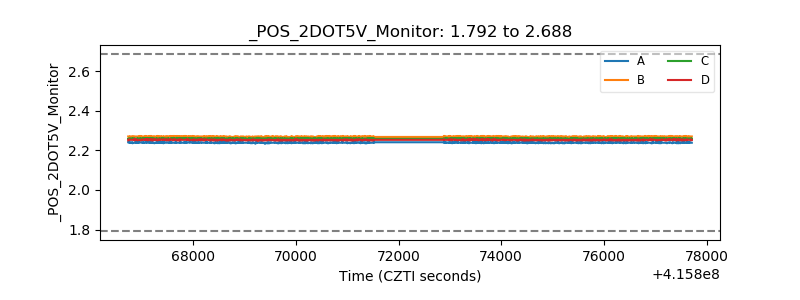 |
| +5 Volts monitor |  |
| _ROLL_ROT | 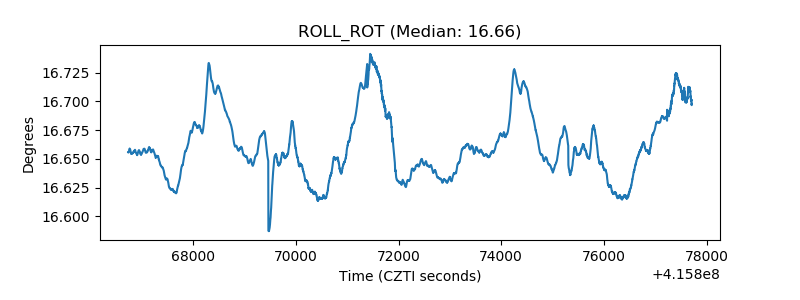 |
| _Roll_DEC | 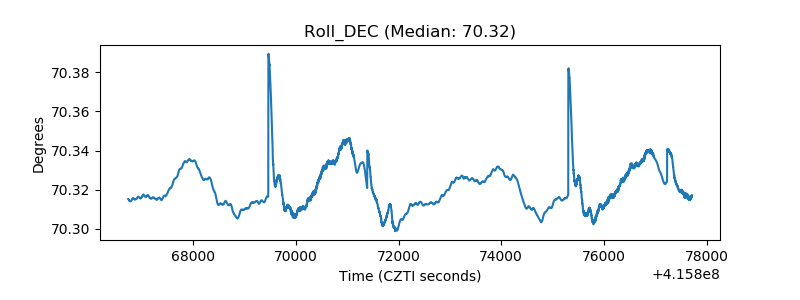 |
| _Roll_RA | 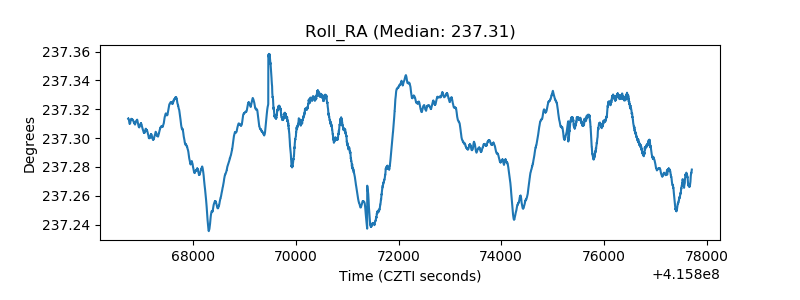 |
| Veto Counter | 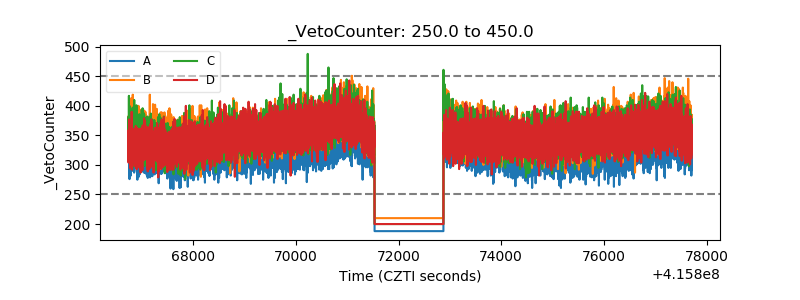 |