| Param | Original file | Final file |
|---|---|---|
| Filename | modeM0/AS1C07_001T01_9000005532_40223cztM0_level2.fits | modeM0/AS1C07_001T01_9000005532_40223cztM0_level2_quad_clean.evt |
| Size (bytes) | 392,235,840 | 103,570,560 |
| Size | 374.1 MB | 98.8 MB |
| Events in quadrant A | 4,065,707 | 676,833 |
| Events in quadrant B | 3,215,285 | 712,648 |
| Events in quadrant C | 3,247,777 | 683,231 |
| Events in quadrant D | 3,496,363 | 620,365 |
| Mode M0 | |||
|---|---|---|---|
| Quadrant | BADHDUFLAG | Total packets | Discarded packets |
| A | 0 | 16052 | 3 |
| B | 0 | 13734 | 2 |
| C | 0 | 13342 | 2 |
| D | 0 | 14748 | 2 |
| Mode M9 | |||
|---|---|---|---|
| Quadrant | BADHDUFLAG | Total packets | Discarded packets |
| A | 0 | 30 | 0 |
| B | 0 | 30 | 0 |
| C | 0 | 30 | 0 |
| D | 0 | 30 | 0 |
| Mode SS | |||
|---|---|---|---|
| Quadrant | BADHDUFLAG | Total packets | Discarded packets |
| A | 0 | 130 | 0 |
| B | 0 | 130 | 0 |
| C | 0 | 130 | 0 |
| D | 0 | 130 | 0 |
| Quadrant | Total seconds | Saturated seconds | Saturation percentage |
|---|---|---|---|
| A | 6350 | 205 | 3.228346% |
| B | 6350 | 53 | 0.834646% |
| C | 6350 | 21 | 0.330709% |
| D | 6350 | 134 | 2.110236% |
Noise dominated data is calculated using 1-second bins in cleaned event files. If a bin has >2000 counts, and if more than 50% of those come from <1% of pixels, then it is considered to be noise-dominated and hence unusable.
| Quadrant | # 1 sec bins | Bins with >0 counts | Bins with >2000 counts | High rate bins dominated by noise | Noise dominated (total time) | Noise dominated (detector-on time) | Marked lightcurve |
|---|---|---|---|---|---|---|---|
| A | 9276 | 6352 | 144 | 144 | 1.55% | 2.27% | 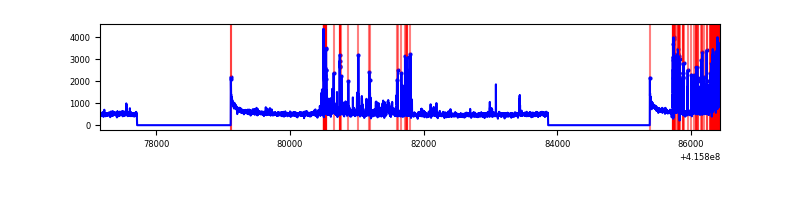 |
| B | 9276 | 6352 | 24 | 24 | 0.26% | 0.38% | 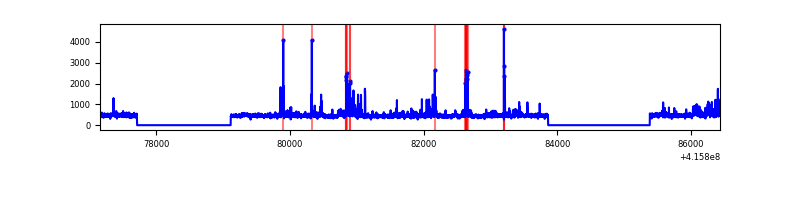 |
| C | 9276 | 6352 | 18 | 18 | 0.19% | 0.28% | 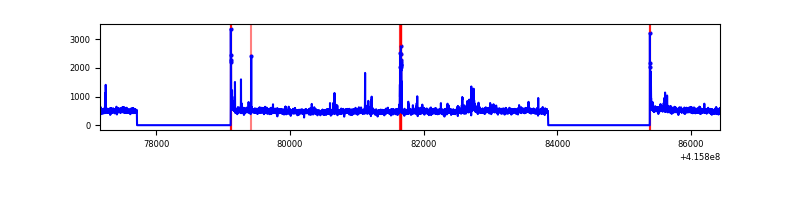 |
| D | 9276 | 6352 | 103 | 103 | 1.11% | 1.62% | 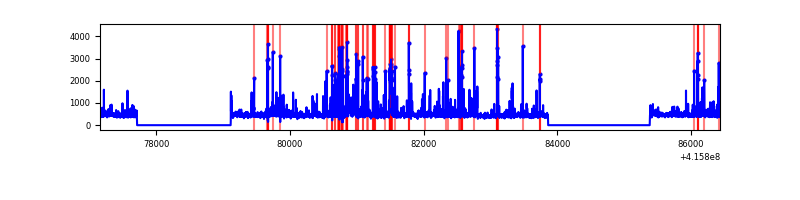 |
Top three noisy pixels from each quadrant. If the there are fewer than three noisy pixels in the level2.evt file, extra rows are filled as -1
| Pixel properties | Quadrant properties | ||||||
|---|---|---|---|---|---|---|---|
| Quadrant | DetID | PixID | Counts | Sigma | Mean | Median | Sigma |
| A | 13 | 248 | 715871 | 5010.47 | 693 | 677 | 142.7 |
| A | 10 | 83 | 524585 | 3670.37 | 693 | 677 | 142.7 |
| A | 6 | 10 | 129423 | 901.96 | 693 | 677 | 142.7 |
| B | 0 | 229 | 205464 | 1500.38 | 699 | 678 | 136.5 |
| B | 5 | 255 | 107836 | 785.1 | 699 | 678 | 136.5 |
| B | 0 | 245 | 82023 | 595.98 | 699 | 678 | 136.5 |
| C | 15 | 214 | 272339 | 1694.57 | 686 | 690 | 160.3 |
| C | 1 | 16 | 113271 | 702.29 | 686 | 690 | 160.3 |
| C | 14 | 254 | 104767 | 649.24 | 686 | 690 | 160.3 |
| D | 12 | 227 | 401681 | 2394.94 | 681 | 658 | 167.4 |
| D | 13 | 249 | 262714 | 1565.02 | 681 | 658 | 167.4 |
| D | 7 | 55 | 44932 | 264.41 | 681 | 658 | 167.4 |
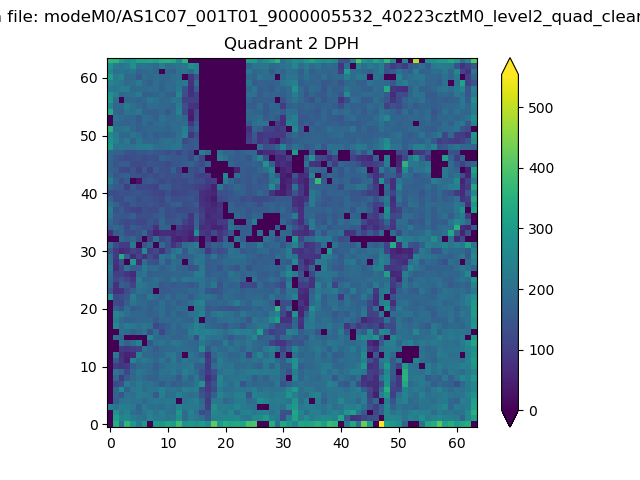
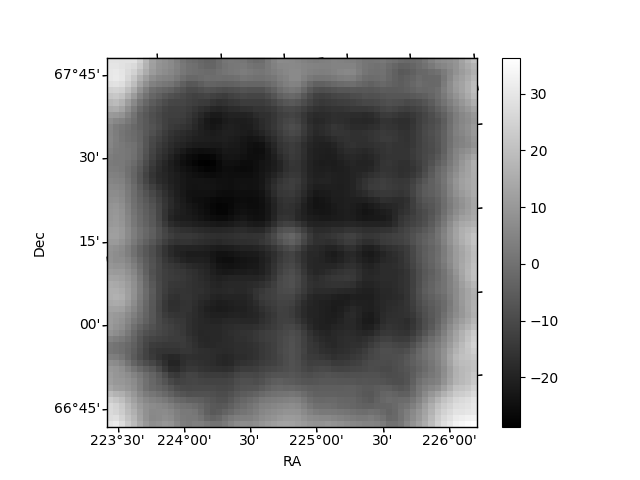
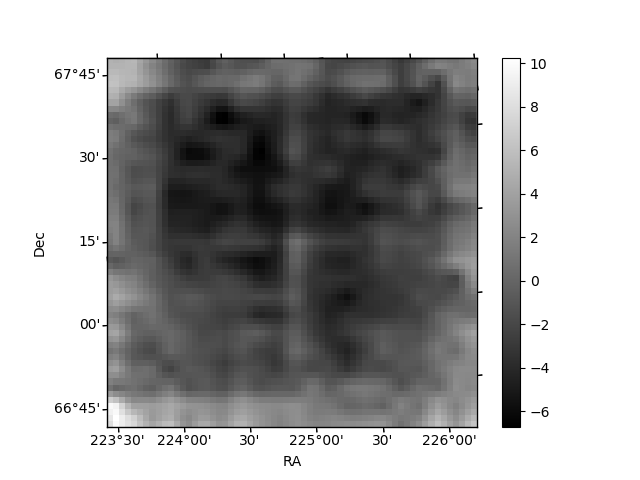
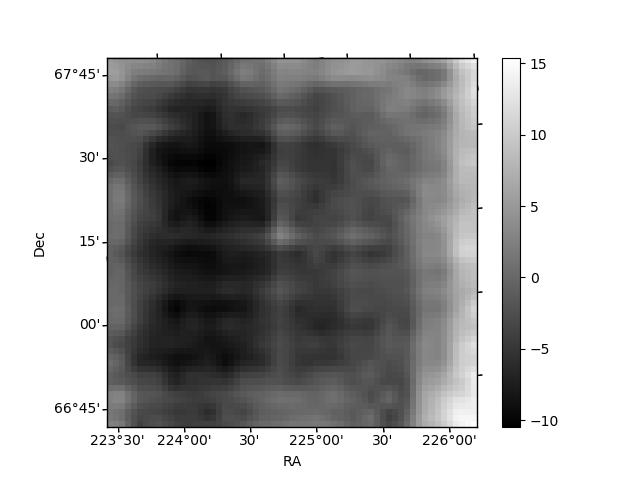
Histogram calculated using DETX and DETY for each event in the final _common_clean file
| Quadrant A | 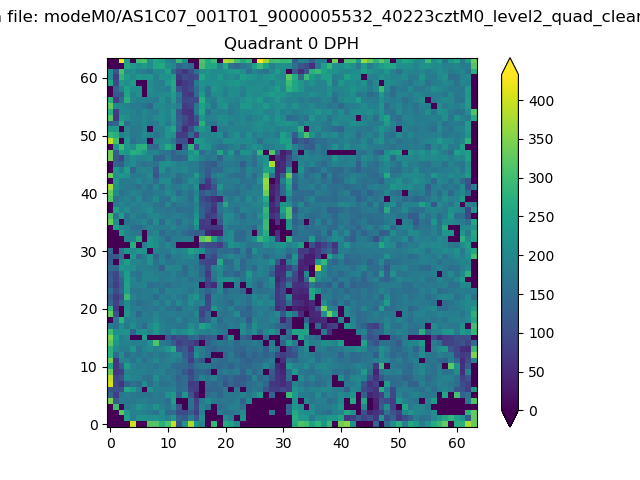 |
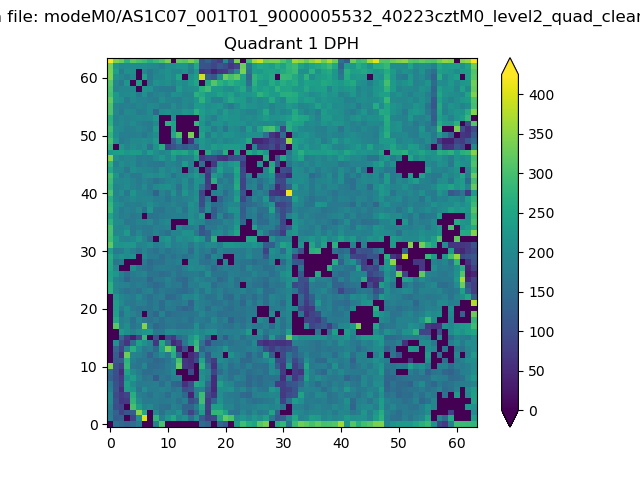 |
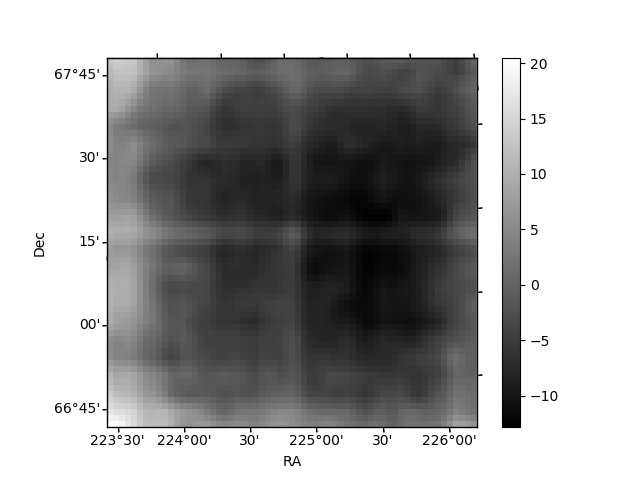
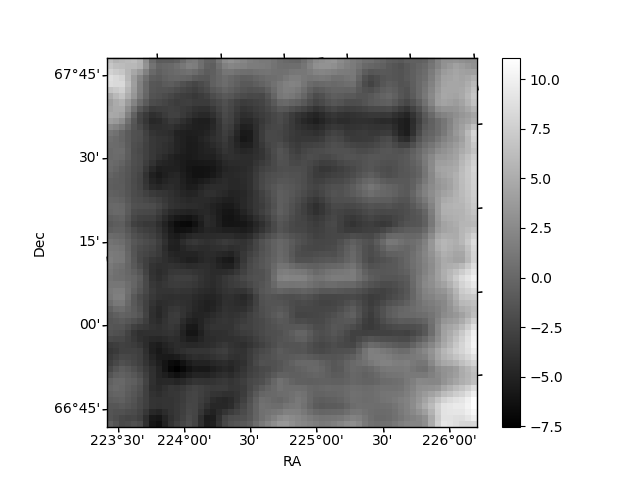
Quadrant B |
|---|---|---|---|
| Quadrant D | 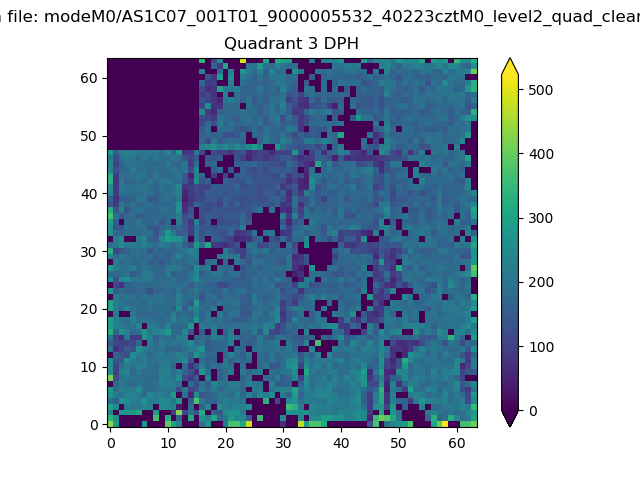 |
 |
Quadrant C |
| Plot type | Count rate plots | Images |
|---|---|---|
| Comparison with Poisson distribution Blue bars denote a histogram of data divided into 1 sec bins. Red curve is a Poisson curve with rate = median count rate of data. |
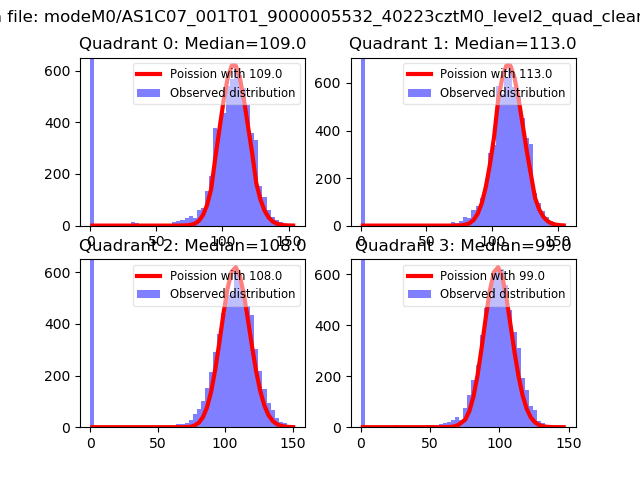 |
 |
| Quadrant-wise count rates Data is divided into 100 sec bins |
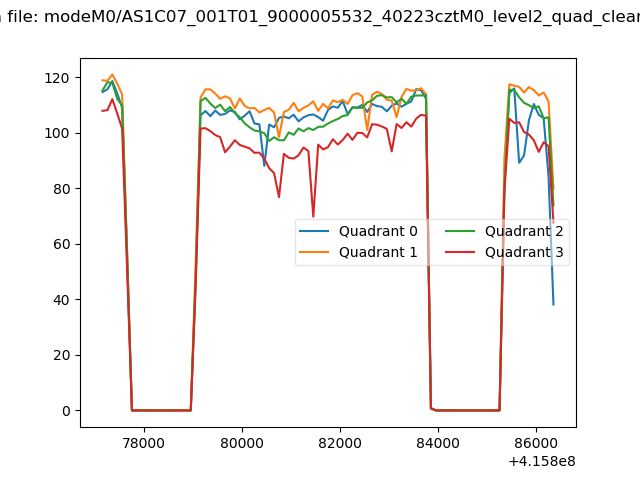 |
|
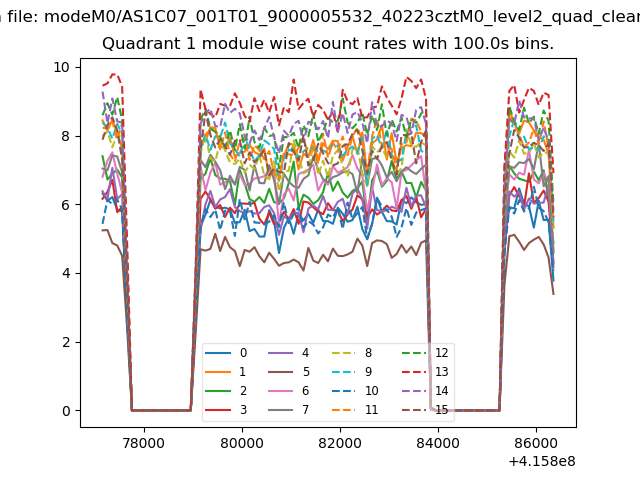
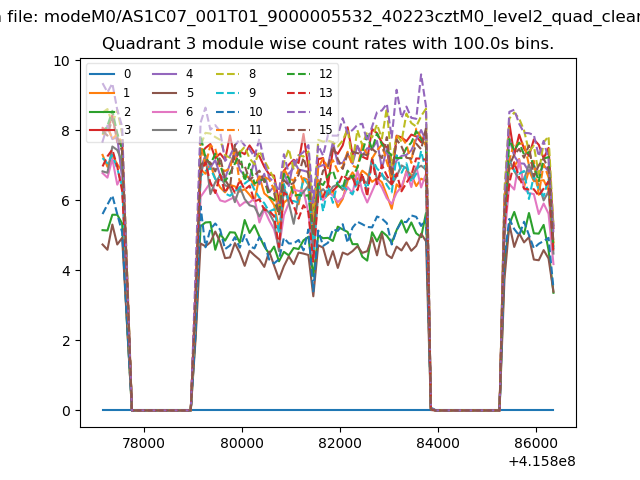
| Module-wise count rates for Quadrant A Data is divided into 100 sec bins |
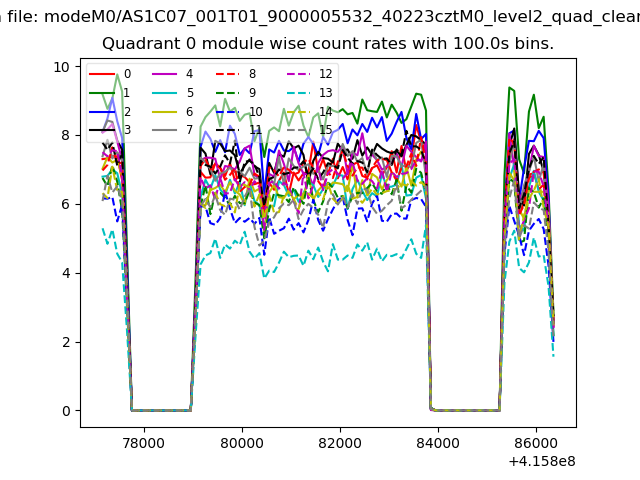 |
 |
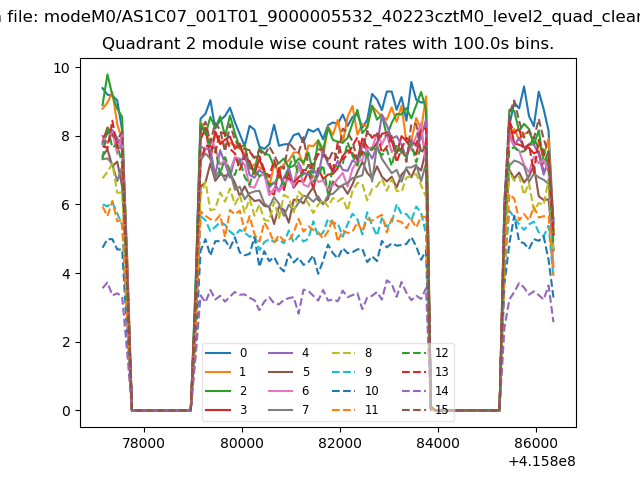
| Module-wise count rates for Quadrant B Data is divided into 100 sec bins |
 |
 |
| Module-wise count rates for Quadrant C Data is divided into 100 sec bins |
 |
 |
| Module-wise count rates for Quadrant D Data is divided into 100 sec bins |
 |
 |
| Parameter | Plot |
|---|---|
| CZT HV Monitor | 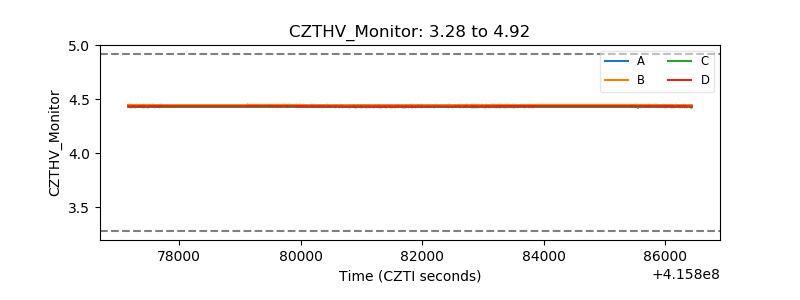 |
| D_VDD | 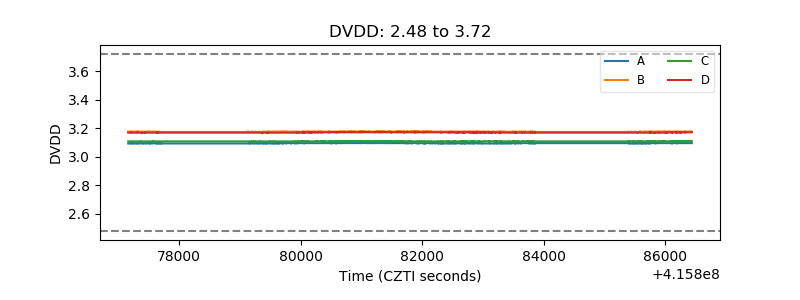 |
| Temperature 1 |  |
| Veto HV Monitor | 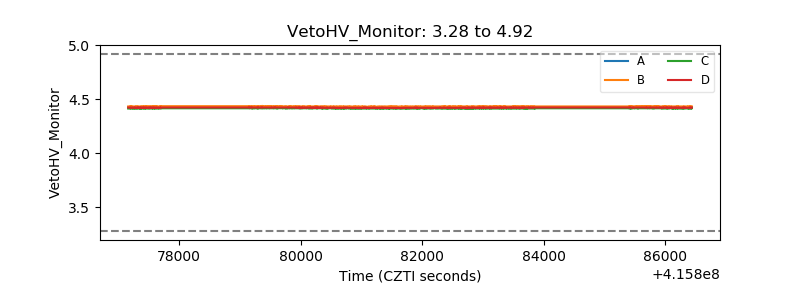 |
| Veto LLD | 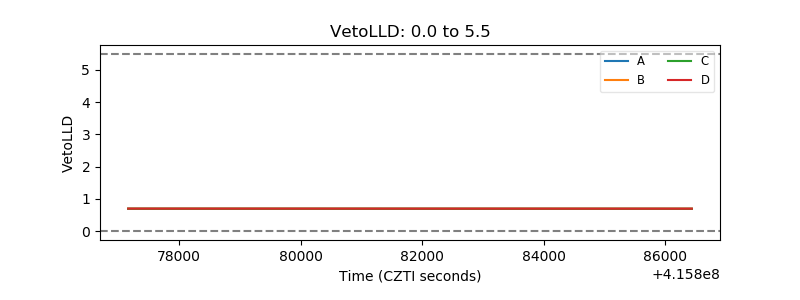 |
| Alpha Counter | 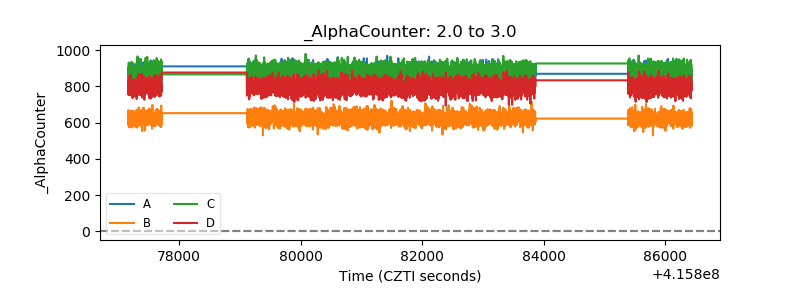 |
| _CPM_Rate | 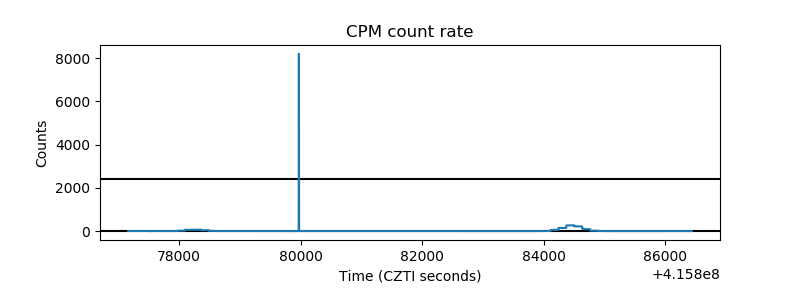 |
| CZT Counter | 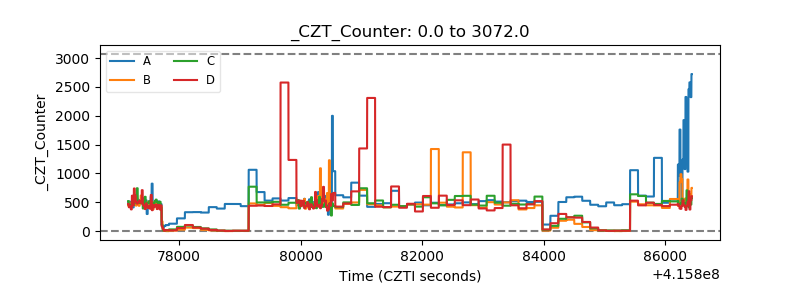 |
| +2.5 Volts monitor | 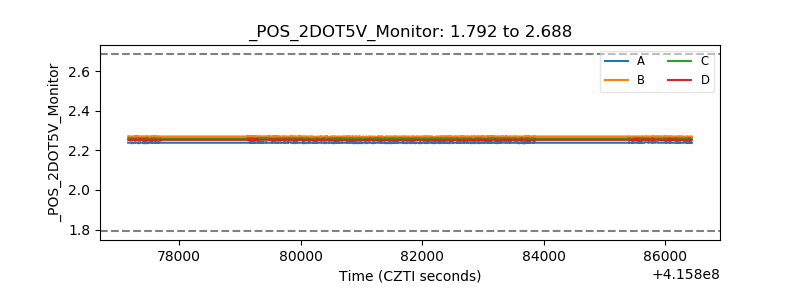 |
| +5 Volts monitor |  |
| _ROLL_ROT | 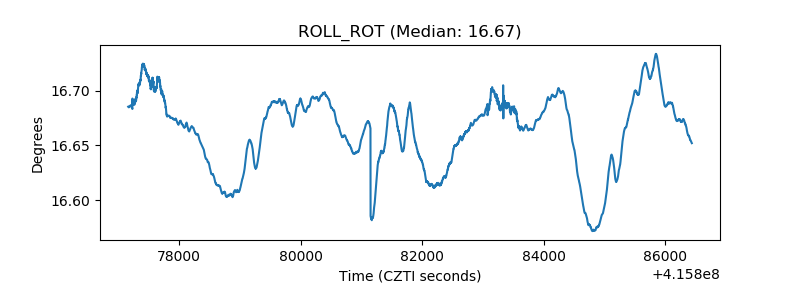 |
| _Roll_DEC | 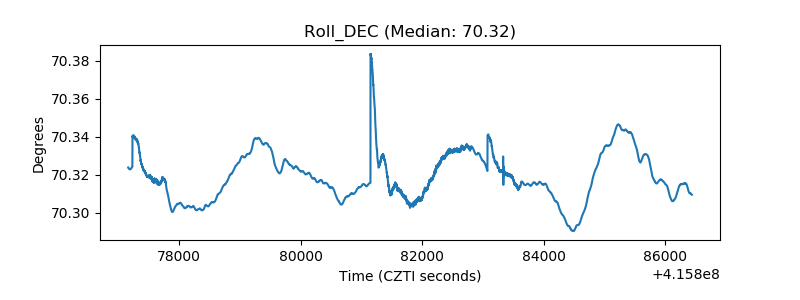 |
| _Roll_RA | 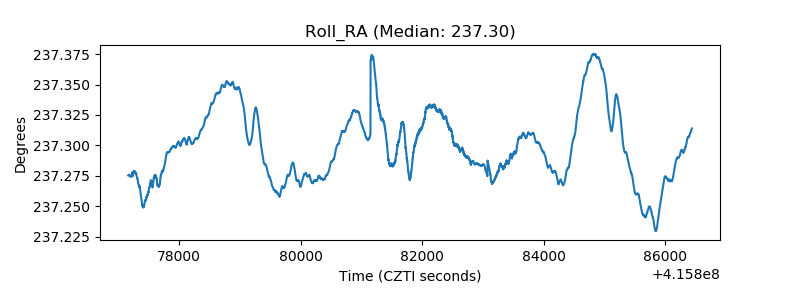 |
| Veto Counter | 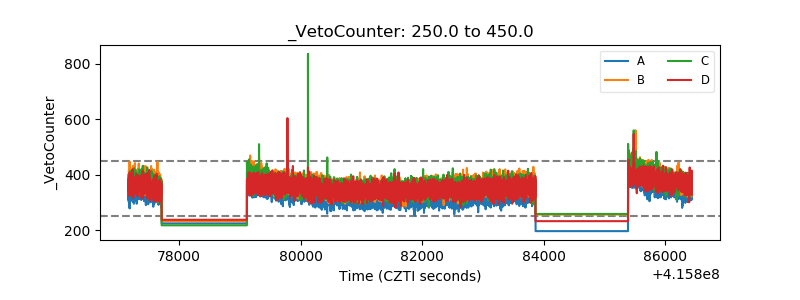 |