| Param | Original file | Final file |
|---|---|---|
| Filename | modeM0/AS1C07_001T01_9000005532_40224cztM0_level2.fits | modeM0/AS1C07_001T01_9000005532_40224cztM0_level2_quad_clean.evt |
| Size (bytes) | 375,258,240 | 92,324,160 |
| Size | 357.9 MB | 88.0 MB |
| Events in quadrant A | 3,726,043 | 605,454 |
| Events in quadrant B | 3,065,479 | 635,838 |
| Events in quadrant C | 2,929,826 | 610,301 |
| Events in quadrant D | 3,729,984 | 548,930 |
| Mode M0 | |||
|---|---|---|---|
| Quadrant | BADHDUFLAG | Total packets | Discarded packets |
| A | 0 | 14752 | 3 |
| B | 0 | 12830 | 2 |
| C | 0 | 11970 | 2 |
| D | 0 | 14946 | 2 |
| Mode M9 | |||
|---|---|---|---|
| Quadrant | BADHDUFLAG | Total packets | Discarded packets |
| A | 0 | 20 | 0 |
| B | 0 | 20 | 0 |
| C | 0 | 20 | 0 |
| D | 0 | 21 | 0 |
| Mode SS | |||
|---|---|---|---|
| Quadrant | BADHDUFLAG | Total packets | Discarded packets |
| A | 0 | 114 | 0 |
| B | 0 | 114 | 0 |
| C | 0 | 114 | 0 |
| D | 0 | 114 | 0 |
| Quadrant | Total seconds | Saturated seconds | Saturation percentage |
|---|---|---|---|
| A | 5648 | 257 | 4.550283% |
| B | 5648 | 102 | 1.805949% |
| C | 5648 | 27 | 0.478045% |
| D | 5648 | 233 | 4.125354% |
Noise dominated data is calculated using 1-second bins in cleaned event files. If a bin has >2000 counts, and if more than 50% of those come from <1% of pixels, then it is considered to be noise-dominated and hence unusable.
| Quadrant | # 1 sec bins | Bins with >0 counts | Bins with >2000 counts | High rate bins dominated by noise | Noise dominated (total time) | Noise dominated (detector-on time) | Marked lightcurve |
|---|---|---|---|---|---|---|---|
| A | 7320 | 5649 | 169 | 169 | 2.31% | 2.99% | 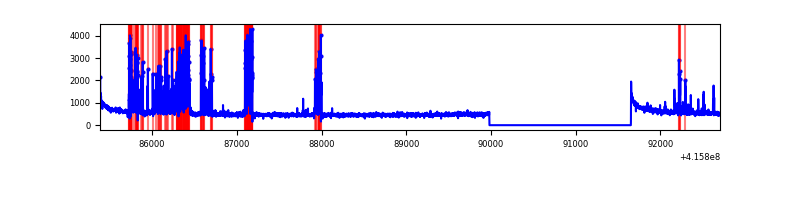 |
| B | 7320 | 5649 | 74 | 74 | 1.01% | 1.31% | 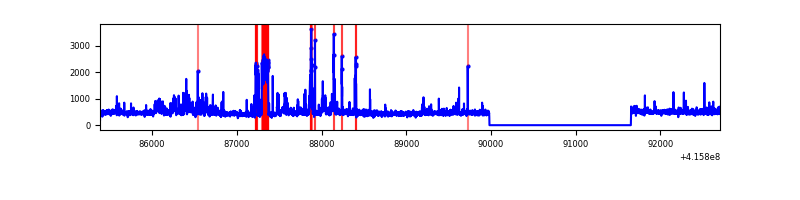 |
| C | 7320 | 5649 | 19 | 19 | 0.26% | 0.34% | 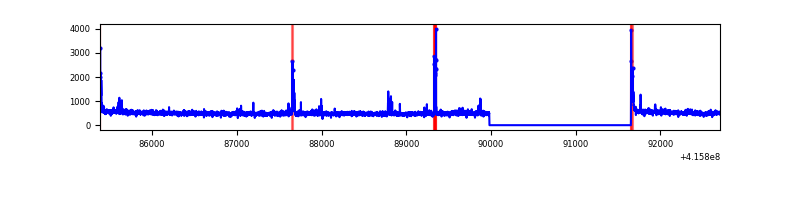 |
| D | 7320 | 5649 | 188 | 188 | 2.57% | 3.33% | 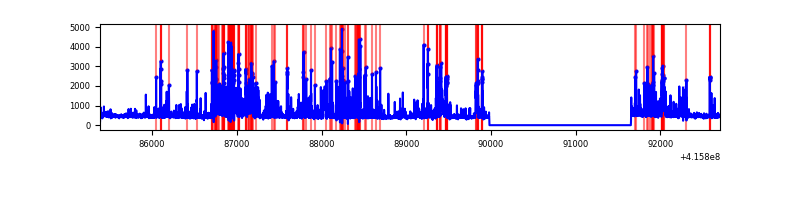 |
Top three noisy pixels from each quadrant. If the there are fewer than three noisy pixels in the level2.evt file, extra rows are filled as -1
| Pixel properties | Quadrant properties | ||||||
|---|---|---|---|---|---|---|---|
| Quadrant | DetID | PixID | Counts | Sigma | Mean | Median | Sigma |
| A | 13 | 248 | 852047 | 6667.58 | 615 | 601 | 127.7 |
| A | 10 | 83 | 491416 | 3843.52 | 615 | 601 | 127.7 |
| A | 3 | 137 | 6897 | 49.3 | 615 | 601 | 127.7 |
| B | 0 | 229 | 235226 | 1968.77 | 618 | 601 | 119.2 |
| B | 7 | 202 | 176112 | 1472.74 | 618 | 601 | 119.2 |
| B | 5 | 255 | 132439 | 1106.27 | 618 | 601 | 119.2 |
| C | 15 | 214 | 243182 | 1718.46 | 610 | 613 | 141.2 |
| C | 1 | 16 | 127165 | 896.55 | 610 | 613 | 141.2 |
| C | 0 | 10 | 56775 | 397.87 | 610 | 613 | 141.2 |
| D | 12 | 227 | 950876 | 6456.2 | 601 | 583 | 147.2 |
| D | 13 | 249 | 232317 | 1574.38 | 601 | 583 | 147.2 |
| D | 2 | 250 | 77493 | 522.52 | 601 | 583 | 147.2 |
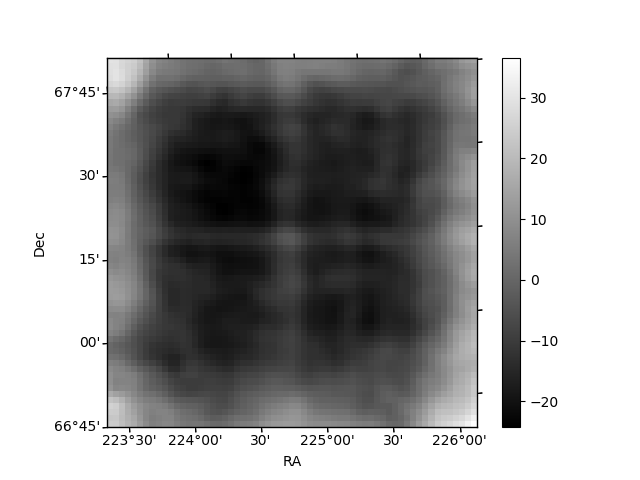
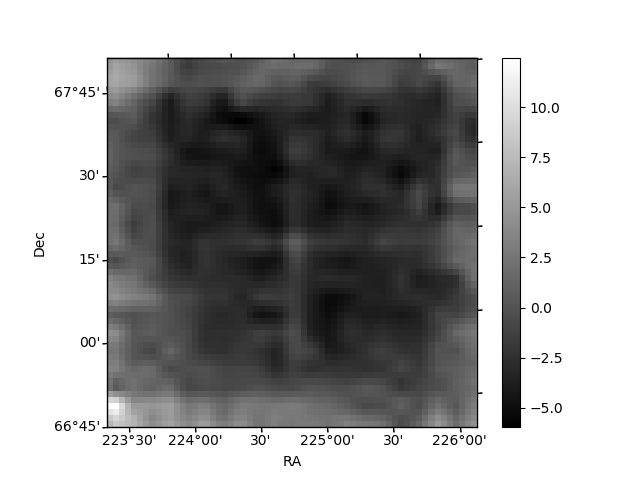
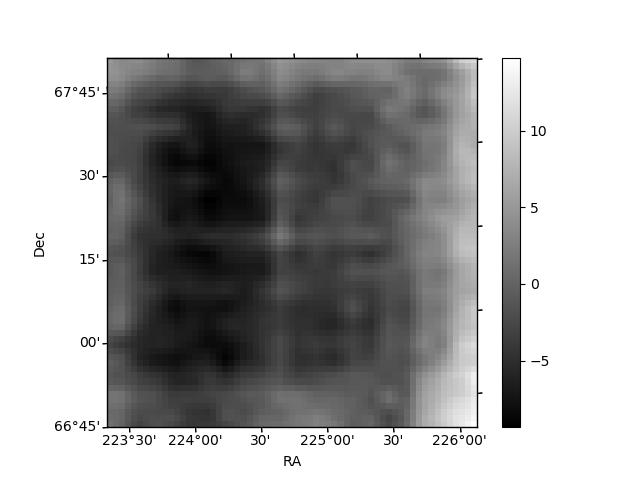
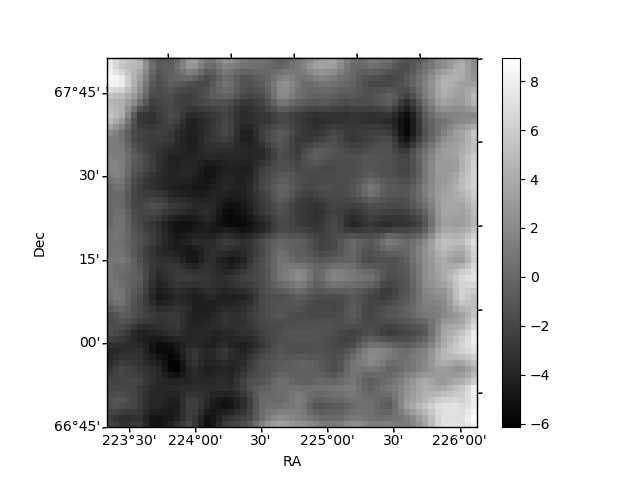
Histogram calculated using DETX and DETY for each event in the final _common_clean file
| Quadrant A | 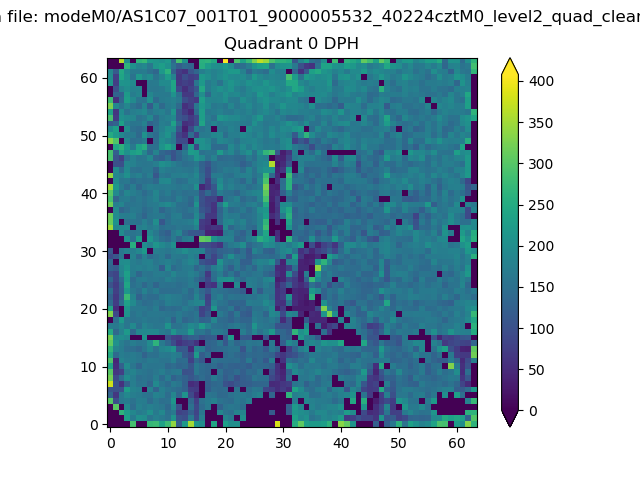 |
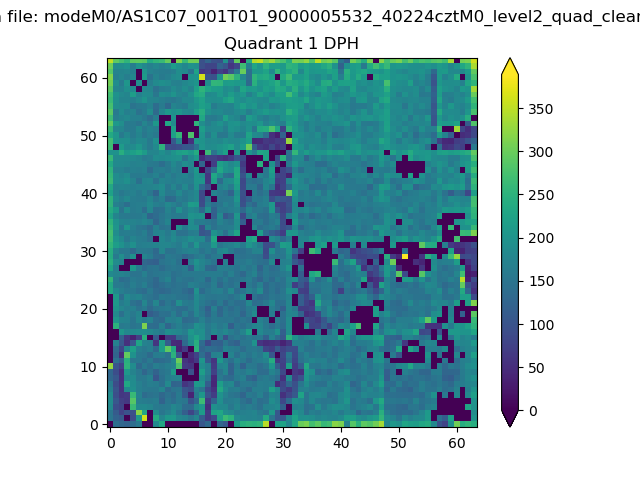 |
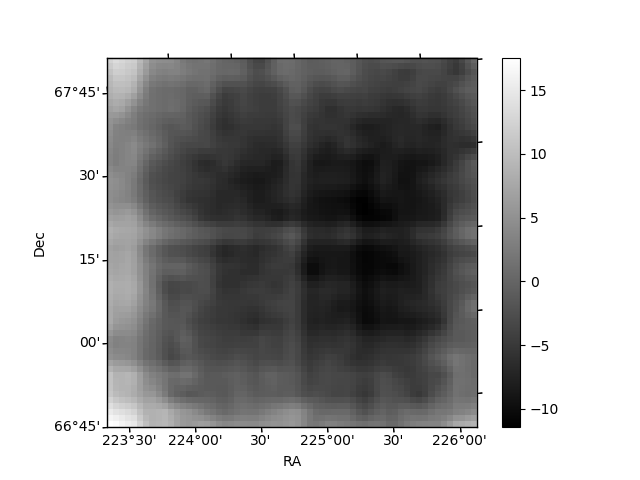
Quadrant B |
|---|---|---|---|
| Quadrant D | 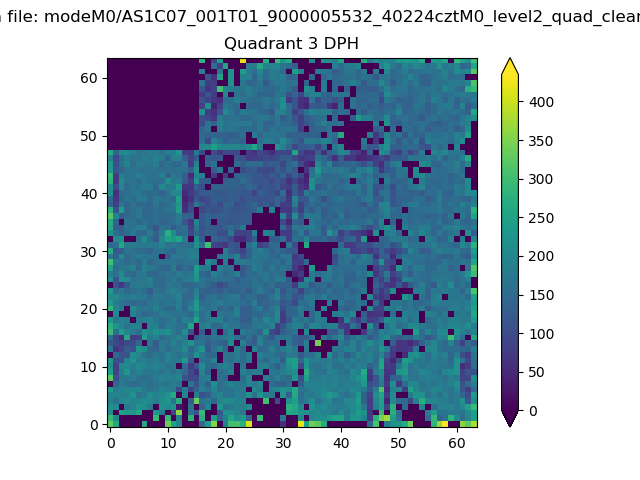 |
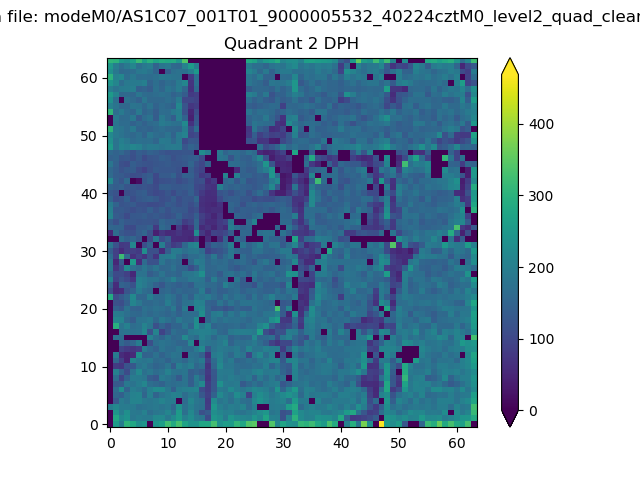 |
Quadrant C |
| Plot type | Count rate plots | Images |
|---|---|---|
| Comparison with Poisson distribution Blue bars denote a histogram of data divided into 1 sec bins. Red curve is a Poisson curve with rate = median count rate of data. |
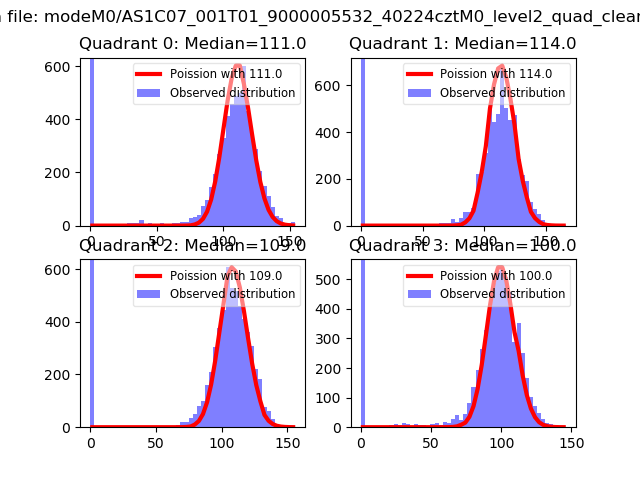 |
 |
| Quadrant-wise count rates Data is divided into 100 sec bins |
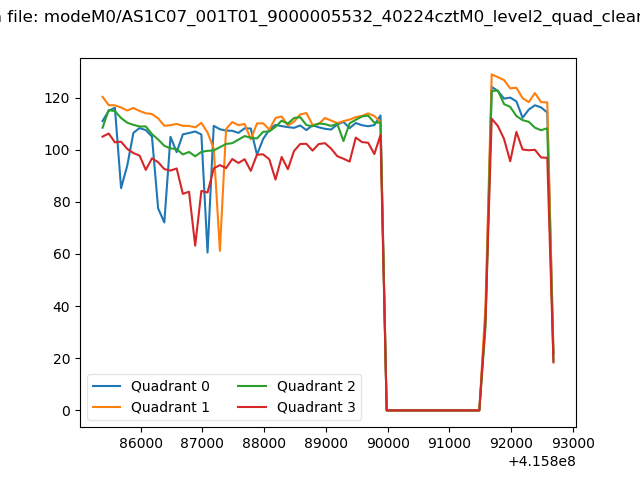 |
|
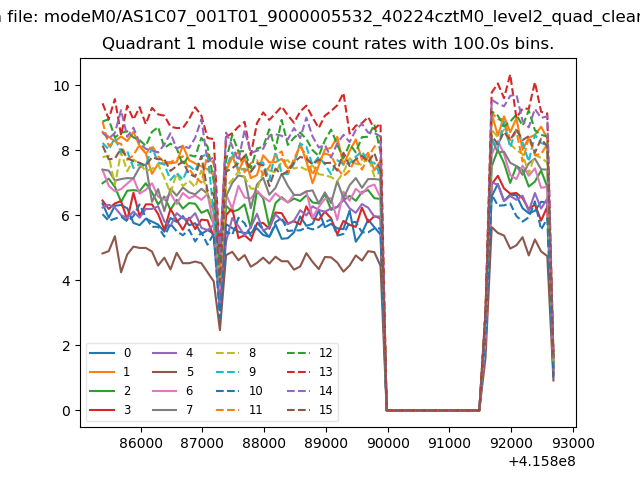
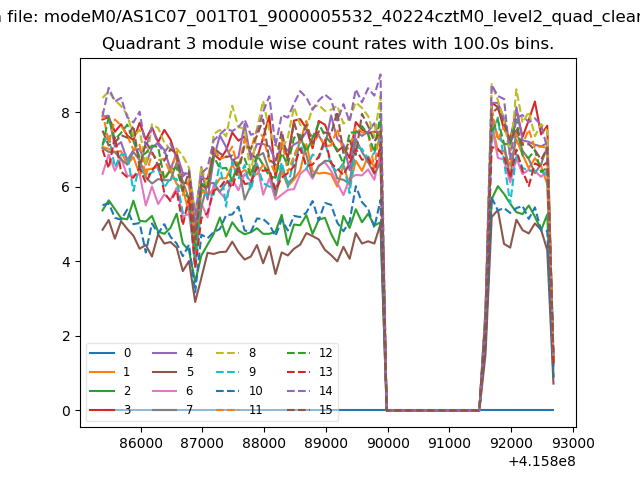
| Module-wise count rates for Quadrant A Data is divided into 100 sec bins |
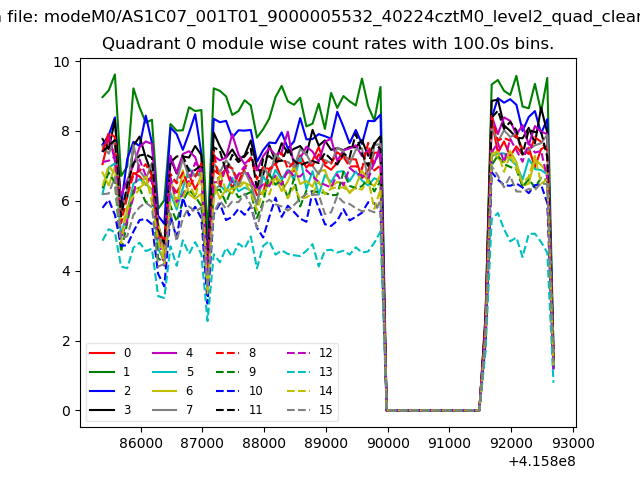 |
 |
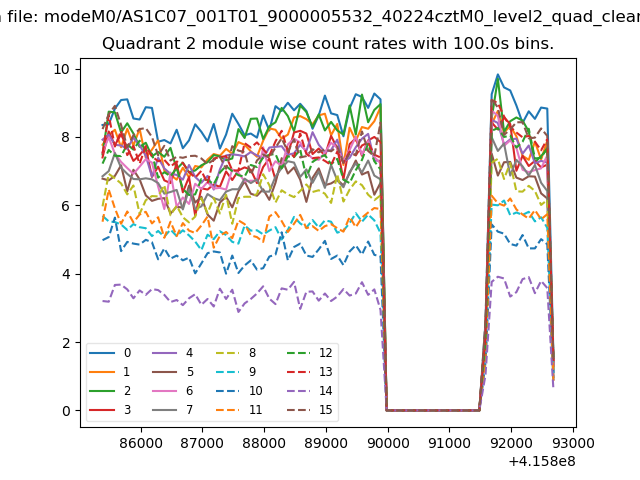
| Module-wise count rates for Quadrant B Data is divided into 100 sec bins |
 |
 |
| Module-wise count rates for Quadrant C Data is divided into 100 sec bins |
 |
 |
| Module-wise count rates for Quadrant D Data is divided into 100 sec bins |
 |
 |
| Parameter | Plot |
|---|---|
| CZT HV Monitor | 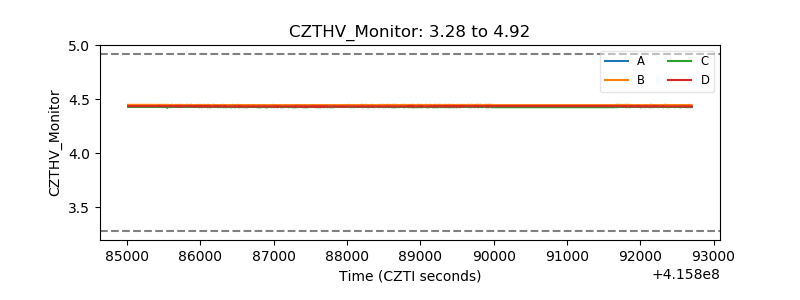 |
| D_VDD | 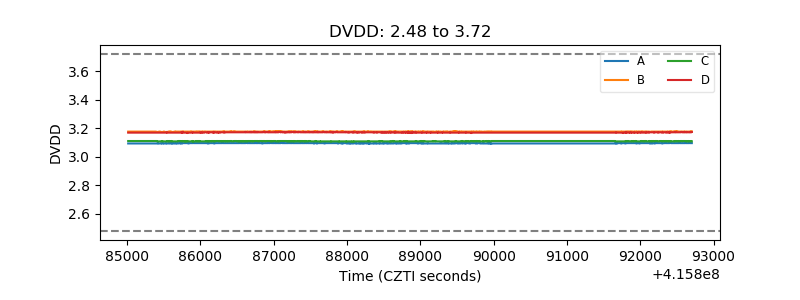 |
| Temperature 1 | 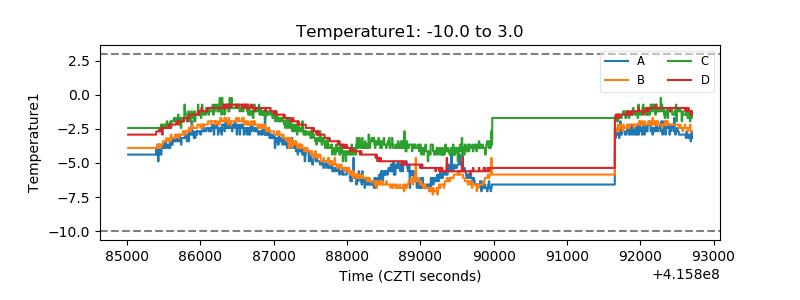 |
| Veto HV Monitor | 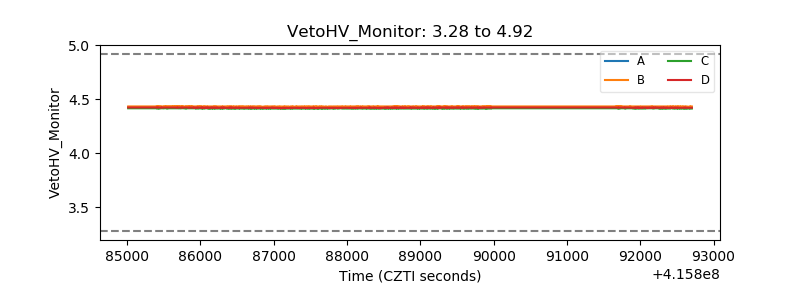 |
| Veto LLD | 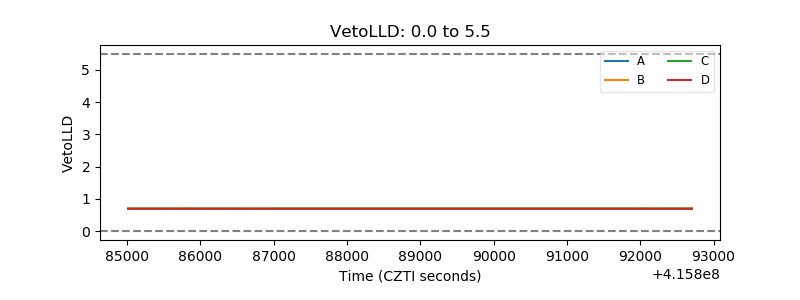 |
| Alpha Counter | 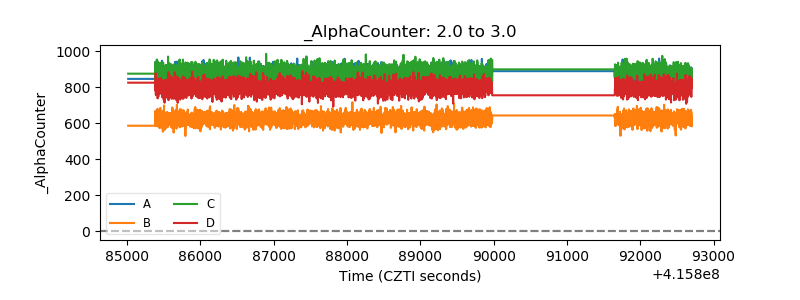 |
| _CPM_Rate | 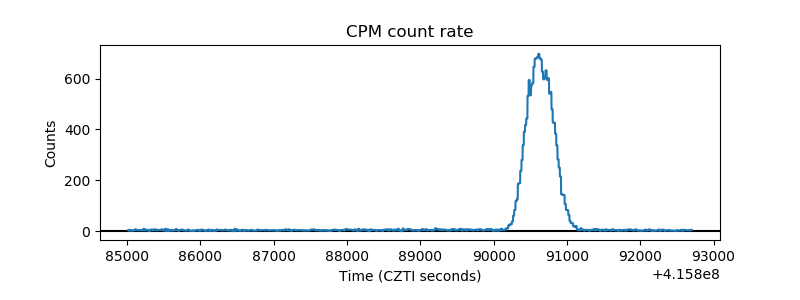 |
| CZT Counter | 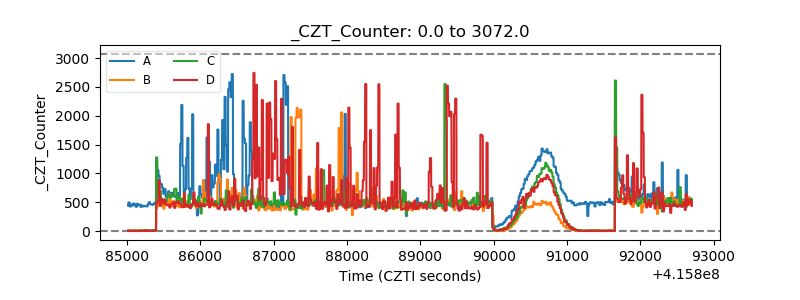 |
| +2.5 Volts monitor | 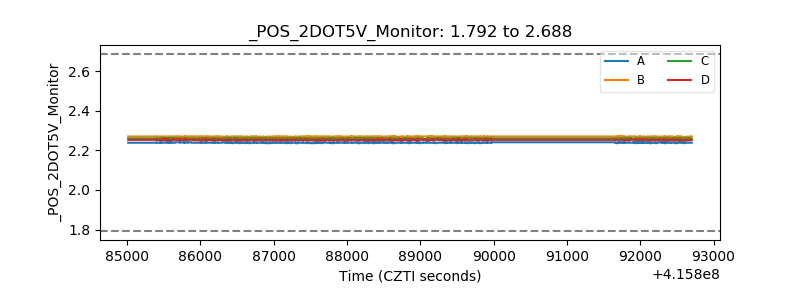 |
| +5 Volts monitor | 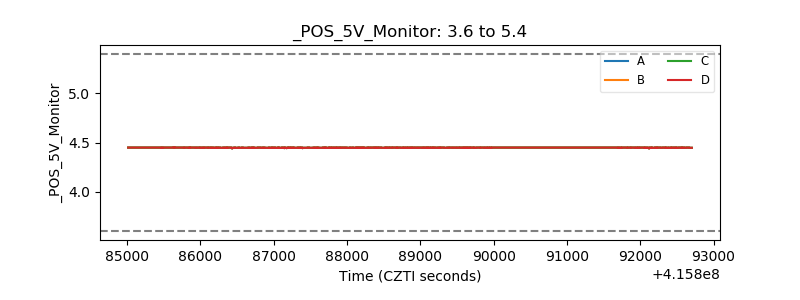 |
| _ROLL_ROT |  |
| _Roll_DEC | 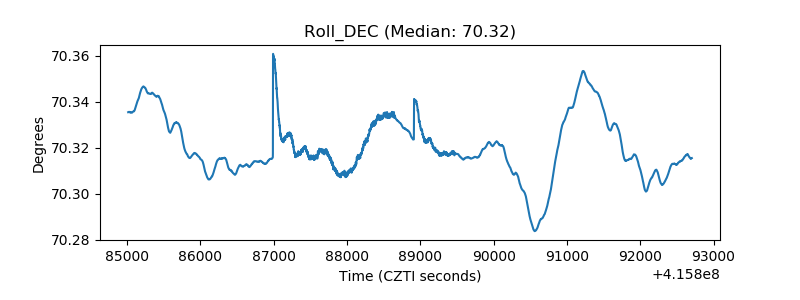 |
| _Roll_RA | 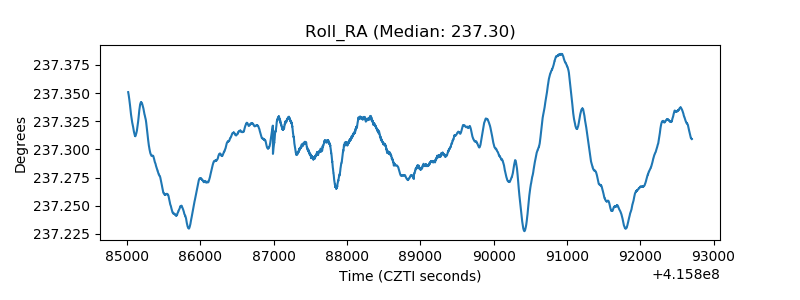 |
| Veto Counter | 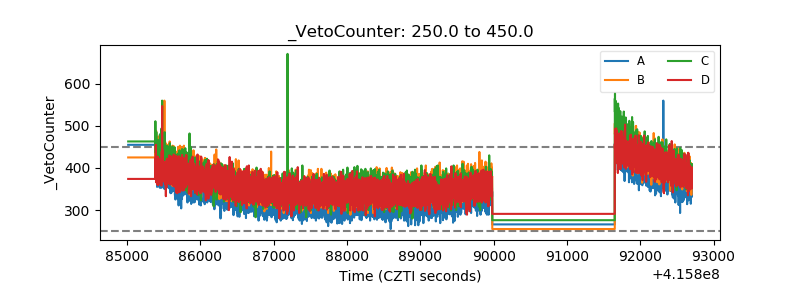 |