| Param | Original file | Final file |
|---|---|---|
| Filename | modeM0/AS1C07_001T01_9000005532_40226cztM0_level2.fits | modeM0/AS1C07_001T01_9000005532_40226cztM0_level2_quad_clean.evt |
| Size (bytes) | 330,056,640 | 90,970,560 |
| Size | 314.8 MB | 86.8 MB |
| Events in quadrant A | 2,941,017 | 610,531 |
| Events in quadrant B | 2,651,404 | 628,373 |
| Events in quadrant C | 2,823,080 | 601,509 |
| Events in quadrant D | 3,386,012 | 540,335 |
| Mode M0 | |||
|---|---|---|---|
| Quadrant | BADHDUFLAG | Total packets | Discarded packets |
| A | 0 | 12215 | 3 |
| B | 0 | 11521 | 2 |
| C | 0 | 11562 | 2 |
| D | 0 | 13788 | 2 |
| Mode M9 | |||
|---|---|---|---|
| Quadrant | BADHDUFLAG | Total packets | Discarded packets |
| A | 0 | 19 | 0 |
| B | 0 | 19 | 0 |
| C | 0 | 19 | 0 |
| D | 0 | 20 | 0 |
| Mode SS | |||
|---|---|---|---|
| Quadrant | BADHDUFLAG | Total packets | Discarded packets |
| A | 0 | 108 | 0 |
| B | 0 | 108 | 0 |
| C | 0 | 108 | 0 |
| D | 0 | 108 | 0 |
| Quadrant | Total seconds | Saturated seconds | Saturation percentage |
|---|---|---|---|
| A | 5340 | 61 | 1.142322% |
| B | 5340 | 38 | 0.711610% |
| C | 5340 | 16 | 0.299625% |
| D | 5340 | 235 | 4.400749% |
Noise dominated data is calculated using 1-second bins in cleaned event files. If a bin has >2000 counts, and if more than 50% of those come from <1% of pixels, then it is considered to be noise-dominated and hence unusable.
| Quadrant | # 1 sec bins | Bins with >0 counts | Bins with >2000 counts | High rate bins dominated by noise | Noise dominated (total time) | Noise dominated (detector-on time) | Marked lightcurve |
|---|---|---|---|---|---|---|---|
| A | 7133 | 5341 | 29 | 29 | 0.41% | 0.54% | 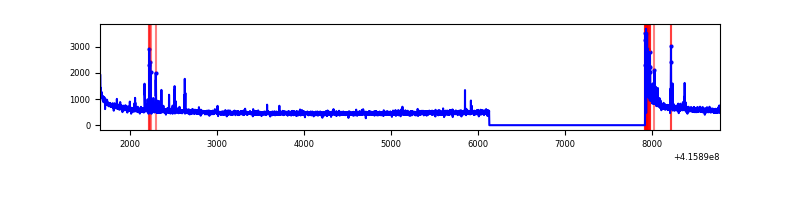 |
| B | 7133 | 5341 | 23 | 23 | 0.32% | 0.43% | 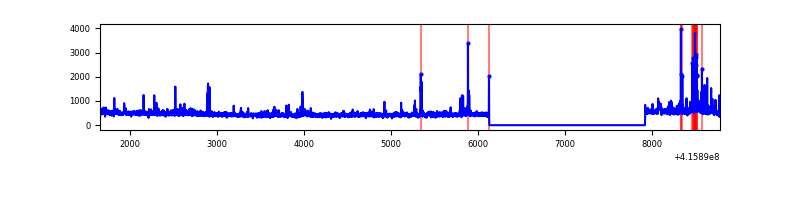 |
| C | 7133 | 5341 | 8 | 8 | 0.11% | 0.15% | 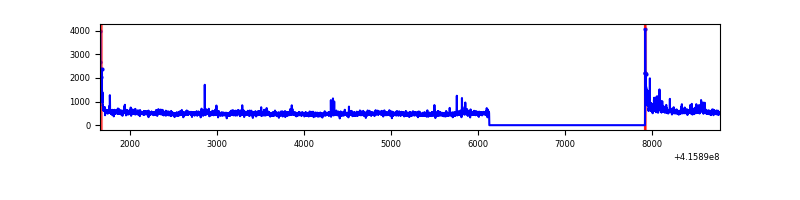 |
| D | 7133 | 5341 | 154 | 154 | 2.16% | 2.88% | 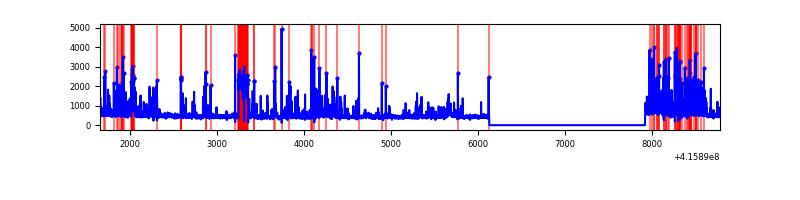 |
Top three noisy pixels from each quadrant. If the there are fewer than three noisy pixels in the level2.evt file, extra rows are filled as -1
| Pixel properties | Quadrant properties | ||||||
|---|---|---|---|---|---|---|---|
| Quadrant | DetID | PixID | Counts | Sigma | Mean | Median | Sigma |
| A | 10 | 83 | 475256 | 3847.81 | 597 | 584 | 123.4 |
| A | 13 | 248 | 145601 | 1175.54 | 597 | 584 | 123.4 |
| A | 13 | 6 | 10424 | 79.77 | 597 | 584 | 123.4 |
| B | 5 | 255 | 141782 | 1231.26 | 594 | 577 | 114.7 |
| B | 0 | 245 | 54022 | 466.02 | 594 | 577 | 114.7 |
| B | 4 | 171 | 50029 | 431.21 | 594 | 577 | 114.7 |
| C | 15 | 214 | 228967 | 1667.58 | 588 | 592 | 136.9 |
| C | 9 | 187 | 122535 | 890.42 | 588 | 592 | 136.9 |
| C | 1 | 16 | 108140 | 785.31 | 588 | 592 | 136.9 |
| D | 12 | 227 | 546090 | 3885.47 | 576 | 560 | 140.4 |
| D | 13 | 249 | 358172 | 2547.05 | 576 | 560 | 140.4 |
| D | 12 | 233 | 105511 | 747.5 | 576 | 560 | 140.4 |
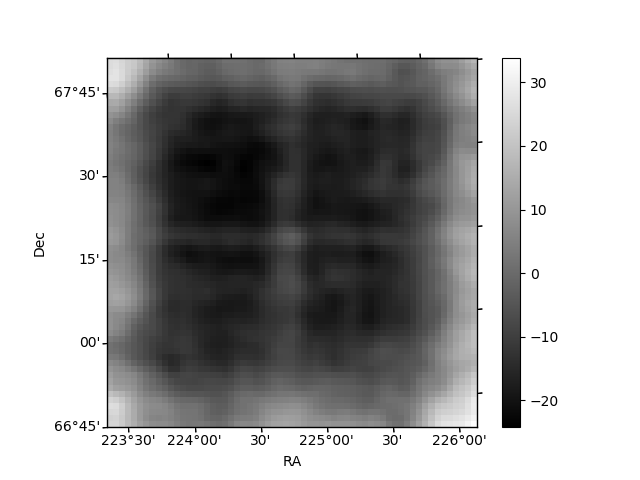
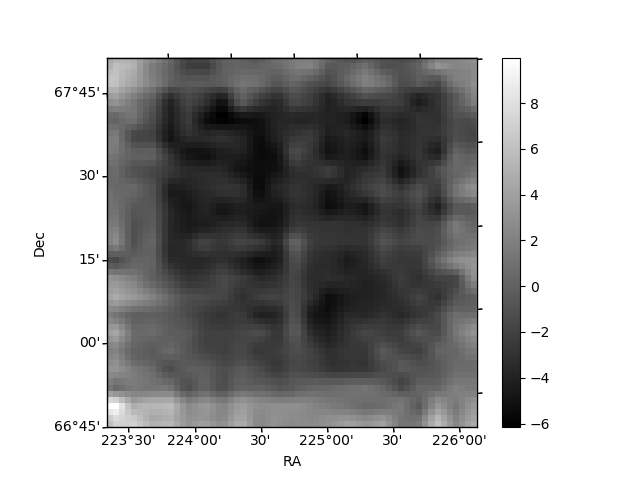
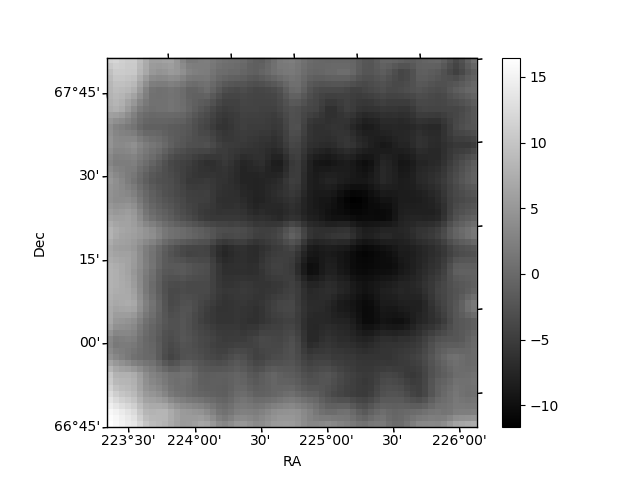
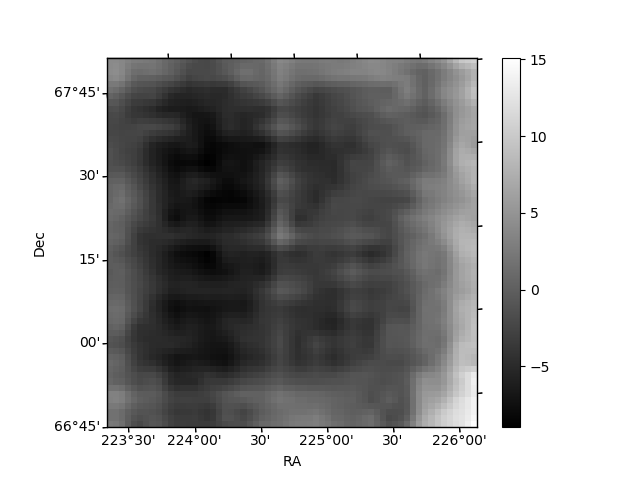
Histogram calculated using DETX and DETY for each event in the final _common_clean file
| Quadrant A | 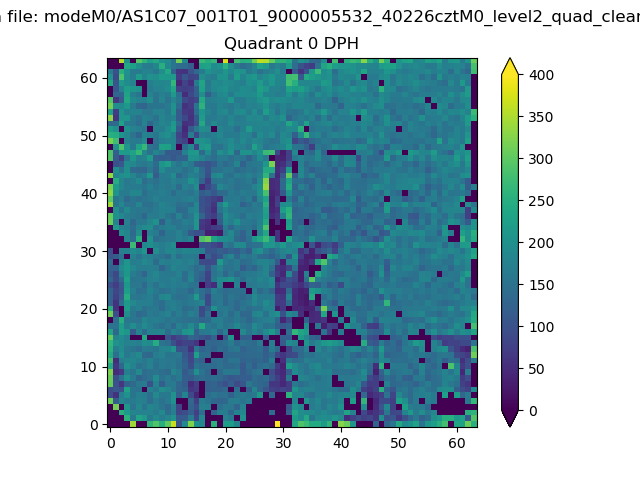 |
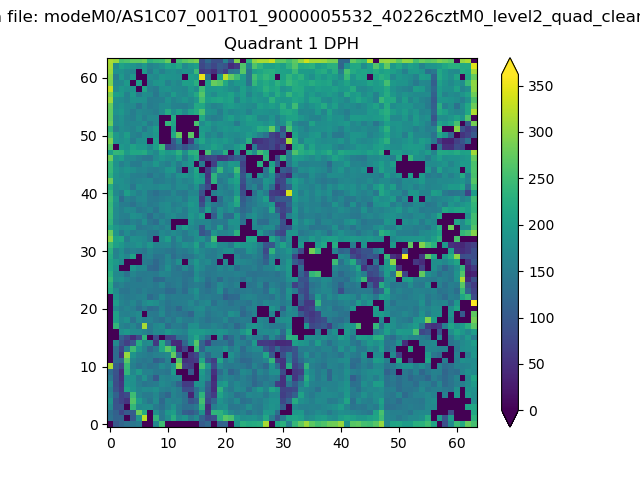 |
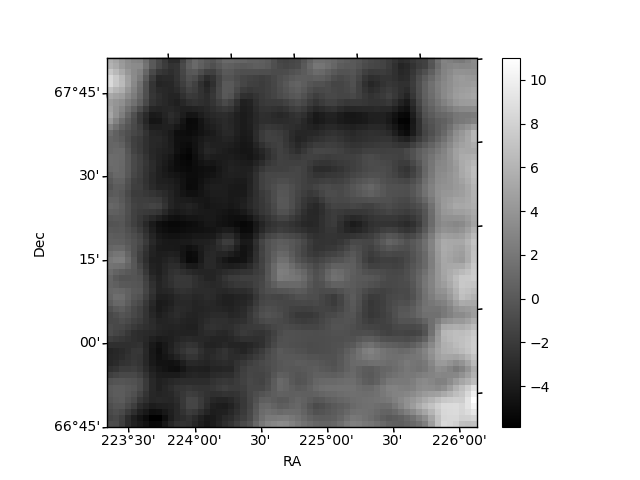
Quadrant B |
|---|---|---|---|
| Quadrant D | 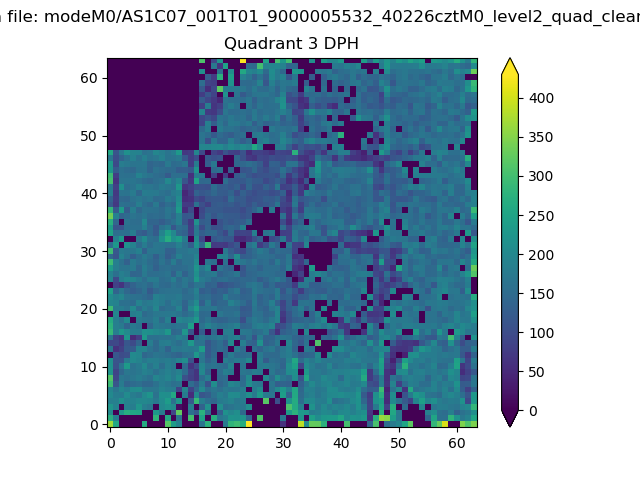 |
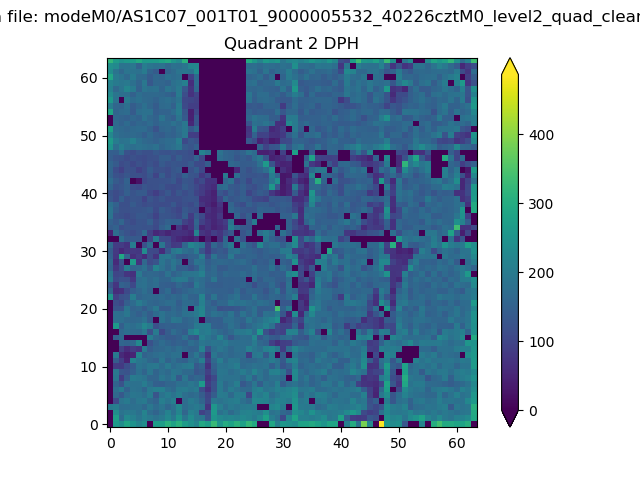 |
Quadrant C |
| Plot type | Count rate plots | Images |
|---|---|---|
| Comparison with Poisson distribution Blue bars denote a histogram of data divided into 1 sec bins. Red curve is a Poisson curve with rate = median count rate of data. |
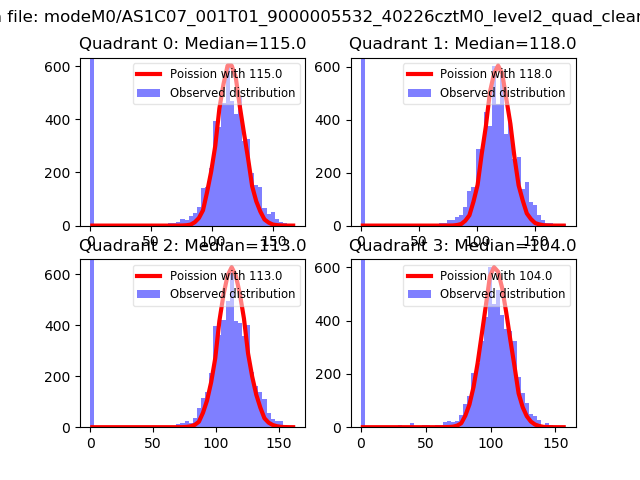 |
 |
| Quadrant-wise count rates Data is divided into 100 sec bins |
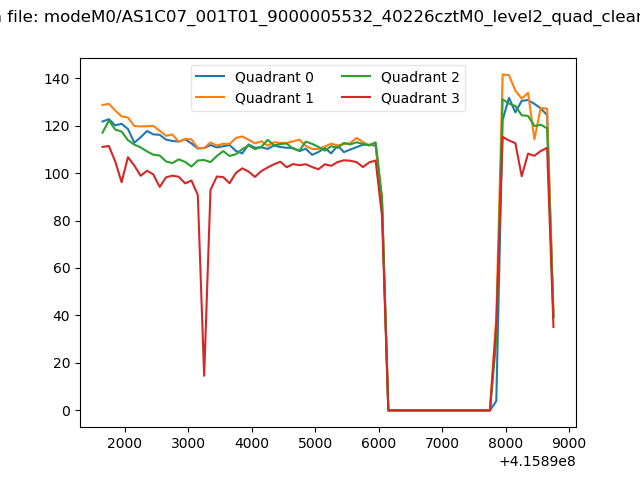 |
|
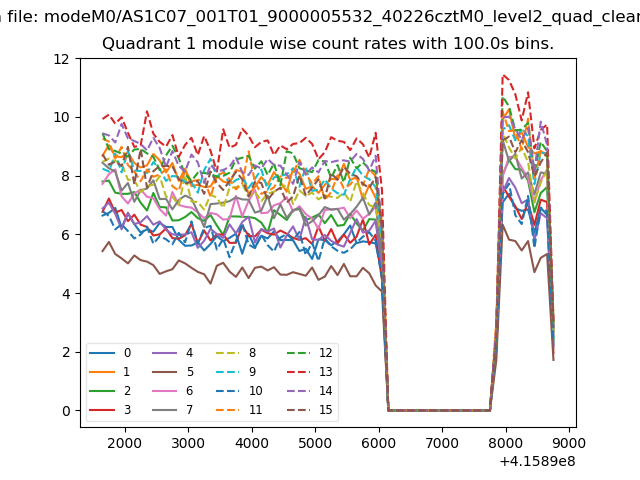
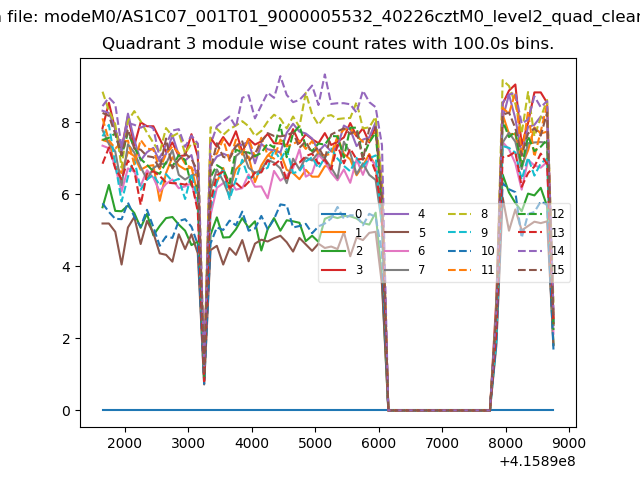
| Module-wise count rates for Quadrant A Data is divided into 100 sec bins |
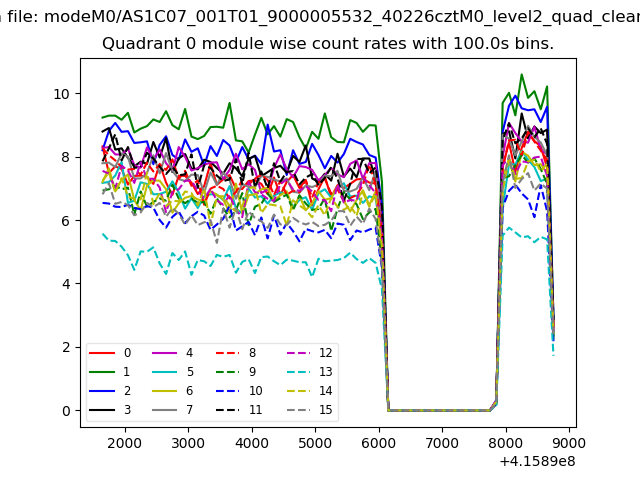 |
 |
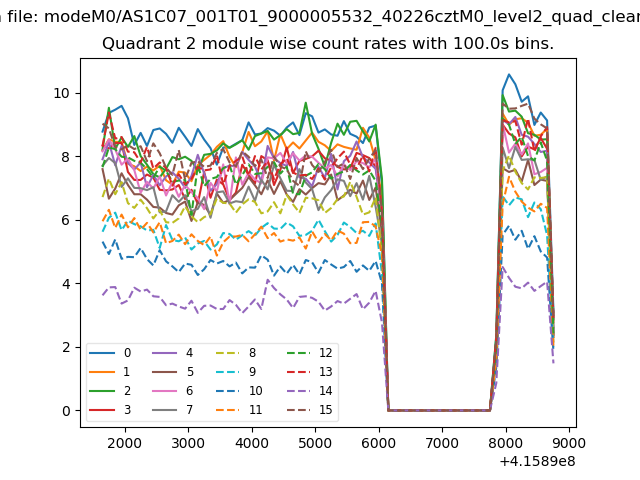
| Module-wise count rates for Quadrant B Data is divided into 100 sec bins |
 |
 |
| Module-wise count rates for Quadrant C Data is divided into 100 sec bins |
 |
 |
| Module-wise count rates for Quadrant D Data is divided into 100 sec bins |
 |
 |
| Parameter | Plot |
|---|---|
| CZT HV Monitor | 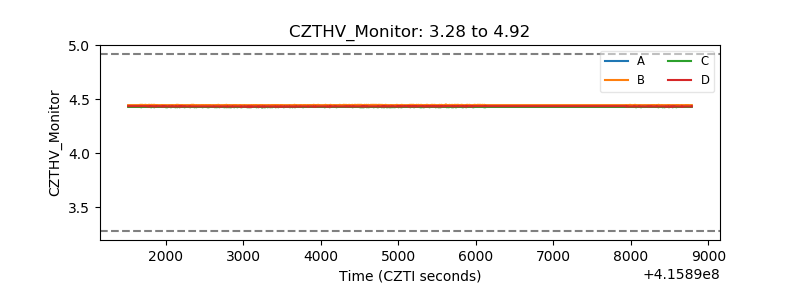 |
| D_VDD | 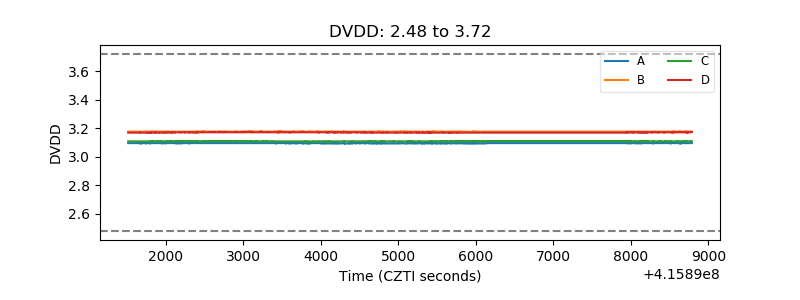 |
| Temperature 1 | 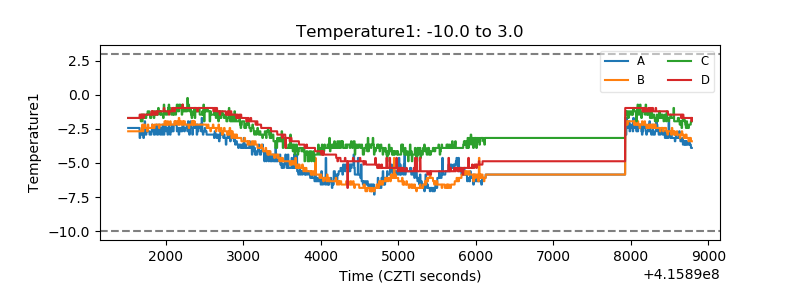 |
| Veto HV Monitor | 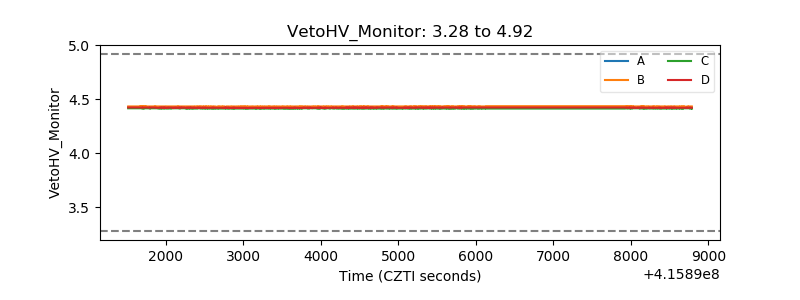 |
| Veto LLD | 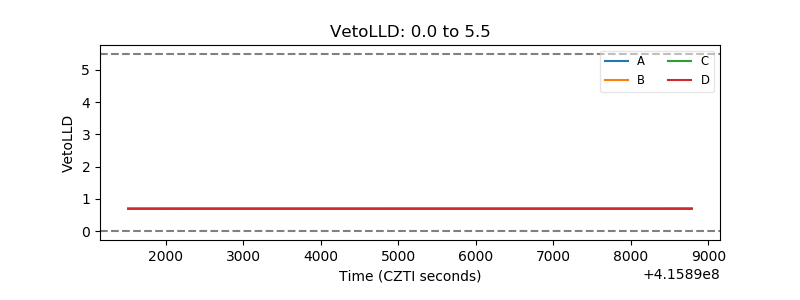 |
| Alpha Counter | 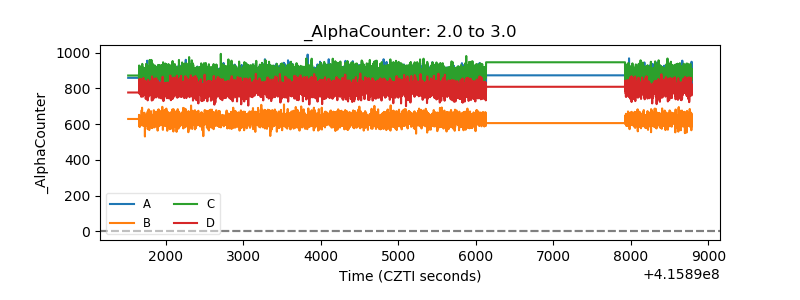 |
| _CPM_Rate | 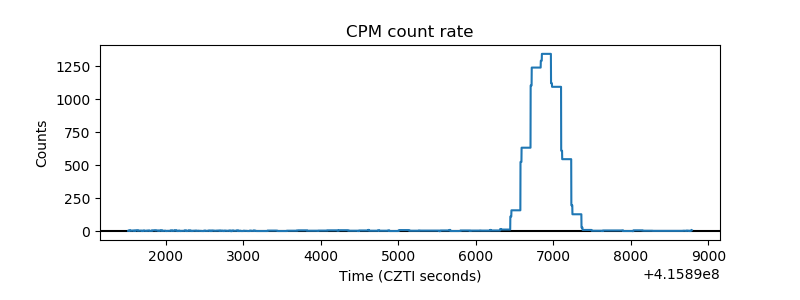 |
| CZT Counter | 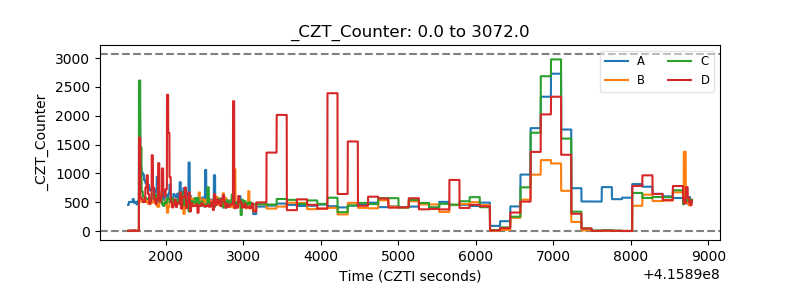 |
| +2.5 Volts monitor | 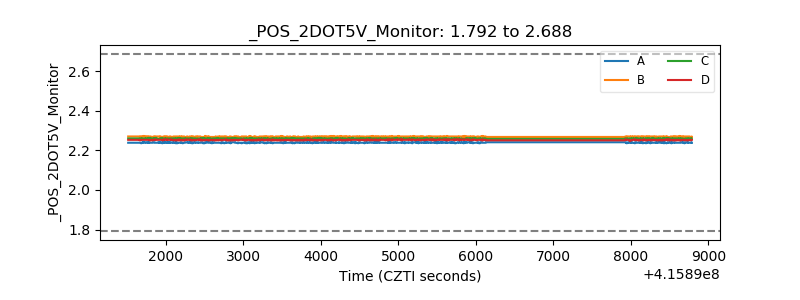 |
| +5 Volts monitor |  |
| _ROLL_ROT | 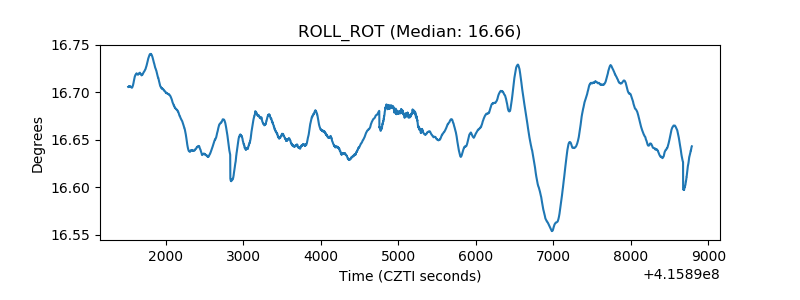 |
| _Roll_DEC | 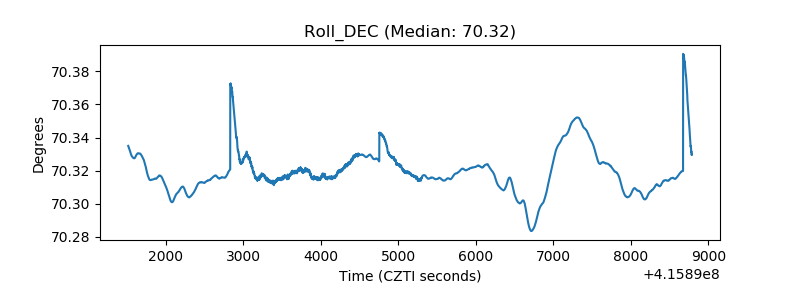 |
| _Roll_RA | 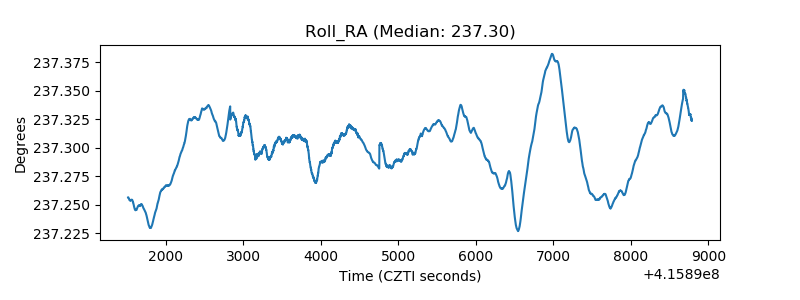 |
| Veto Counter | 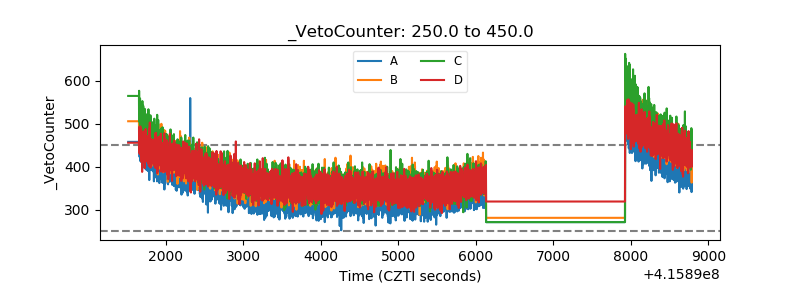 |