| Param | Original file | Final file |
|---|---|---|
| Filename | modeM0/AS1C07_001T01_9000005532_40227cztM0_level2.fits | modeM0/AS1C07_001T01_9000005532_40227cztM0_level2_quad_clean.evt |
| Size (bytes) | 331,591,680 | 92,543,040 |
| Size | 316.2 MB | 88.3 MB |
| Events in quadrant A | 2,831,513 | 621,605 |
| Events in quadrant B | 3,306,352 | 645,417 |
| Events in quadrant C | 2,691,880 | 618,814 |
| Events in quadrant D | 3,051,922 | 562,936 |
| Mode M0 | |||
|---|---|---|---|
| Quadrant | BADHDUFLAG | Total packets | Discarded packets |
| A | 0 | 11682 | 0 |
| B | 0 | 13034 | 0 |
| C | 0 | 11238 | 0 |
| D | 0 | 12592 | 0 |
| Mode M9 | |||
|---|---|---|---|
| Quadrant | BADHDUFLAG | Total packets | Discarded packets |
| A | 0 | 25 | 0 |
| B | 0 | 25 | 0 |
| C | 0 | 25 | 0 |
| D | 0 | 26 | 0 |
| Mode SS | |||
|---|---|---|---|
| Quadrant | BADHDUFLAG | Total packets | Discarded packets |
| A | 0 | 102 | 0 |
| B | 0 | 102 | 0 |
| C | 0 | 102 | 0 |
| D | 0 | 102 | 0 |
| Quadrant | Total seconds | Saturated seconds | Saturation percentage |
|---|---|---|---|
| A | 5045 | 70 | 1.387512% |
| B | 5045 | 111 | 2.200198% |
| C | 5045 | 28 | 0.555005% |
| D | 5045 | 112 | 2.220020% |
Noise dominated data is calculated using 1-second bins in cleaned event files. If a bin has >2000 counts, and if more than 50% of those come from <1% of pixels, then it is considered to be noise-dominated and hence unusable.
| Quadrant | # 1 sec bins | Bins with >0 counts | Bins with >2000 counts | High rate bins dominated by noise | Noise dominated (total time) | Noise dominated (detector-on time) | Marked lightcurve |
|---|---|---|---|---|---|---|---|
| A | 6988 | 5046 | 36 | 36 | 0.52% | 0.71% | 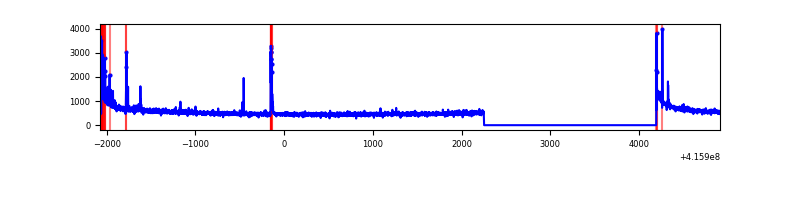 |
| B | 6988 | 5046 | 53 | 53 | 0.76% | 1.05% | 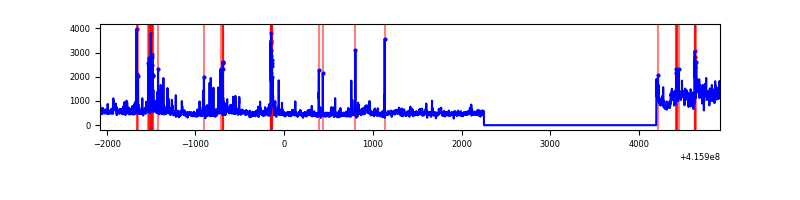 |
| C | 6988 | 5046 | 17 | 17 | 0.24% | 0.34% | 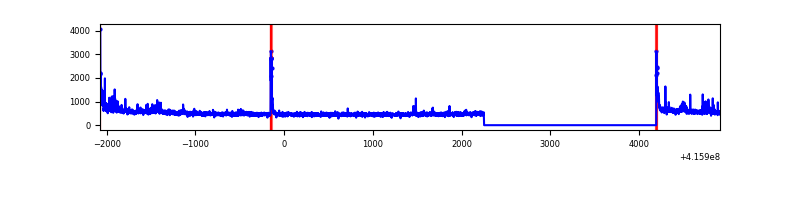 |
| D | 6988 | 5046 | 78 | 78 | 1.12% | 1.55% | 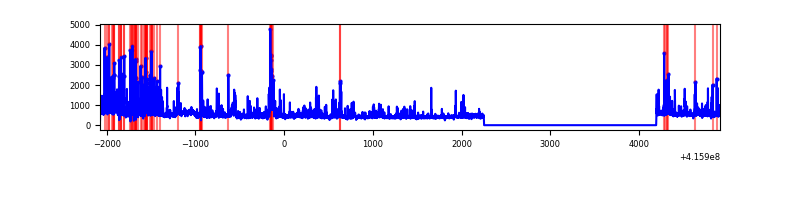 |
Top three noisy pixels from each quadrant. If the there are fewer than three noisy pixels in the level2.evt file, extra rows are filled as -1
| Pixel properties | Quadrant properties | ||||||
|---|---|---|---|---|---|---|---|
| Quadrant | DetID | PixID | Counts | Sigma | Mean | Median | Sigma |
| A | 10 | 83 | 455759 | 3842.85 | 580 | 569 | 118.5 |
| A | 13 | 248 | 116076 | 975.14 | 580 | 569 | 118.5 |
| A | 13 | 252 | 9564 | 75.94 | 580 | 569 | 118.5 |
| B | 7 | 202 | 626484 | 5693.53 | 583 | 568 | 109.9 |
| B | 5 | 255 | 182712 | 1656.84 | 583 | 568 | 109.9 |
| B | 4 | 171 | 84050 | 759.38 | 583 | 568 | 109.9 |
| C | 15 | 214 | 216891 | 1613.65 | 579 | 583 | 134.0 |
| C | 9 | 187 | 136075 | 1010.76 | 579 | 583 | 134.0 |
| C | 0 | 10 | 47985 | 353.62 | 579 | 583 | 134.0 |
| D | 12 | 227 | 351447 | 2552.89 | 569 | 554 | 137.4 |
| D | 12 | 233 | 188537 | 1367.66 | 569 | 554 | 137.4 |
| D | 13 | 249 | 158003 | 1145.51 | 569 | 554 | 137.4 |
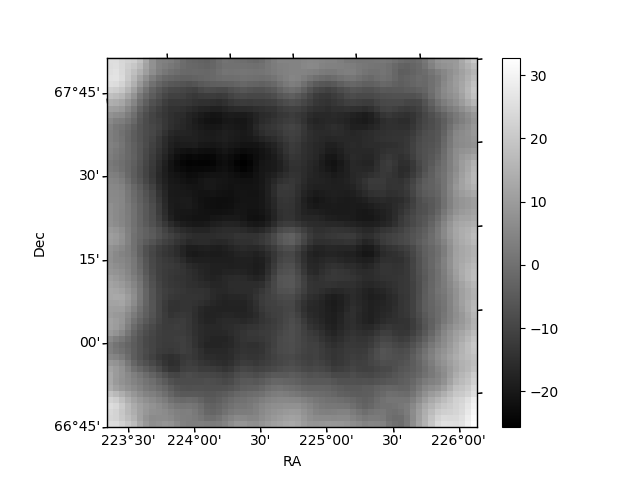
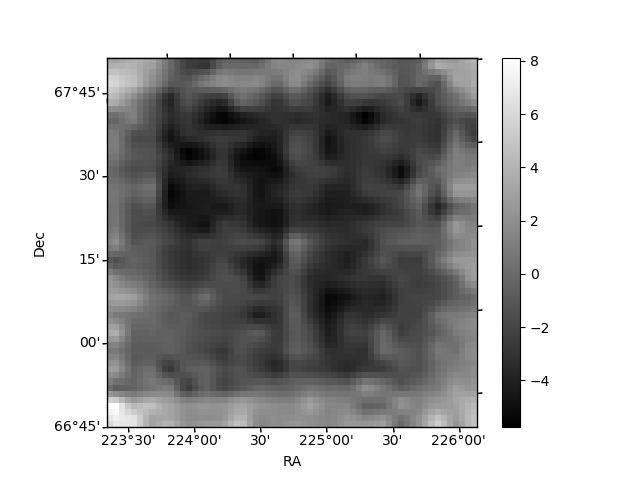
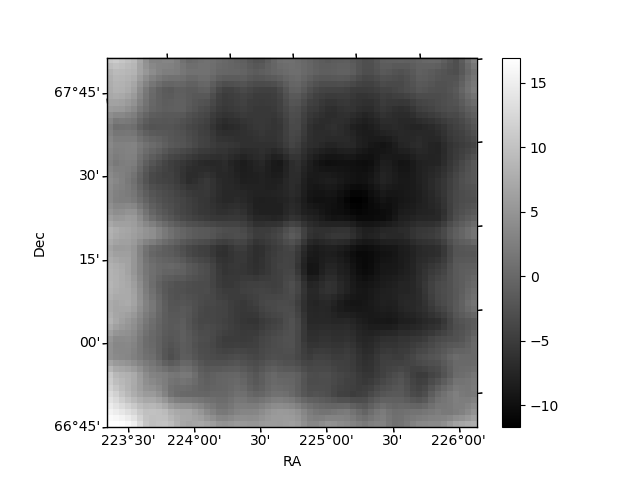
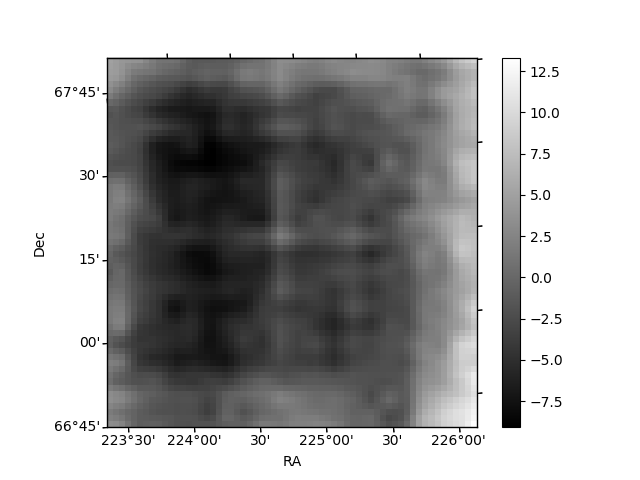
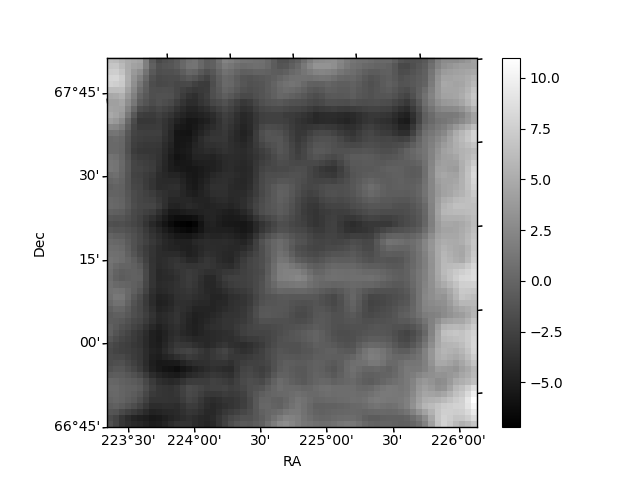
Histogram calculated using DETX and DETY for each event in the final _common_clean file
| Quadrant A | 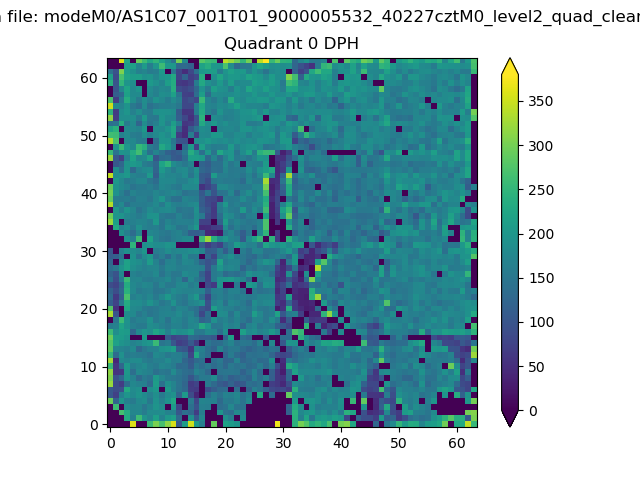 |
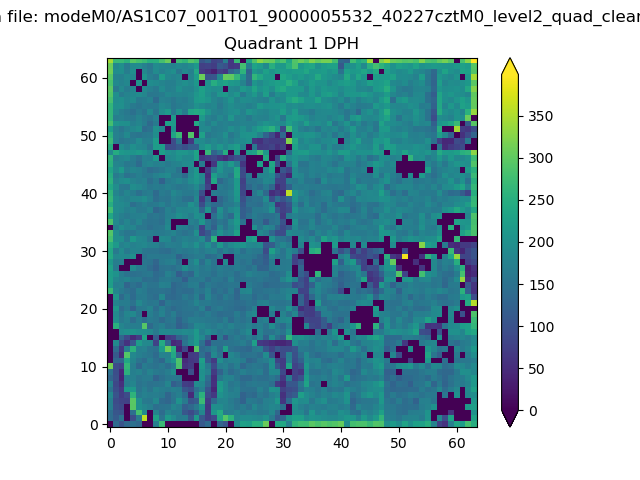 |
Quadrant B |
|---|---|---|---|
| Quadrant D | 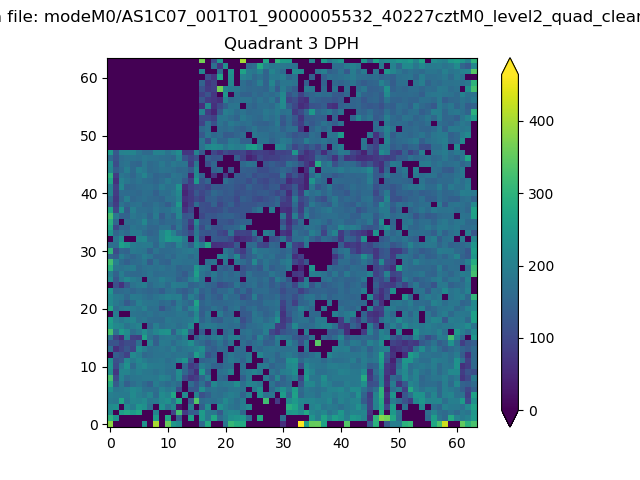 |
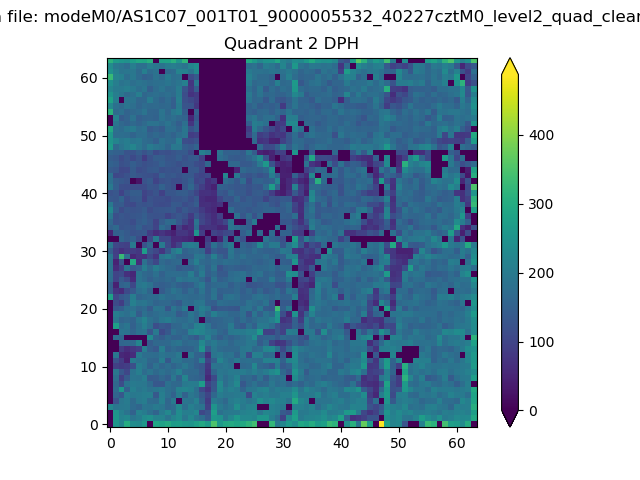 |
Quadrant C |
| Plot type | Count rate plots | Images |
|---|---|---|
| Comparison with Poisson distribution Blue bars denote a histogram of data divided into 1 sec bins. Red curve is a Poisson curve with rate = median count rate of data. |
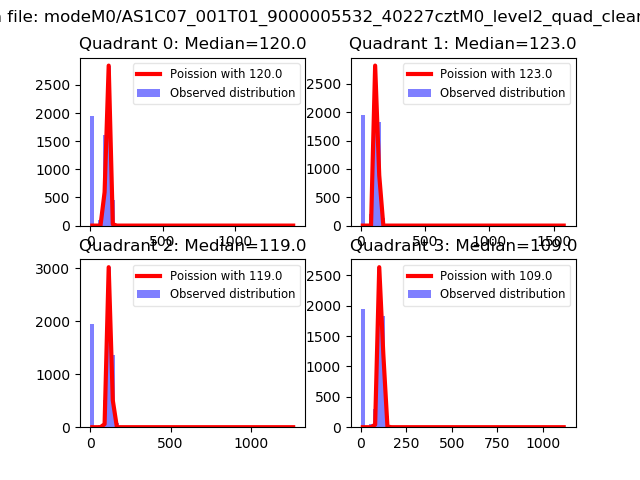 |
 |
| Quadrant-wise count rates Data is divided into 100 sec bins |
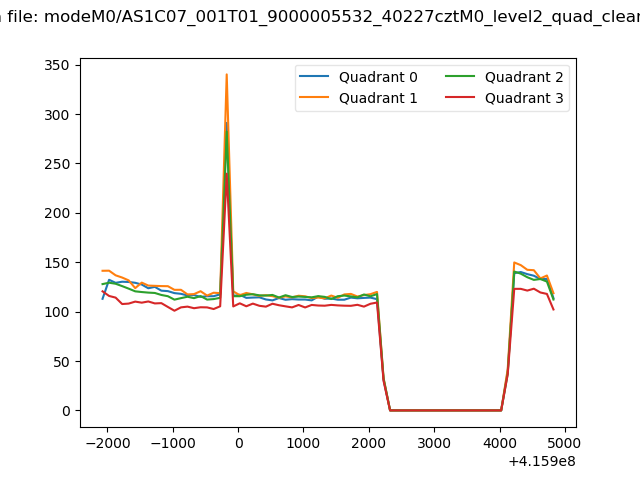 |
|
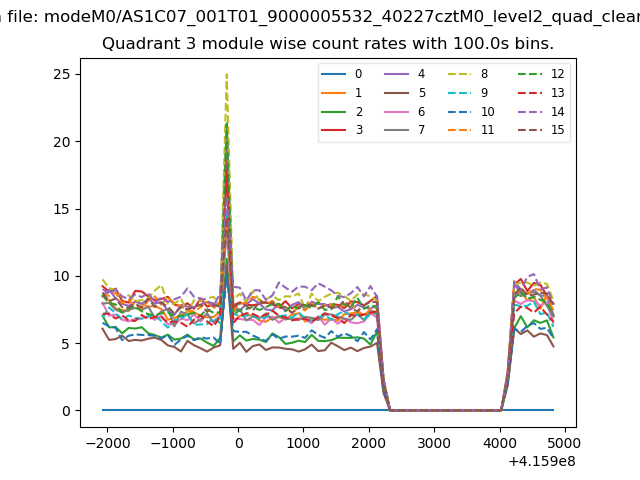
| Module-wise count rates for Quadrant A Data is divided into 100 sec bins |
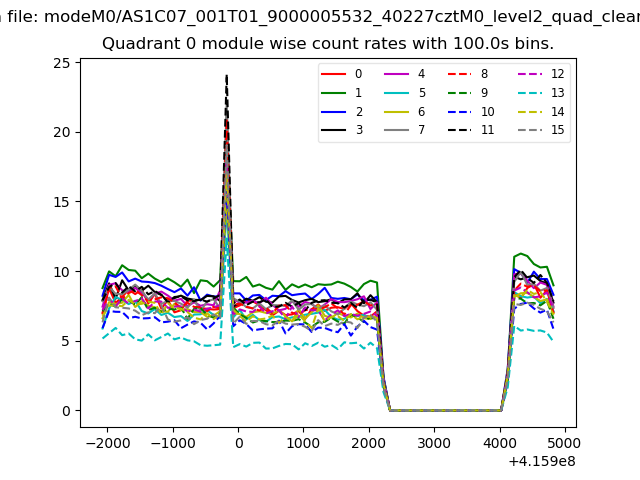 |
 |
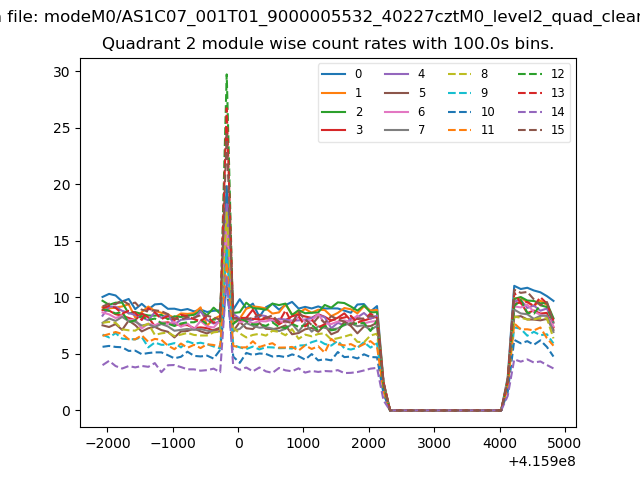
| Module-wise count rates for Quadrant B Data is divided into 100 sec bins |
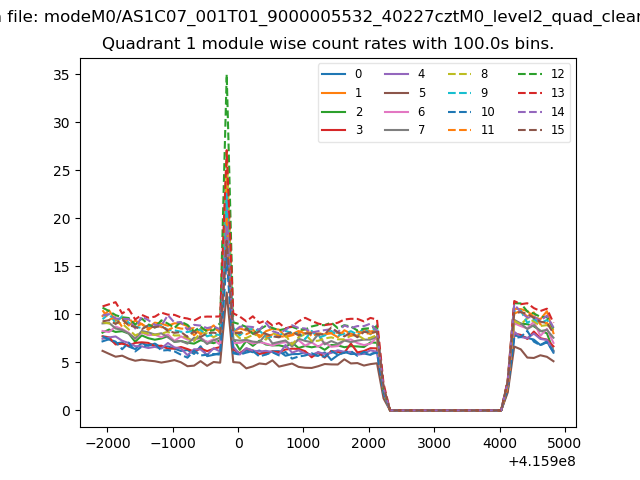 |
 |
| Module-wise count rates for Quadrant C Data is divided into 100 sec bins |
 |
 |
| Module-wise count rates for Quadrant D Data is divided into 100 sec bins |
 |
 |
| Parameter | Plot |
|---|---|
| CZT HV Monitor | 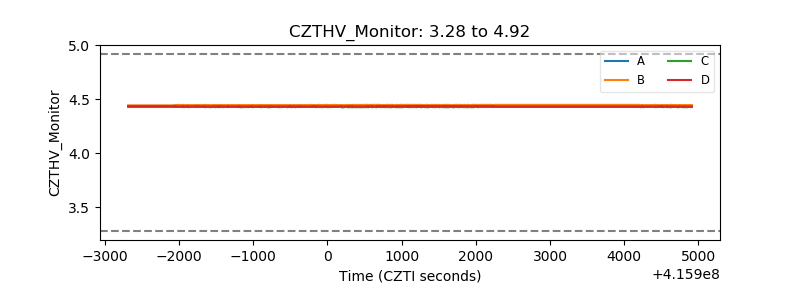 |
| D_VDD | 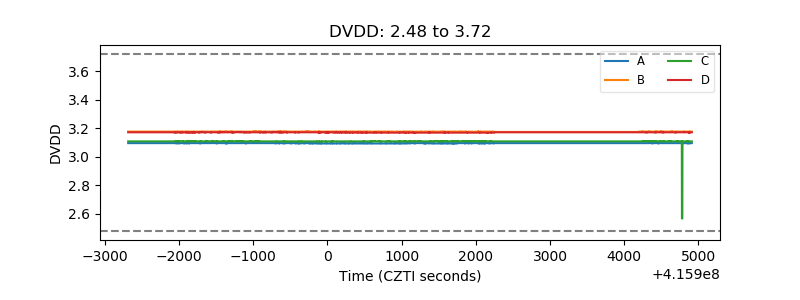 |
| Temperature 1 | 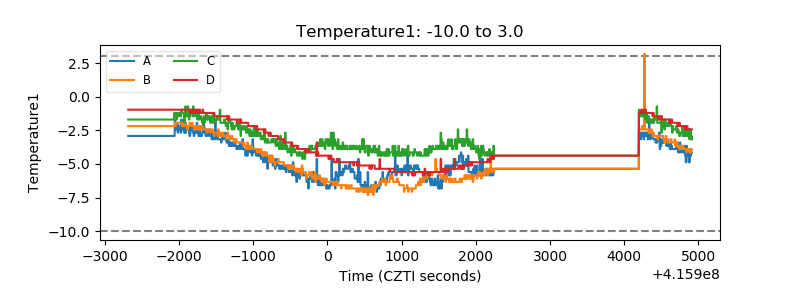 |
| Veto HV Monitor | 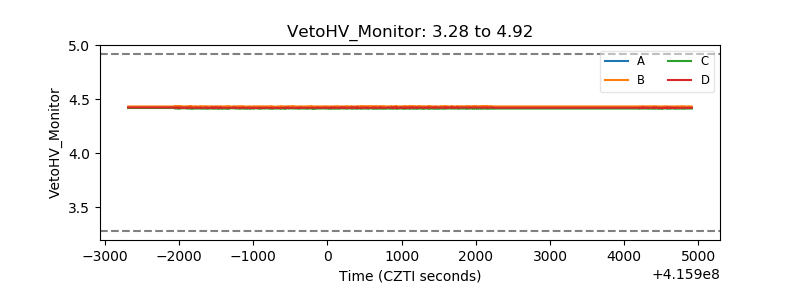 |
| Veto LLD | 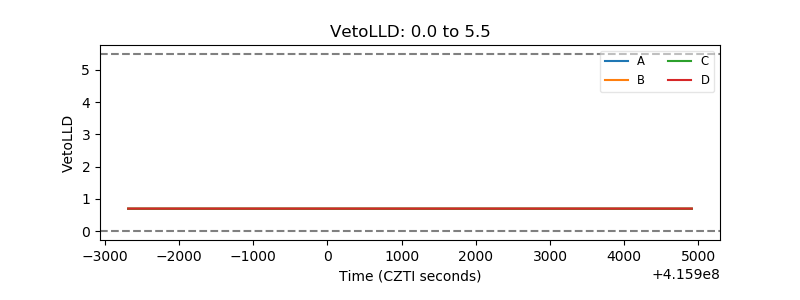 |
| Alpha Counter | 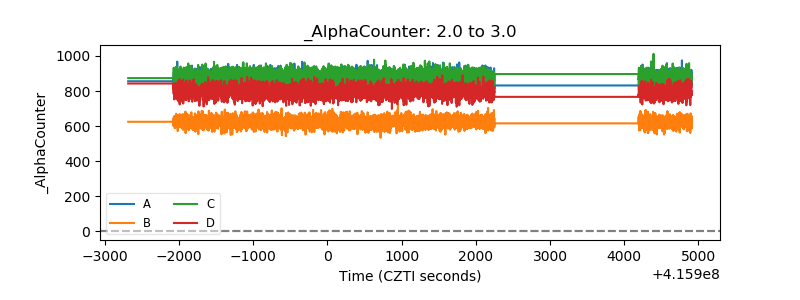 |
| _CPM_Rate | 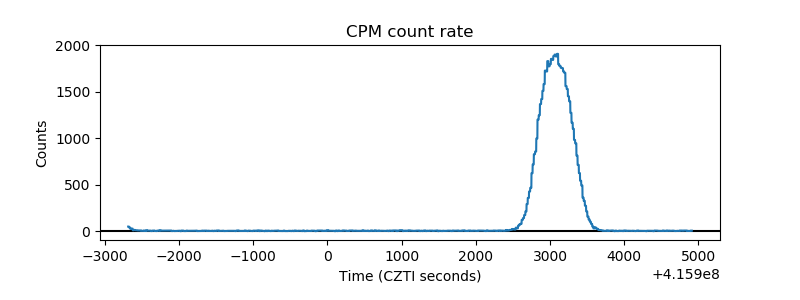 |
| CZT Counter | 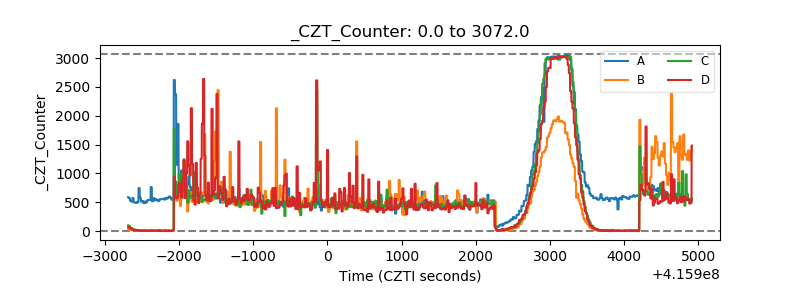 |
| +2.5 Volts monitor | 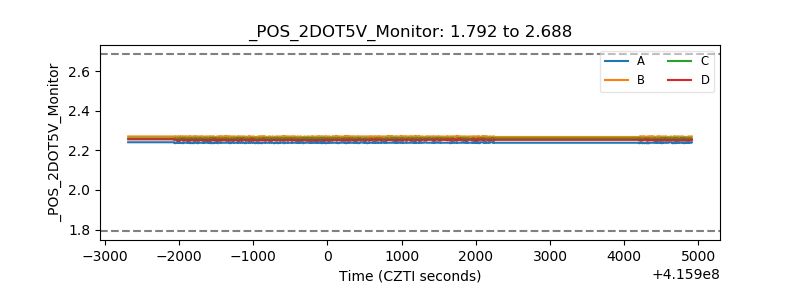 |
| +5 Volts monitor | 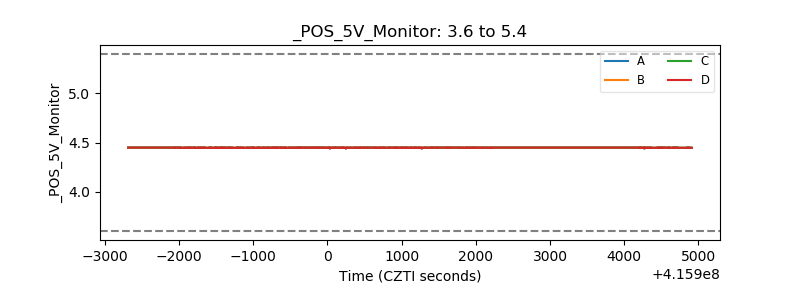 |
| _ROLL_ROT | 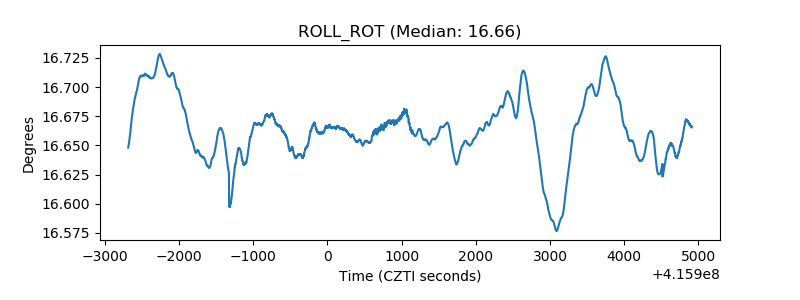 |
| _Roll_DEC | 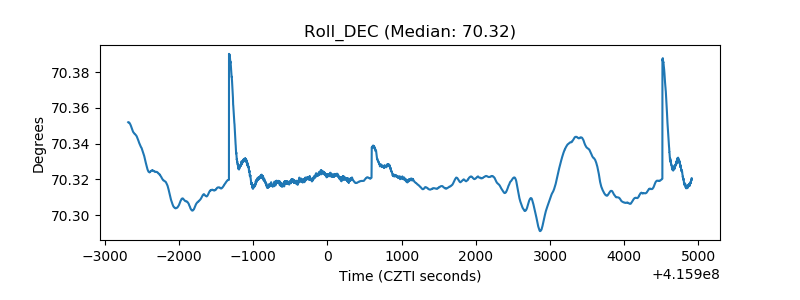 |
| _Roll_RA | 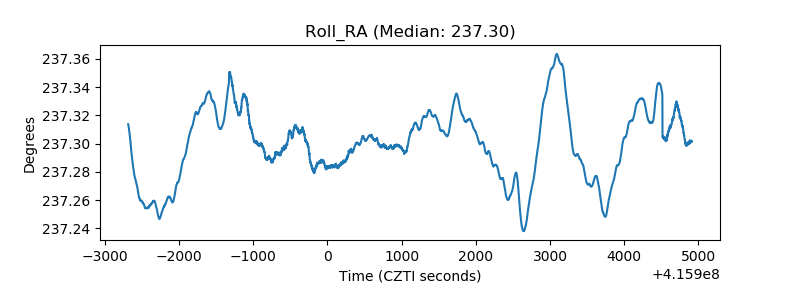 |
| Veto Counter | 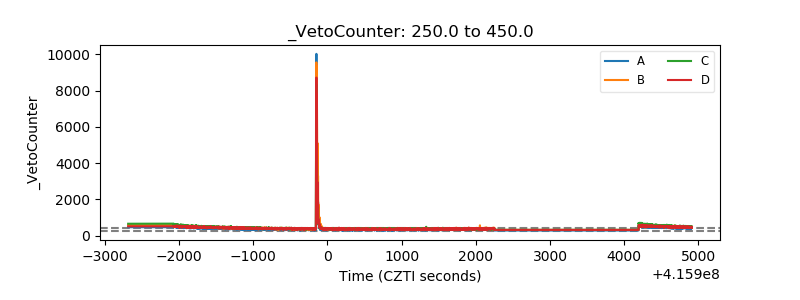 |