| Param | Original file | Final file |
|---|---|---|
| Filename | modeM0/AS1C07_001T01_9000005532_40228cztM0_level2.fits | modeM0/AS1C07_001T01_9000005532_40228cztM0_level2_quad_clean.evt |
| Size (bytes) | 329,117,760 | 91,293,120 |
| Size | 313.9 MB | 87.1 MB |
| Events in quadrant A | 2,740,271 | 611,505 |
| Events in quadrant B | 3,410,364 | 633,069 |
| Events in quadrant C | 2,605,743 | 618,840 |
| Events in quadrant D | 3,040,077 | 553,128 |
| Mode M0 | |||
|---|---|---|---|
| Quadrant | BADHDUFLAG | Total packets | Discarded packets |
| A | 0 | 11345 | 3 |
| B | 0 | 13518 | 2 |
| C | 0 | 10748 | 2 |
| D | 0 | 12552 | 2 |
| Mode M9 | |||
|---|---|---|---|
| Quadrant | BADHDUFLAG | Total packets | Discarded packets |
| A | 0 | 32 | 0 |
| B | 0 | 32 | 0 |
| C | 0 | 32 | 0 |
| D | 0 | 33 | 0 |
| Mode SS | |||
|---|---|---|---|
| Quadrant | BADHDUFLAG | Total packets | Discarded packets |
| A | 0 | 102 | 0 |
| B | 0 | 102 | 0 |
| C | 0 | 102 | 0 |
| D | 0 | 102 | 0 |
| Quadrant | Total seconds | Saturated seconds | Saturation percentage |
|---|---|---|---|
| A | 4962 | 23 | 0.463523% |
| B | 4962 | 86 | 1.733172% |
| C | 4962 | 17 | 0.342604% |
| D | 4962 | 173 | 3.486497% |
Noise dominated data is calculated using 1-second bins in cleaned event files. If a bin has >2000 counts, and if more than 50% of those come from <1% of pixels, then it is considered to be noise-dominated and hence unusable.
| Quadrant | # 1 sec bins | Bins with >0 counts | Bins with >2000 counts | High rate bins dominated by noise | Noise dominated (total time) | Noise dominated (detector-on time) | Marked lightcurve |
|---|---|---|---|---|---|---|---|
| A | 7024 | 4963 | 10 | 10 | 0.14% | 0.20% | 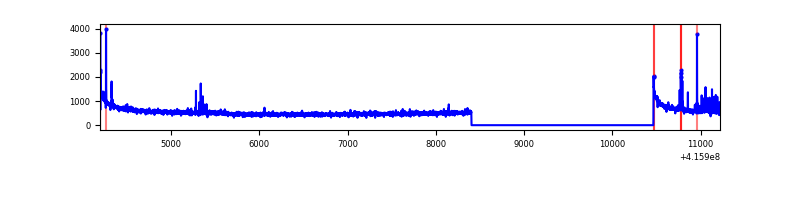 |
| B | 7024 | 4963 | 33 | 33 | 0.47% | 0.66% | 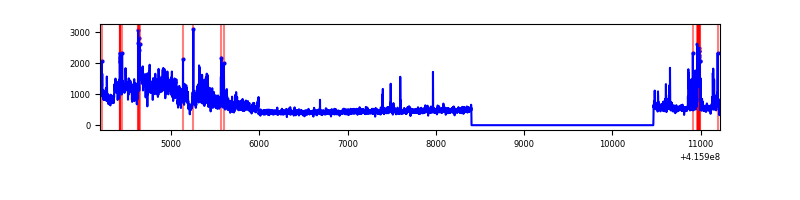 |
| C | 7024 | 4963 | 8 | 8 | 0.11% | 0.16% | 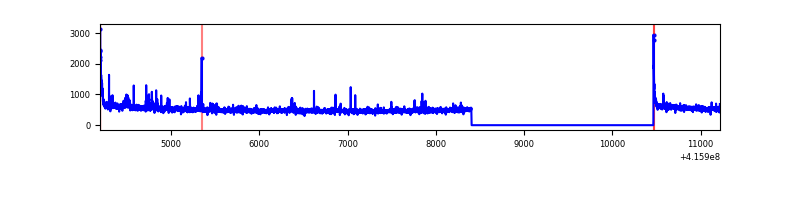 |
| D | 7024 | 4963 | 132 | 132 | 1.88% | 2.66% | 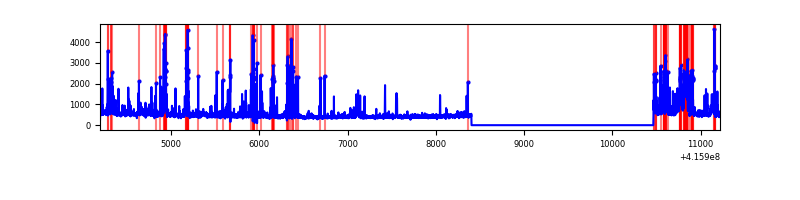 |
Top three noisy pixels from each quadrant. If the there are fewer than three noisy pixels in the level2.evt file, extra rows are filled as -1
| Pixel properties | Quadrant properties | ||||||
|---|---|---|---|---|---|---|---|
| Quadrant | DetID | PixID | Counts | Sigma | Mean | Median | Sigma |
| A | 10 | 83 | 451180 | 3909.36 | 566 | 556 | 115.3 |
| A | 13 | 248 | 78627 | 677.3 | 566 | 556 | 115.3 |
| A | 12 | 189 | 14261 | 118.9 | 566 | 556 | 115.3 |
| B | 7 | 202 | 830535 | 7611.1 | 570 | 555 | 109.0 |
| B | 0 | 229 | 158576 | 1449.09 | 570 | 555 | 109.0 |
| B | 5 | 255 | 74960 | 682.31 | 570 | 555 | 109.0 |
| C | 15 | 214 | 215058 | 1644.46 | 570 | 574 | 130.4 |
| C | 9 | 187 | 79693 | 606.61 | 570 | 574 | 130.4 |
| C | 0 | 10 | 49572 | 375.67 | 570 | 574 | 130.4 |
| D | 12 | 227 | 277156 | 2070.42 | 556 | 542 | 133.6 |
| D | 9 | 19 | 136479 | 1017.47 | 556 | 542 | 133.6 |
| D | 2 | 249 | 123260 | 918.53 | 556 | 542 | 133.6 |
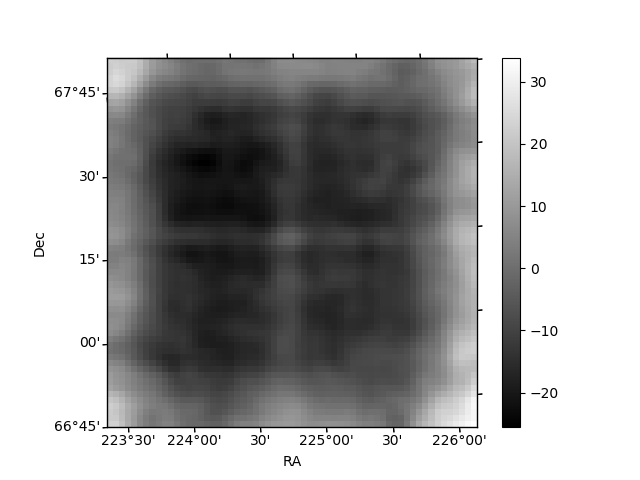
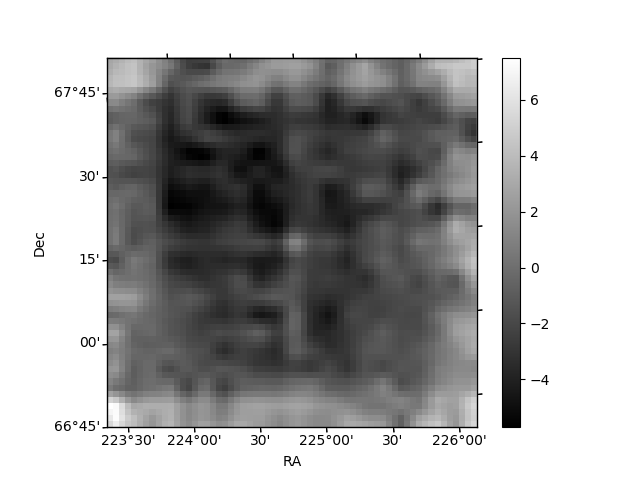
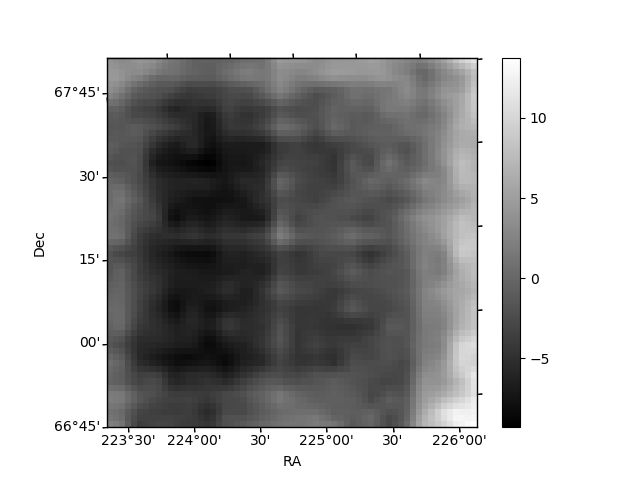
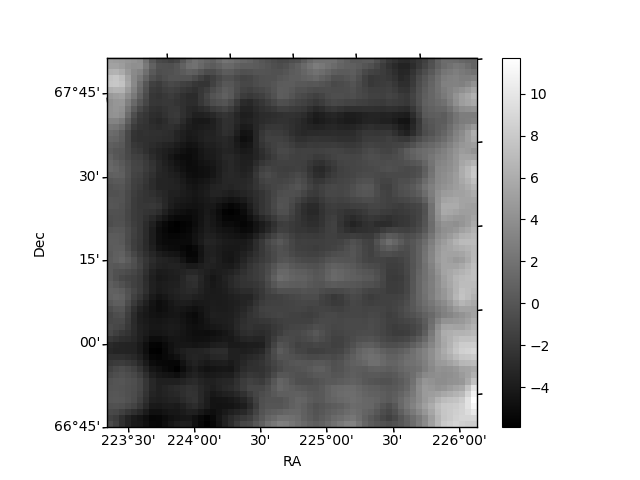
Histogram calculated using DETX and DETY for each event in the final _common_clean file
| Quadrant A | 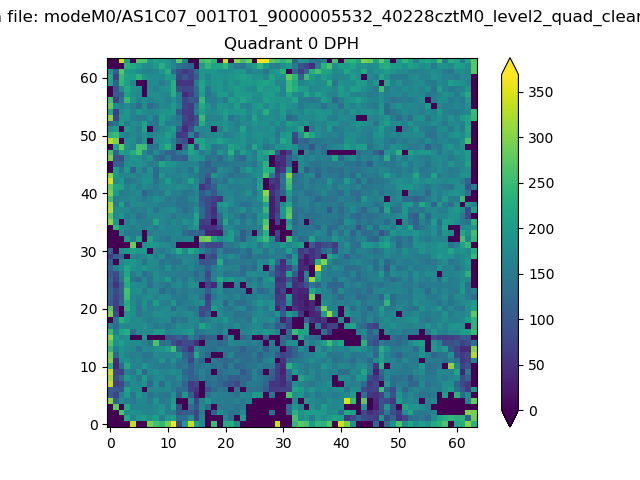 |
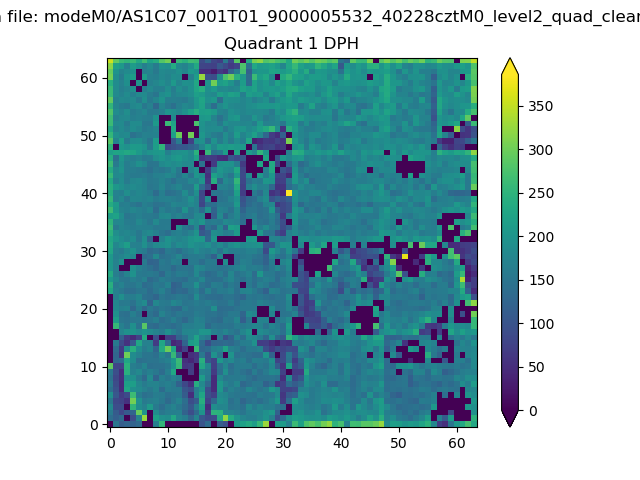 |
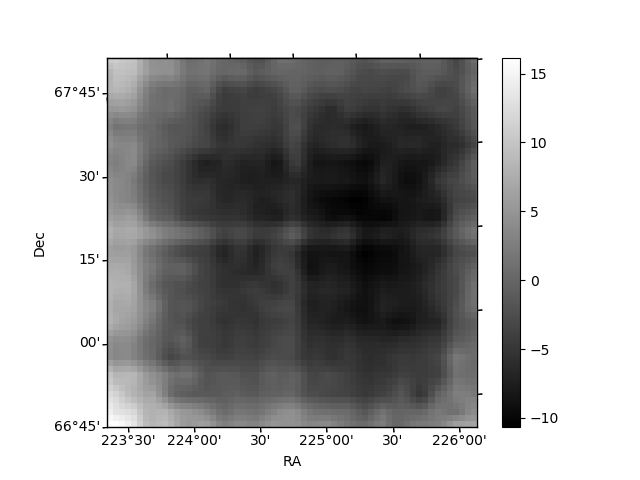
Quadrant B |
|---|---|---|---|
| Quadrant D | 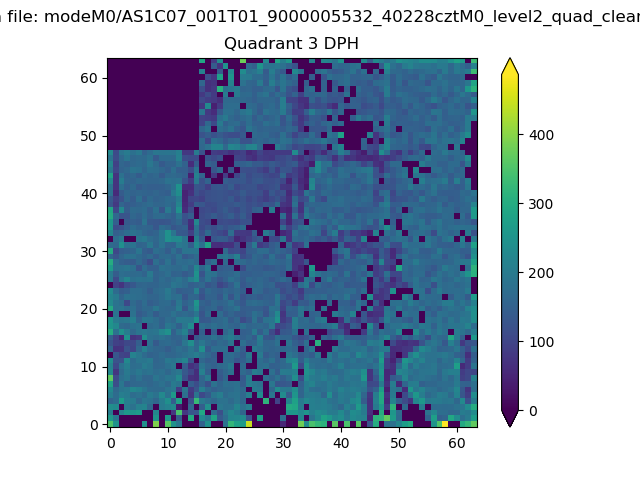 |
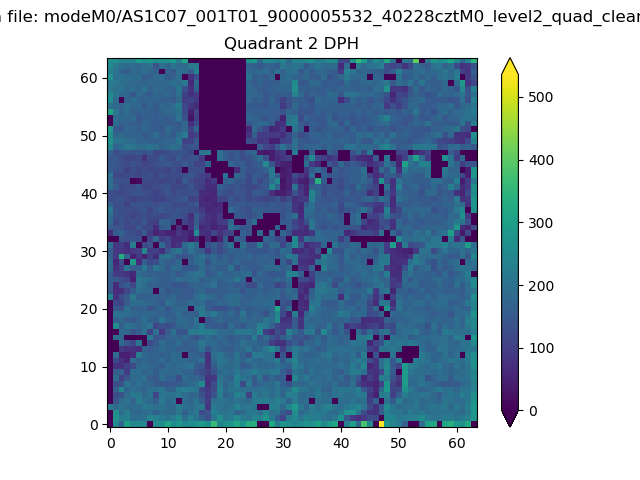 |
Quadrant C |
| Plot type | Count rate plots | Images |
|---|---|---|
| Comparison with Poisson distribution Blue bars denote a histogram of data divided into 1 sec bins. Red curve is a Poisson curve with rate = median count rate of data. |
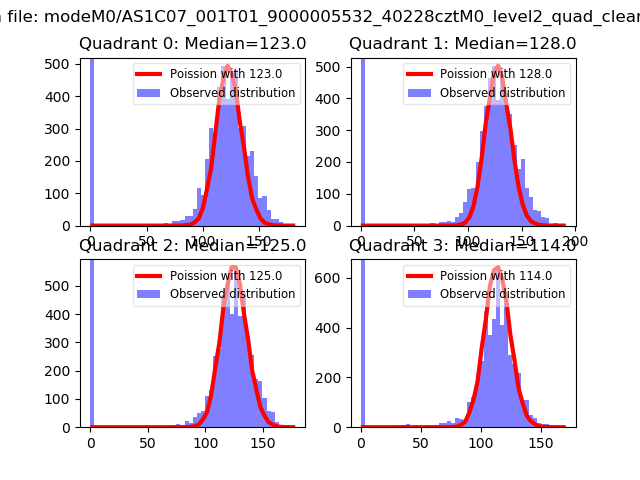 |
 |
| Quadrant-wise count rates Data is divided into 100 sec bins |
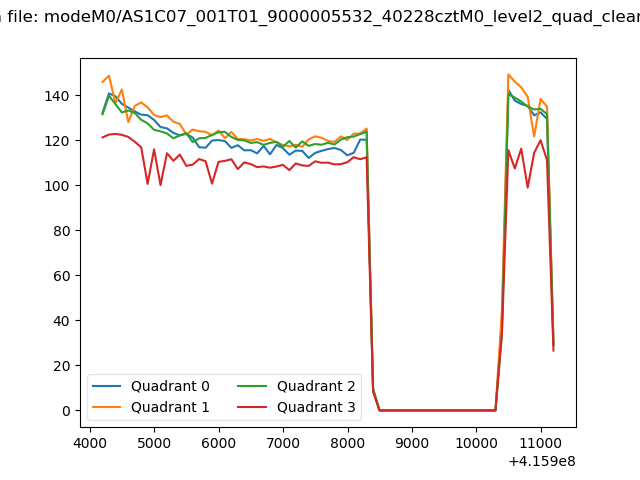 |
|
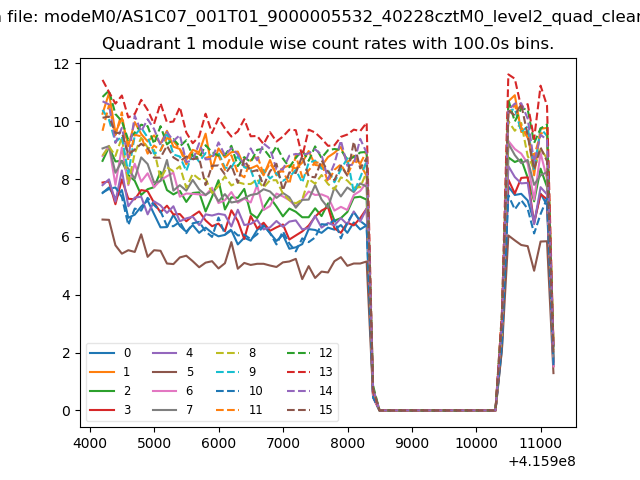
| Module-wise count rates for Quadrant A Data is divided into 100 sec bins |
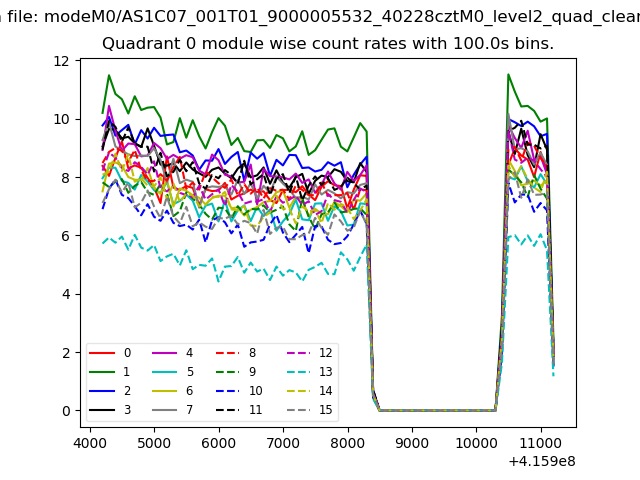 |
 |
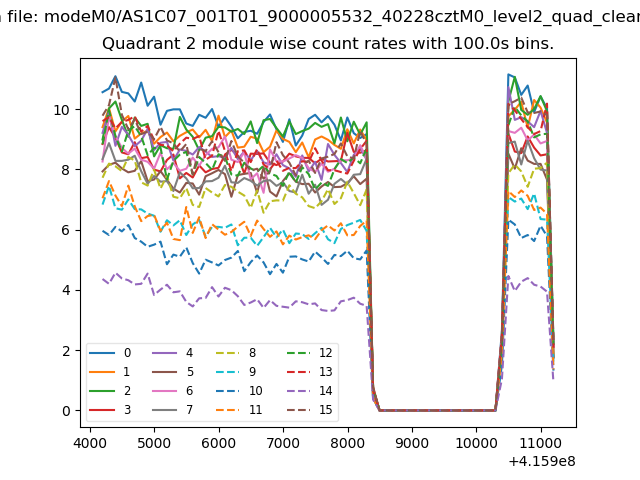
| Module-wise count rates for Quadrant B Data is divided into 100 sec bins |
 |
 |
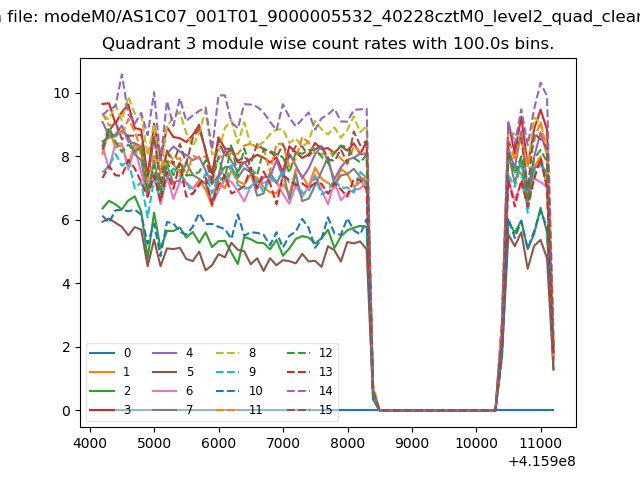
| Module-wise count rates for Quadrant C Data is divided into 100 sec bins |
 |
 |
| Module-wise count rates for Quadrant D Data is divided into 100 sec bins |
 |
 |
| Parameter | Plot |
|---|---|
| CZT HV Monitor | 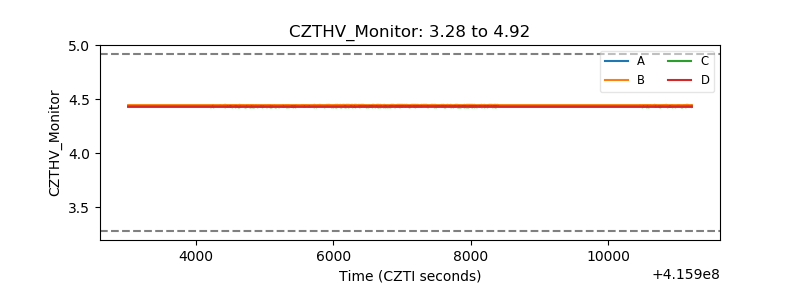 |
| D_VDD | 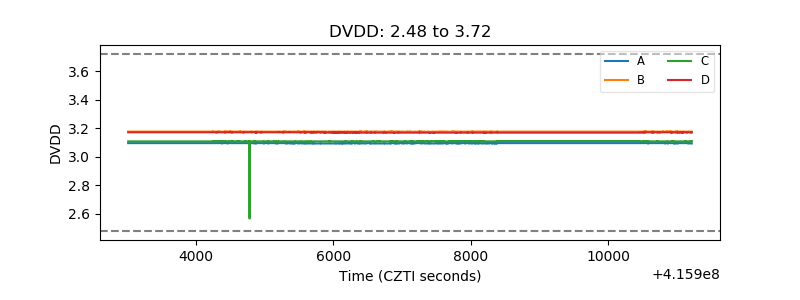 |
| Temperature 1 | 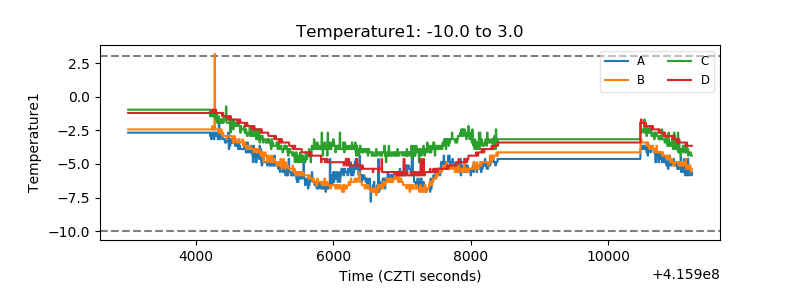 |
| Veto HV Monitor |  |
| Veto LLD | 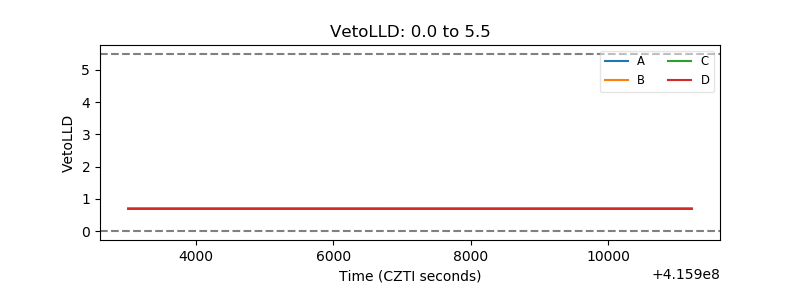 |
| Alpha Counter | 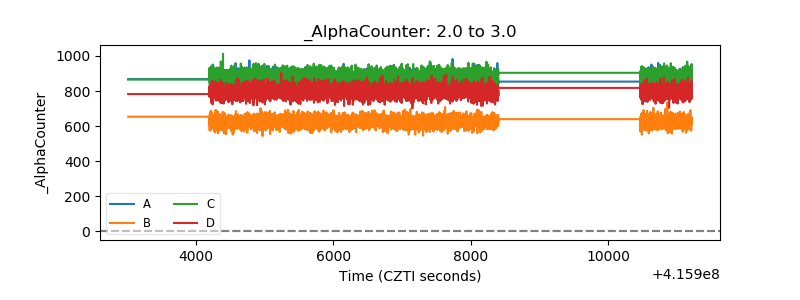 |
| _CPM_Rate | 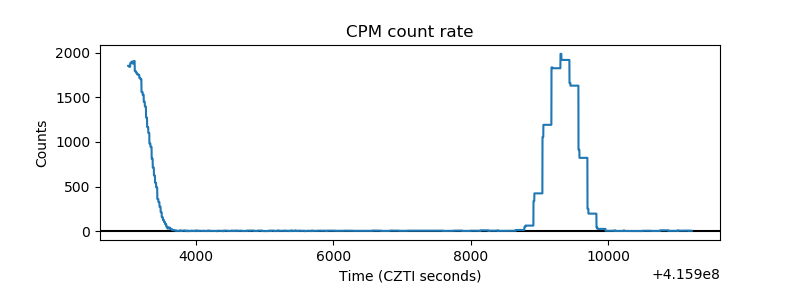 |
| CZT Counter | 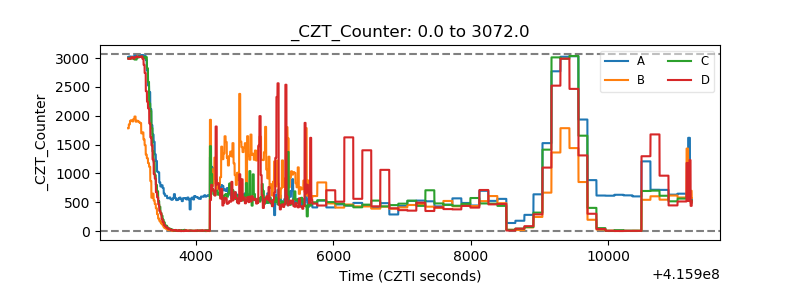 |
| +2.5 Volts monitor | 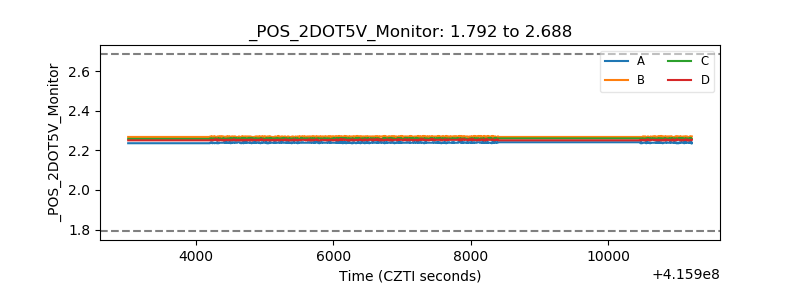 |
| +5 Volts monitor | 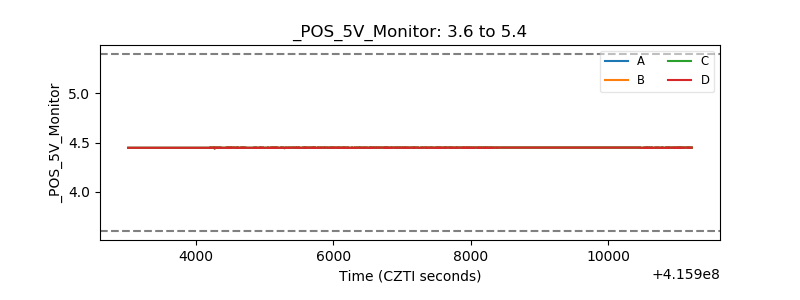 |
| _ROLL_ROT | 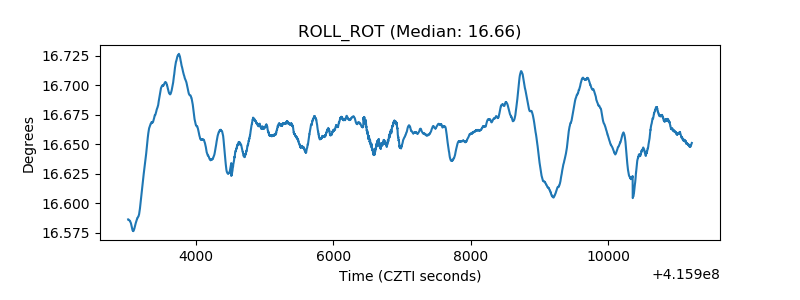 |
| _Roll_DEC | 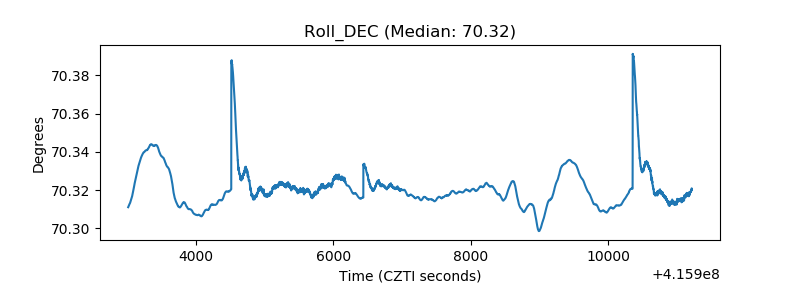 |
| _Roll_RA | 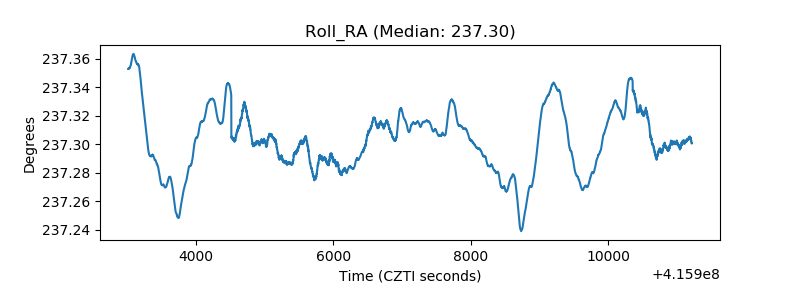 |
| Veto Counter |  |