| Param | Original file | Final file |
|---|---|---|
| Filename | modeM0/AS1C07_001T01_9000005532_40229cztM0_level2.fits | modeM0/AS1C07_001T01_9000005532_40229cztM0_level2_quad_clean.evt |
| Size (bytes) | 219,061,440 | 67,775,040 |
| Size | 208.9 MB | 64.6 MB |
| Events in quadrant A | 1,928,677 | 451,433 |
| Events in quadrant B | 1,920,241 | 465,662 |
| Events in quadrant C | 1,851,021 | 461,873 |
| Events in quadrant D | 2,118,821 | 411,430 |
| Mode M0 | |||
|---|---|---|---|
| Quadrant | BADHDUFLAG | Total packets | Discarded packets |
| A | 0 | 8167 | 1 |
| B | 0 | 8274 | 1 |
| C | 0 | 7789 | 1 |
| D | 0 | 9038 | 1 |
| Mode M9 | |||
|---|---|---|---|
| Quadrant | BADHDUFLAG | Total packets | Discarded packets |
| A | 0 | 4 | 0 |
| B | 0 | 4 | 0 |
| C | 0 | 4 | 0 |
| D | 0 | 5 | 0 |
| Mode SS | |||
|---|---|---|---|
| Quadrant | BADHDUFLAG | Total packets | Discarded packets |
| A | 0 | 74 | 0 |
| B | 0 | 74 | 0 |
| C | 0 | 74 | 0 |
| D | 0 | 74 | 0 |
| Quadrant | Total seconds | Saturated seconds | Saturation percentage |
|---|---|---|---|
| A | 3707 | 13 | 0.350688% |
| B | 3707 | 34 | 0.917184% |
| C | 3707 | 8 | 0.215808% |
| D | 3707 | 116 | 3.129215% |
Noise dominated data is calculated using 1-second bins in cleaned event files. If a bin has >2000 counts, and if more than 50% of those come from <1% of pixels, then it is considered to be noise-dominated and hence unusable.
| Quadrant | # 1 sec bins | Bins with >0 counts | Bins with >2000 counts | High rate bins dominated by noise | Noise dominated (total time) | Noise dominated (detector-on time) | Marked lightcurve |
|---|---|---|---|---|---|---|---|
| A | 3707 | 3707 | 6 | 6 | 0.16% | 0.16% | 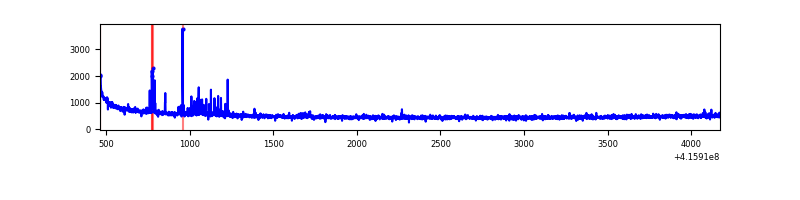 |
| B | 3707 | 3707 | 27 | 27 | 0.73% | 0.73% | 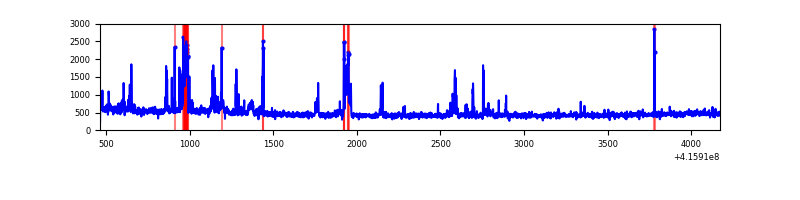 |
| C | 3707 | 3707 | 4 | 4 | 0.11% | 0.11% | 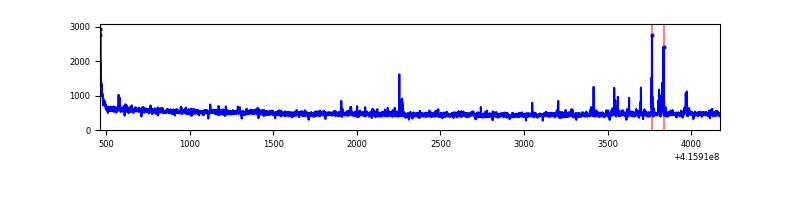 |
| D | 3707 | 3707 | 86 | 86 | 2.32% | 2.32% | 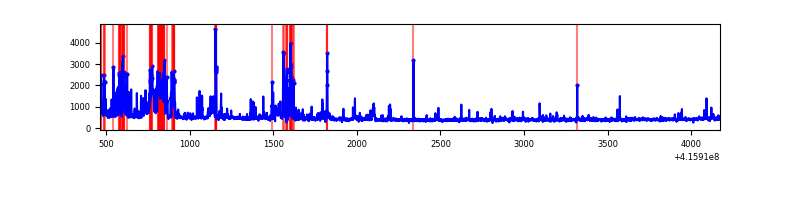 |
Top three noisy pixels from each quadrant. If the there are fewer than three noisy pixels in the level2.evt file, extra rows are filled as -1
| Pixel properties | Quadrant properties | ||||||
|---|---|---|---|---|---|---|---|
| Quadrant | DetID | PixID | Counts | Sigma | Mean | Median | Sigma |
| A | 10 | 83 | 291568 | 3485.64 | 406 | 398 | 83.5 |
| A | 13 | 248 | 47471 | 563.52 | 406 | 398 | 83.5 |
| A | 2 | 79 | 10391 | 119.63 | 406 | 398 | 83.5 |
| B | 0 | 229 | 144809 | 1841.31 | 412 | 401 | 78.4 |
| B | 5 | 255 | 110880 | 1408.69 | 412 | 401 | 78.4 |
| B | 0 | 245 | 19799 | 247.34 | 412 | 401 | 78.4 |
| C | 15 | 214 | 157921 | 1653.91 | 411 | 414 | 95.2 |
| C | 14 | 254 | 40952 | 425.67 | 411 | 414 | 95.2 |
| C | 0 | 10 | 19252 | 197.81 | 411 | 414 | 95.2 |
| D | 12 | 227 | 263417 | 2720.02 | 399 | 388 | 96.7 |
| D | 2 | 249 | 115790 | 1193.39 | 399 | 388 | 96.7 |
| D | 13 | 249 | 73662 | 757.73 | 399 | 388 | 96.7 |
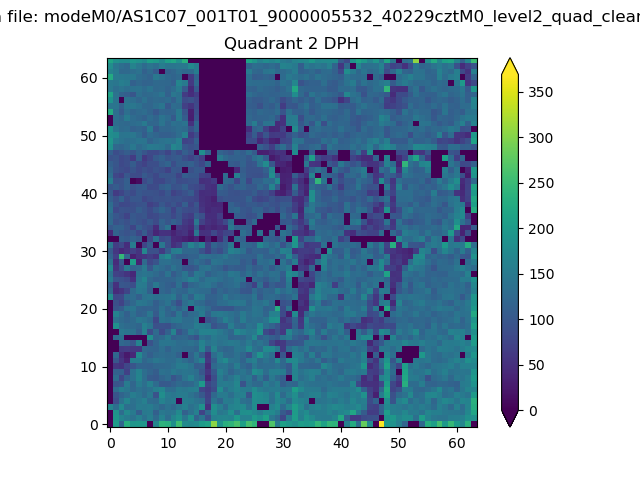
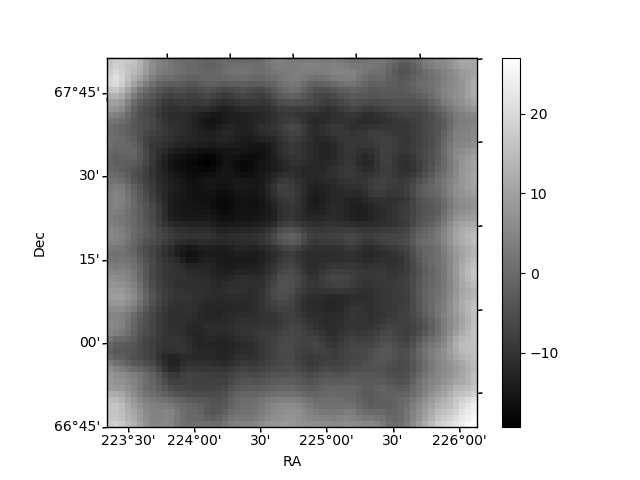
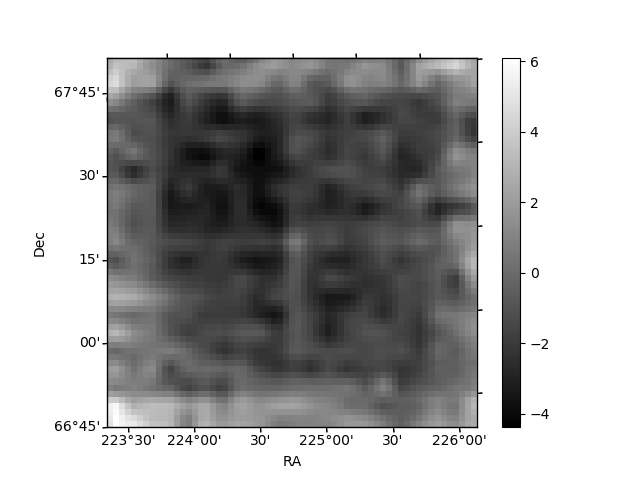
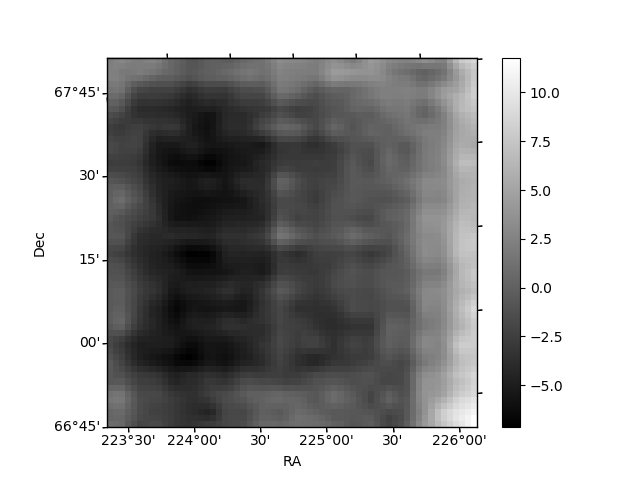
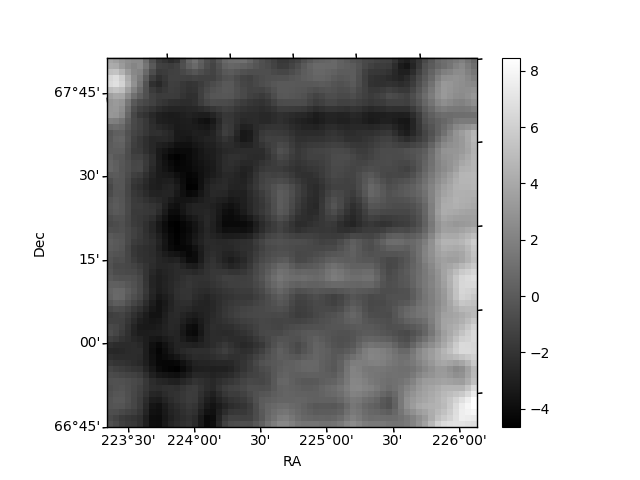
Histogram calculated using DETX and DETY for each event in the final _common_clean file
| Quadrant A | 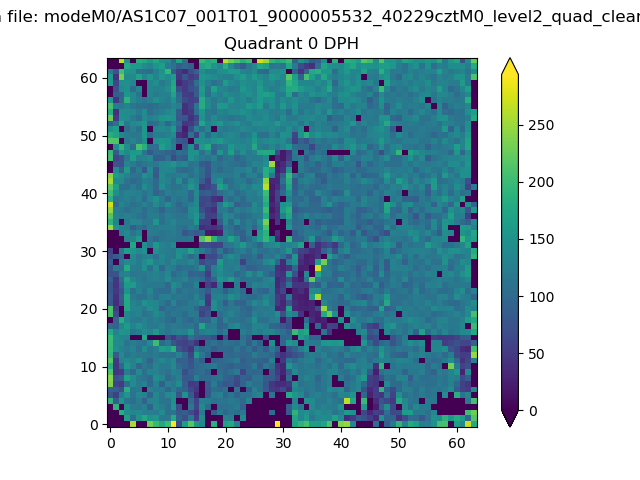 |
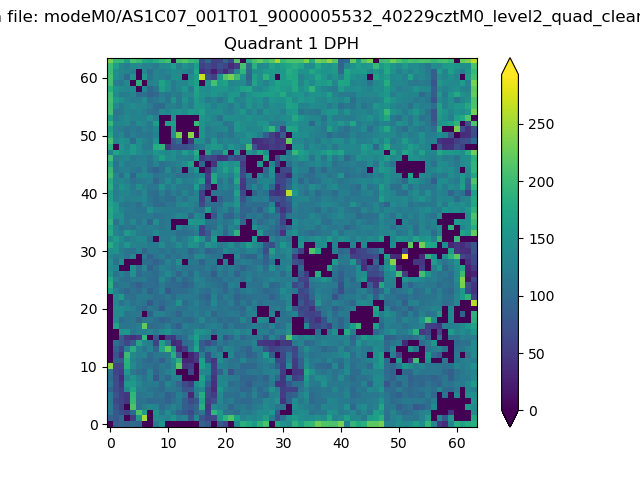 |
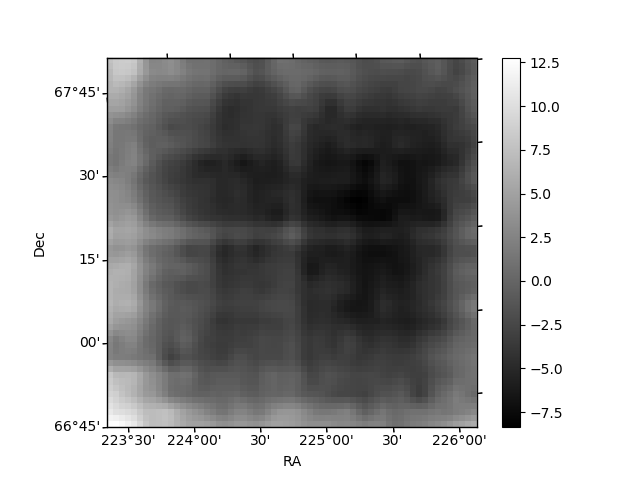
Quadrant B |
|---|---|---|---|
| Quadrant D | 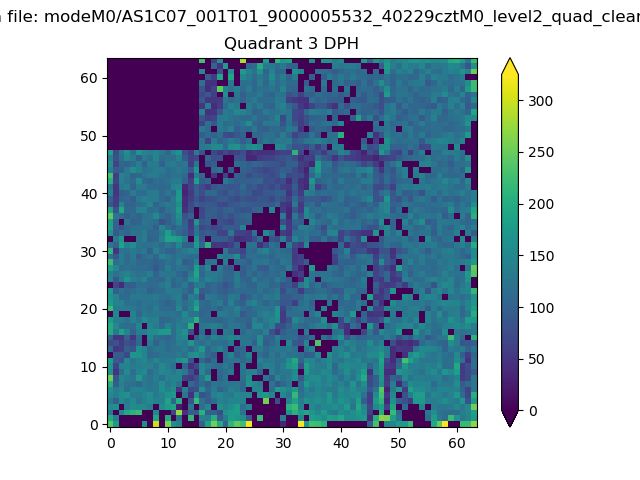 |
 |
Quadrant C |
| Plot type | Count rate plots | Images |
|---|---|---|
| Comparison with Poisson distribution Blue bars denote a histogram of data divided into 1 sec bins. Red curve is a Poisson curve with rate = median count rate of data. |
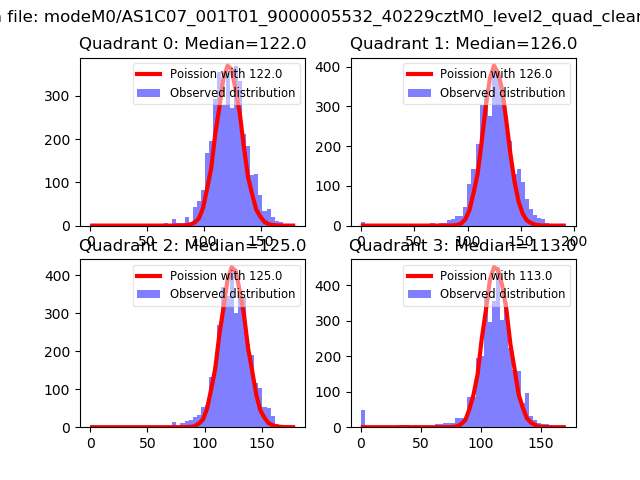 |
 |
| Quadrant-wise count rates Data is divided into 100 sec bins |
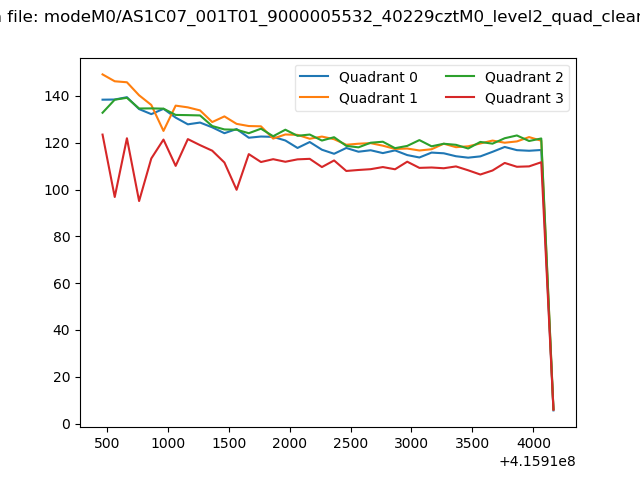 |
|
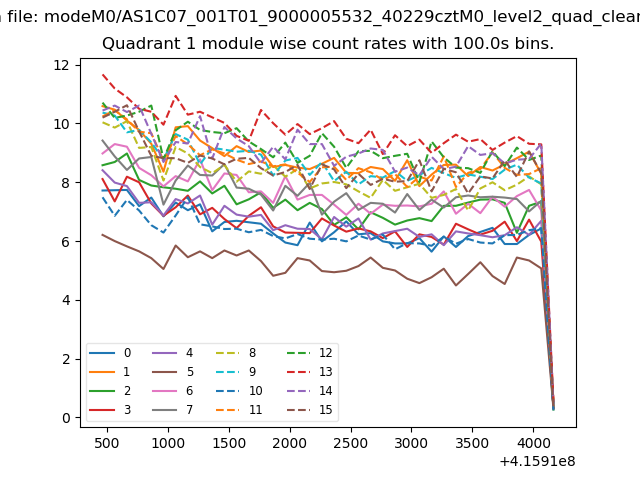
| Module-wise count rates for Quadrant A Data is divided into 100 sec bins |
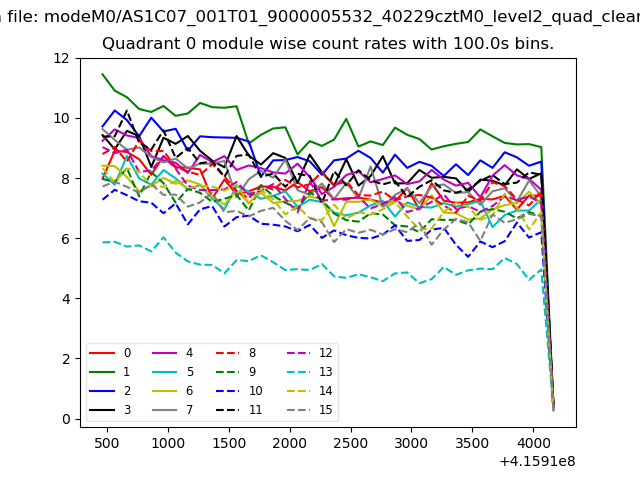 |
 |
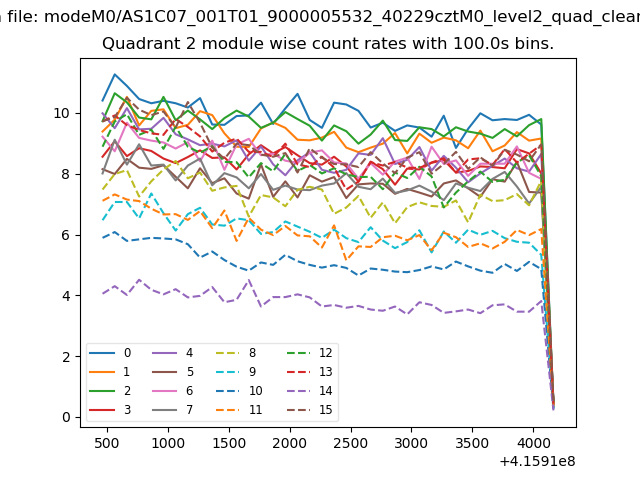
| Module-wise count rates for Quadrant B Data is divided into 100 sec bins |
 |
 |
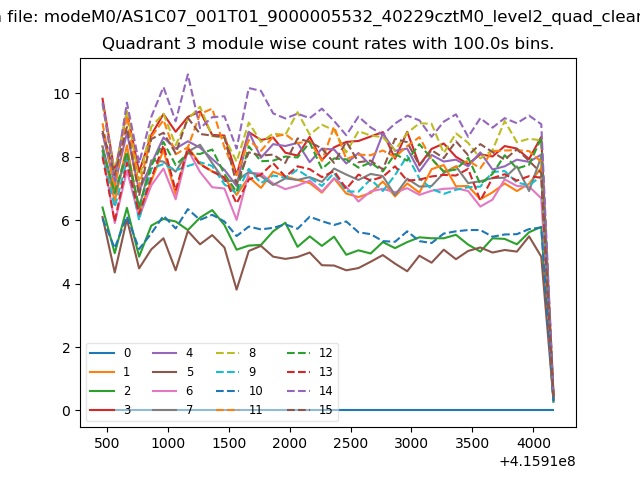
| Module-wise count rates for Quadrant C Data is divided into 100 sec bins |
 |
 |
| Module-wise count rates for Quadrant D Data is divided into 100 sec bins |
 |
 |
| Parameter | Plot |
|---|---|
| CZT HV Monitor |  |
| D_VDD | 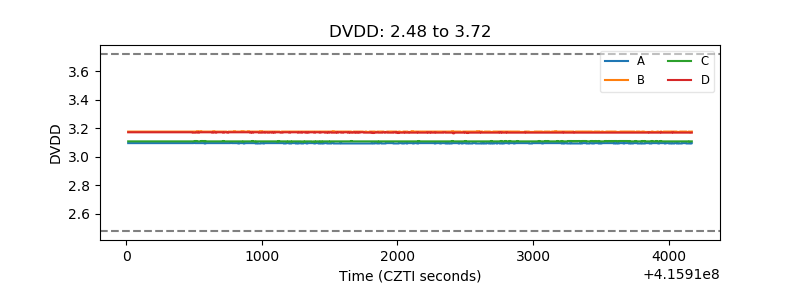 |
| Temperature 1 | 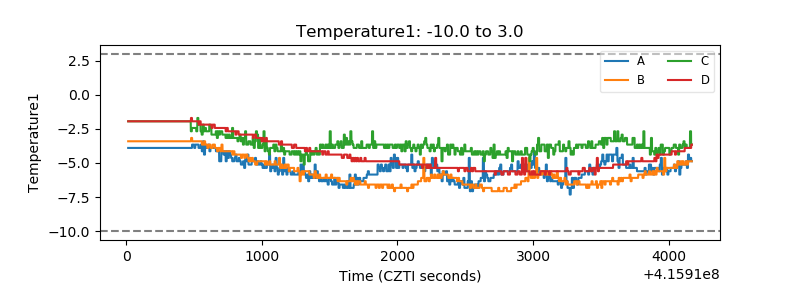 |
| Veto HV Monitor | 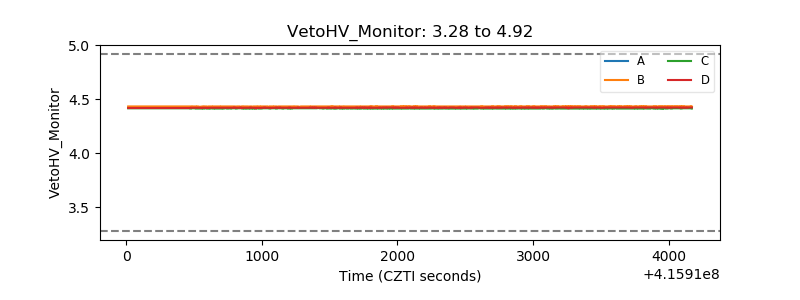 |
| Veto LLD | 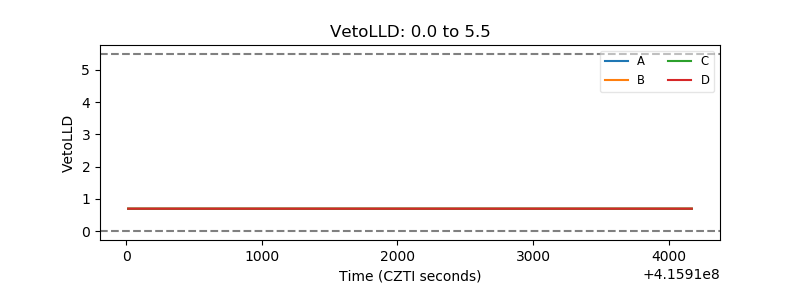 |
| Alpha Counter | 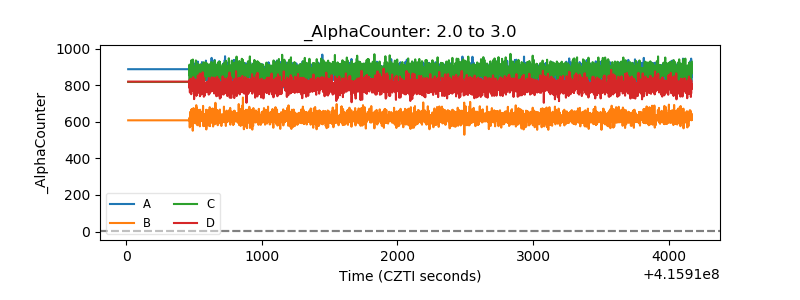 |
| _CPM_Rate | 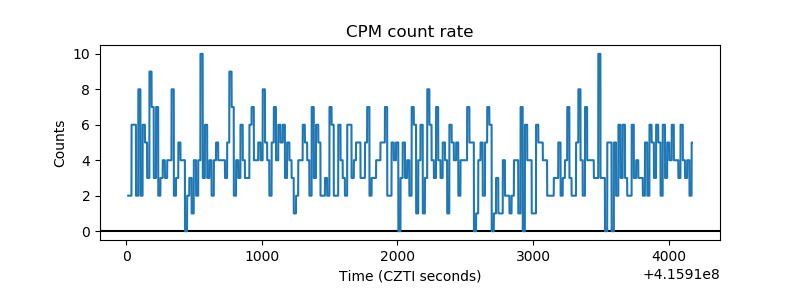 |
| CZT Counter | 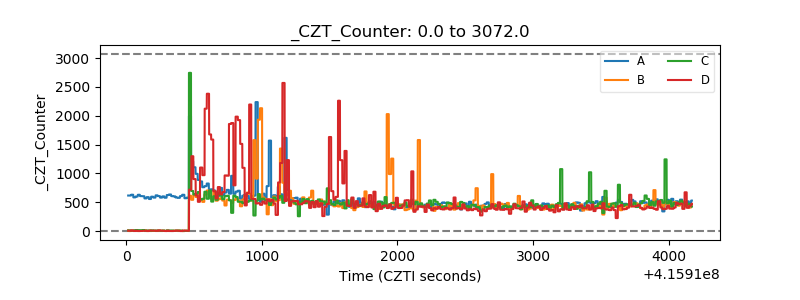 |
| +2.5 Volts monitor | 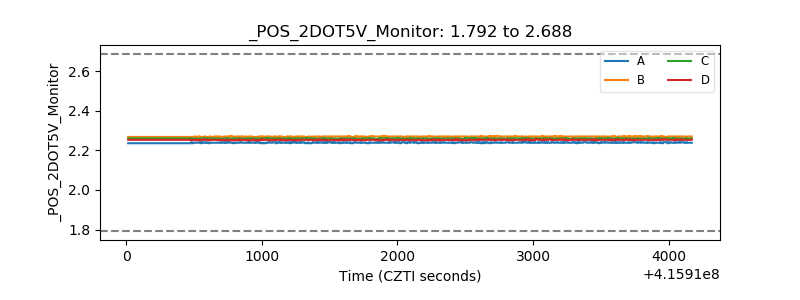 |
| +5 Volts monitor | 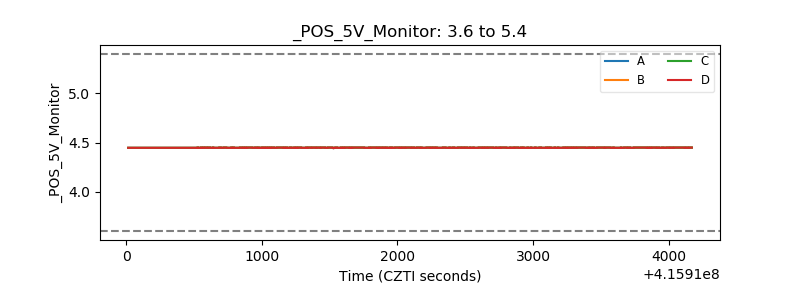 |
| _ROLL_ROT | 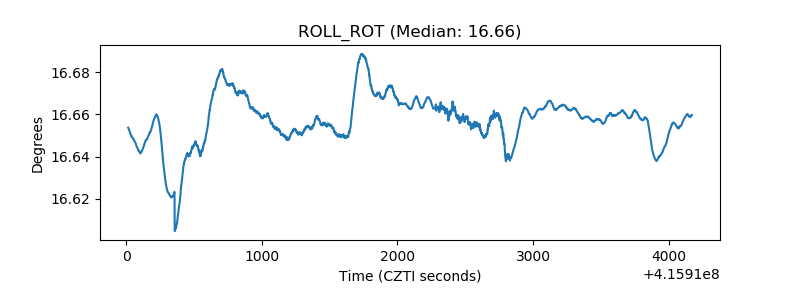 |
| _Roll_DEC | 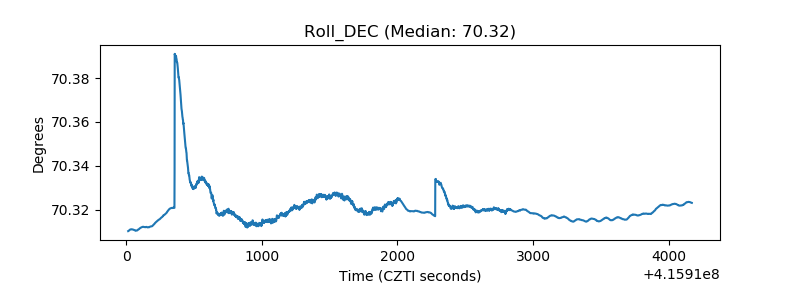 |
| _Roll_RA | 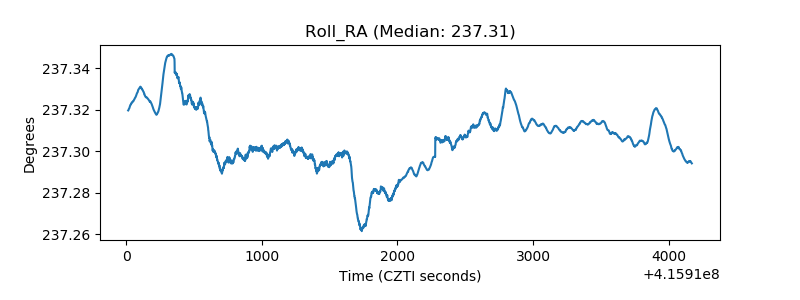 |
| Veto Counter | 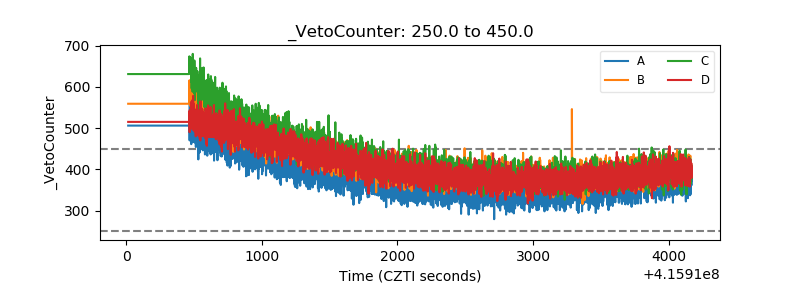 |