| Param | Original file | Final file |
|---|---|---|
| Filename | modeM0/AS1T05_086T01_9000005534_40230cztM0_level2.fits | modeM0/AS1T05_086T01_9000005534_40230cztM0_level2_quad_clean.evt |
| Size (bytes) | 77,601,600 | 17,801,280 |
| Size | 74.0 MB | 17.0 MB |
| Events in quadrant A | 688,677 | 106,783 |
| Events in quadrant B | 650,297 | 124,358 |
| Events in quadrant C | 725,973 | 117,962 |
| Events in quadrant D | 703,423 | 92,825 |
| Mode M0 | |||
|---|---|---|---|
| Quadrant | BADHDUFLAG | Total packets | Discarded packets |
| A | 0 | 11045 | 8320 |
| B | 0 | 10384 | 7627 |
| C | 0 | 10175 | 7250 |
| D | 0 | 12544 | 9688 |
| Mode M9 | |||
|---|---|---|---|
| Quadrant | BADHDUFLAG | Total packets | Discarded packets |
| A | 0 | 36 | 15 |
| B | 0 | 34 | 16 |
| C | 0 | 29 | 14 |
| D | 0 | 37 | 15 |
| Mode SS | |||
|---|---|---|---|
| Quadrant | BADHDUFLAG | Total packets | Discarded packets |
| A | 0 | 105 | 72 |
| B | 0 | 106 | 76 |
| C | 0 | 107 | 81 |
| D | 0 | 107 | 77 |
| Quadrant | Total seconds | Saturated seconds | Saturation percentage |
|---|---|---|---|
| A | 1243 | 6 | 0.482703% |
| B | 1342 | 3 | 0.223547% |
| C | 1379 | 6 | 0.435098% |
| D | 1174 | 7 | 0.596252% |
Noise dominated data is calculated using 1-second bins in cleaned event files. If a bin has >2000 counts, and if more than 50% of those come from <1% of pixels, then it is considered to be noise-dominated and hence unusable.
| Quadrant | # 1 sec bins | Bins with >0 counts | Bins with >2000 counts | High rate bins dominated by noise | Noise dominated (total time) | Noise dominated (detector-on time) | Marked lightcurve |
|---|---|---|---|---|---|---|---|
| A | 7070 | 1833 | 3 | 3 | 0.04% | 0.16% | 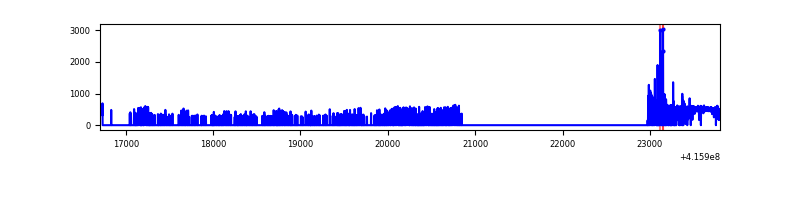 |
| B | 7098 | 1924 | 0 | 0 | 0.00% | 0.00% | 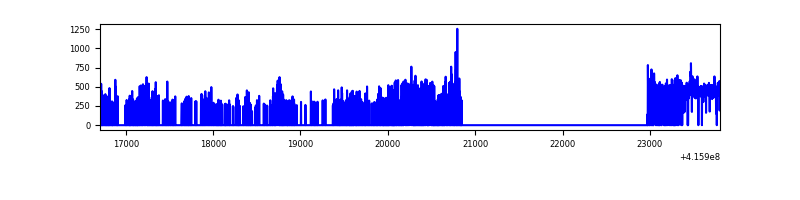 |
| C | 7034 | 2020 | 4 | 4 | 0.06% | 0.20% | 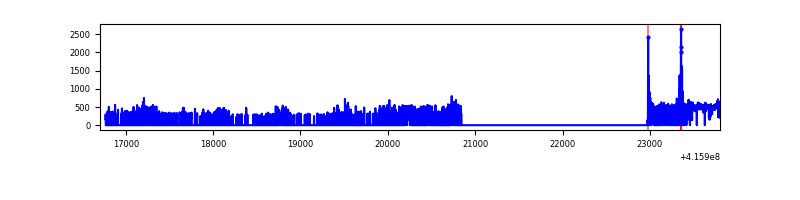 |
| D | 7083 | 1681 | 2 | 2 | 0.03% | 0.12% | 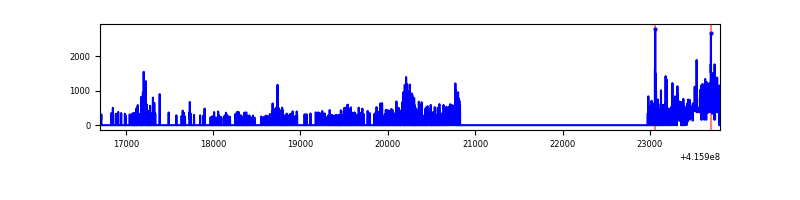 |
Top three noisy pixels from each quadrant. If the there are fewer than three noisy pixels in the level2.evt file, extra rows are filled as -1
| Pixel properties | Quadrant properties | ||||||
|---|---|---|---|---|---|---|---|
| Quadrant | DetID | PixID | Counts | Sigma | Mean | Median | Sigma |
| A | 10 | 83 | 111478 | 3557.7 | 141 | 137 | 31.3 |
| A | 13 | 248 | 31250 | 994.16 | 141 | 137 | 31.3 |
| A | 13 | 254 | 1718 | 50.52 | 141 | 137 | 31.3 |
| B | 0 | 229 | 22741 | 698.28 | 155 | 151 | 32.4 |
| B | 0 | 245 | 9336 | 283.92 | 155 | 151 | 32.4 |
| B | 0 | 230 | 3920 | 116.5 | 155 | 151 | 32.4 |
| C | 15 | 214 | 61128 | 1573.07 | 156 | 157 | 38.8 |
| C | 14 | 254 | 24662 | 632.24 | 156 | 157 | 38.8 |
| C | 9 | 187 | 15720 | 401.53 | 156 | 157 | 38.8 |
| D | 12 | 227 | 133341 | 3994.54 | 130 | 126 | 33.3 |
| D | 13 | 249 | 34272 | 1023.89 | 130 | 126 | 33.3 |
| D | 2 | 249 | 15959 | 474.76 | 130 | 126 | 33.3 |
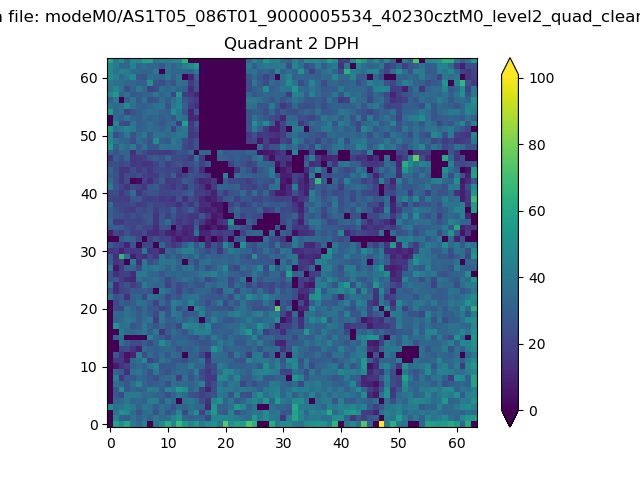
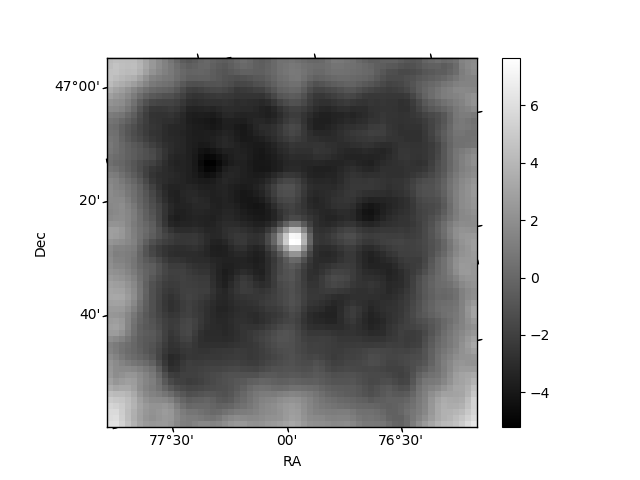
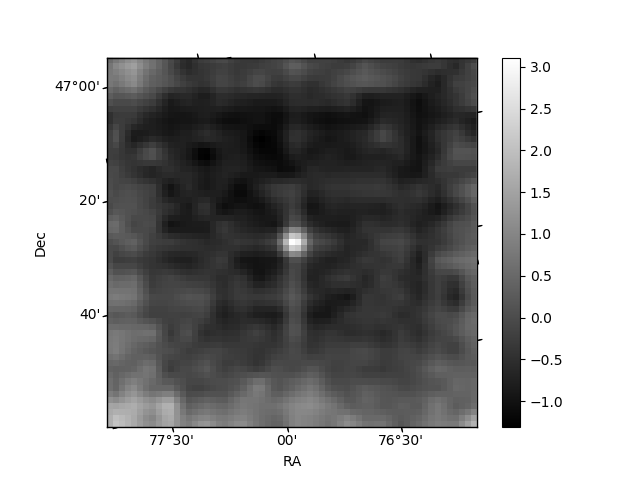
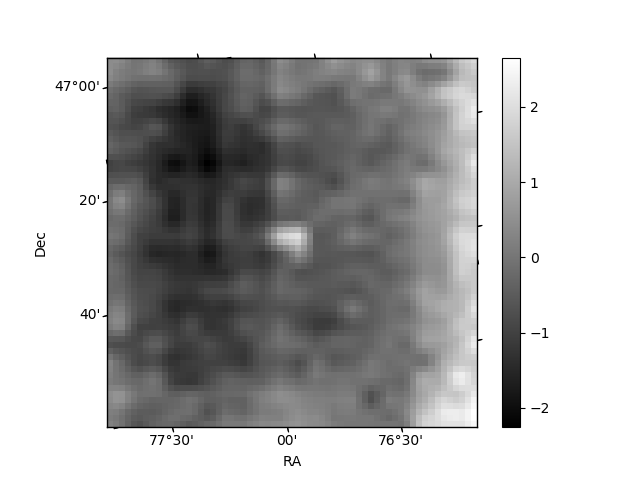
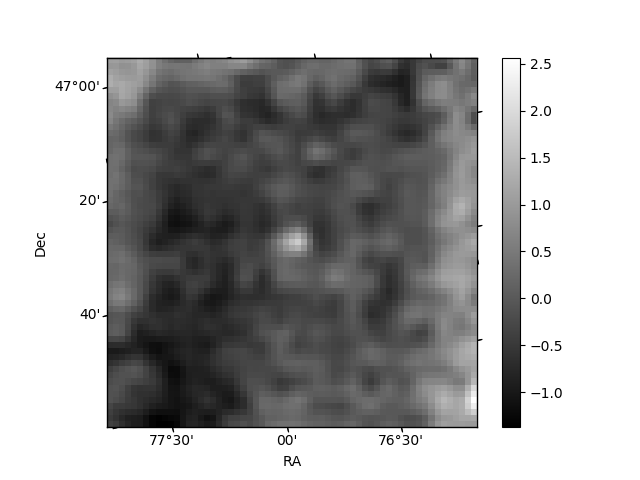
Histogram calculated using DETX and DETY for each event in the final _common_clean file
| Quadrant A | 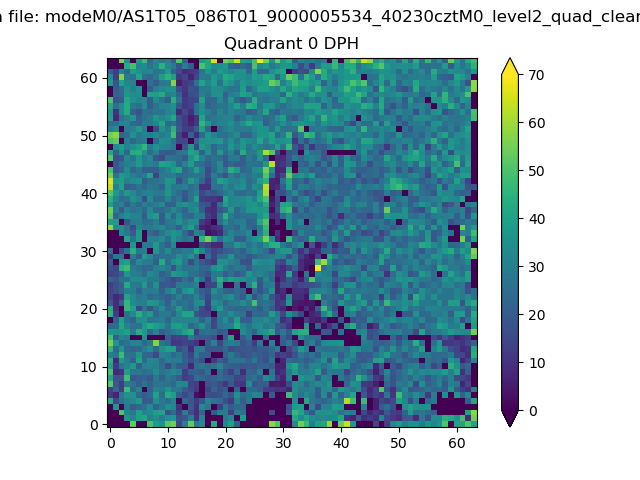 |
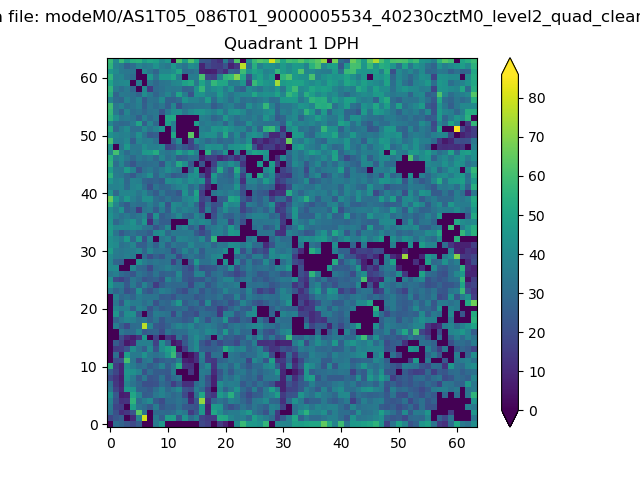 |
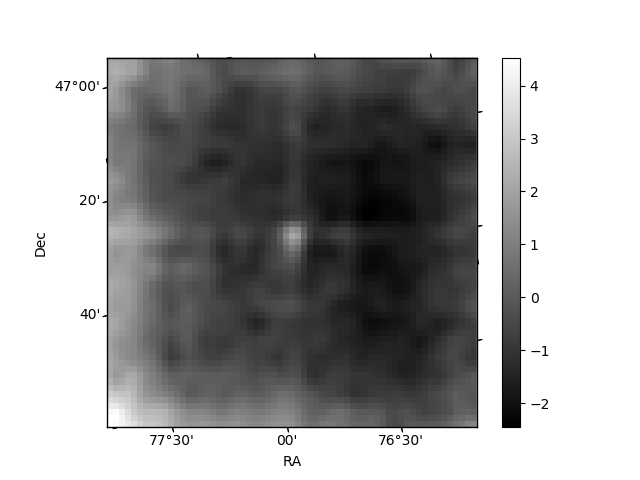
Quadrant B |
|---|---|---|---|
| Quadrant D | 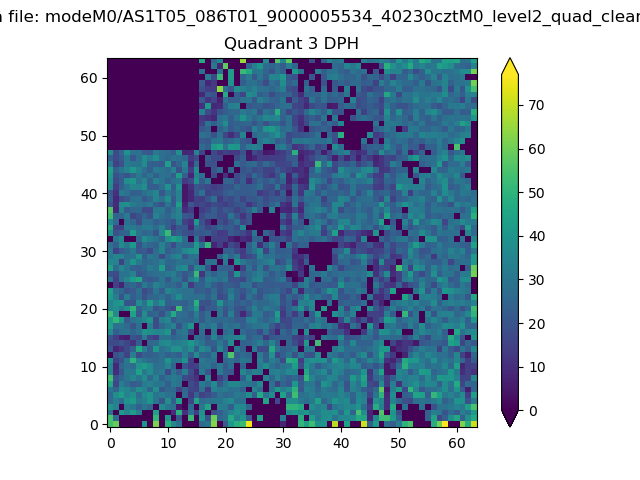 |
 |
Quadrant C |
| Plot type | Count rate plots | Images |
|---|---|---|
| Comparison with Poisson distribution Blue bars denote a histogram of data divided into 1 sec bins. Red curve is a Poisson curve with rate = median count rate of data. |
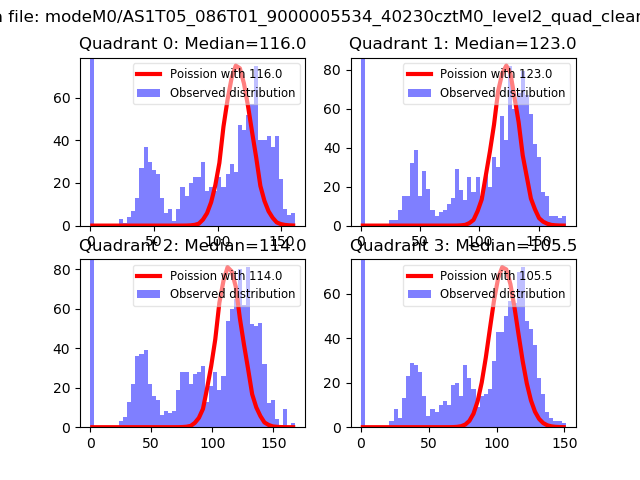 |
 |
| Quadrant-wise count rates Data is divided into 100 sec bins |
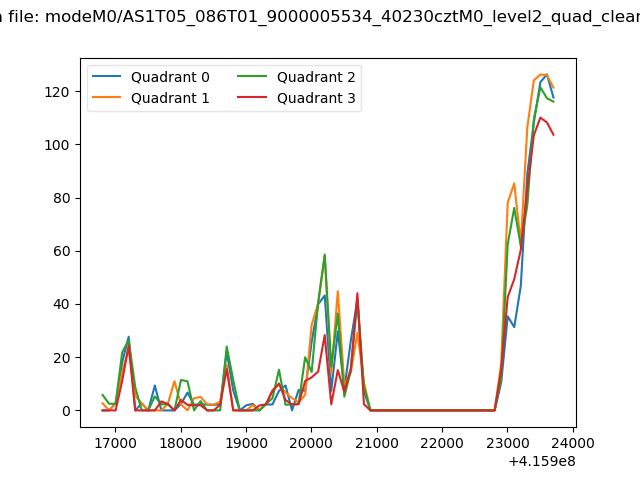 |
|
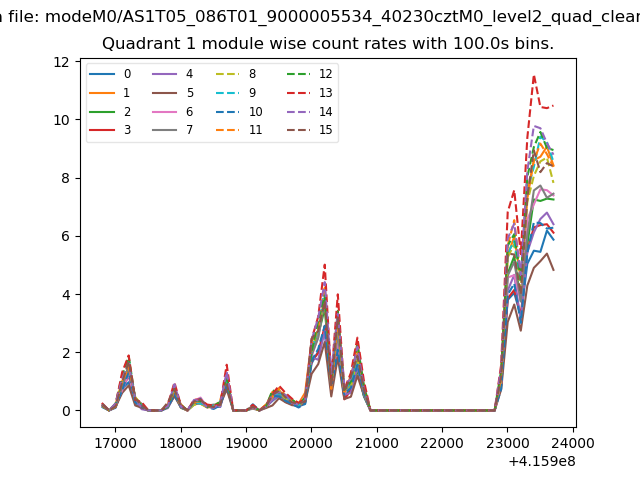
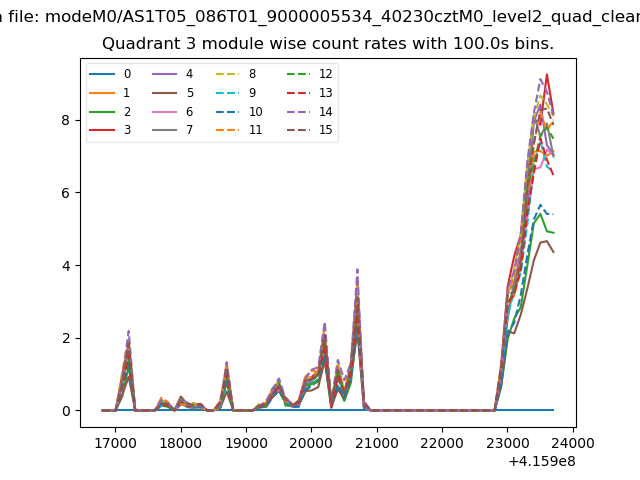
| Module-wise count rates for Quadrant A Data is divided into 100 sec bins |
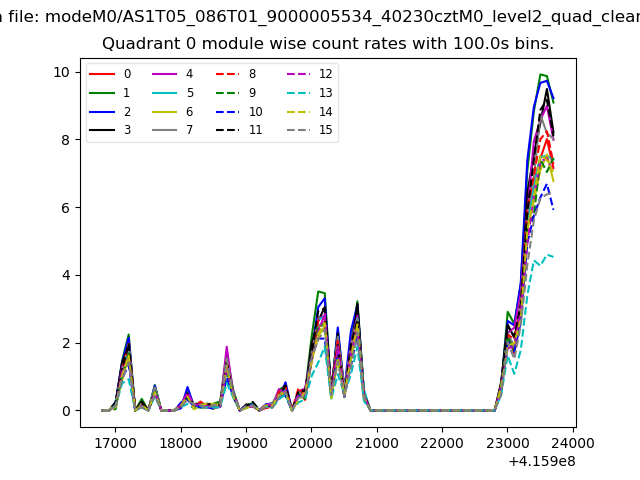 |
 |
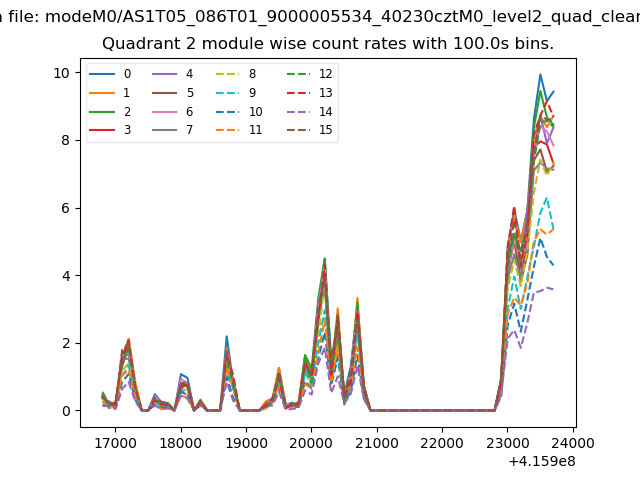
| Module-wise count rates for Quadrant B Data is divided into 100 sec bins |
 |
 |
| Module-wise count rates for Quadrant C Data is divided into 100 sec bins |
 |
 |
| Module-wise count rates for Quadrant D Data is divided into 100 sec bins |
 |
 |
| Parameter | Plot |
|---|---|
| CZT HV Monitor | 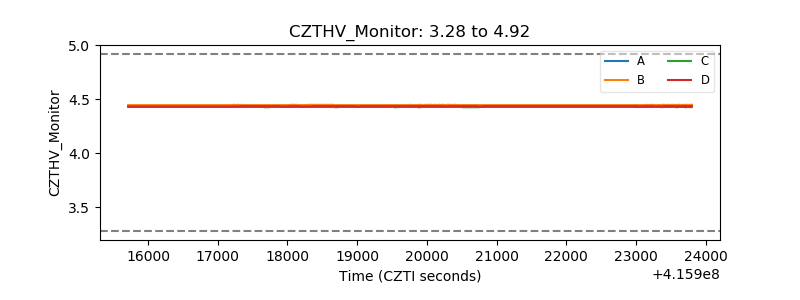 |
| D_VDD | 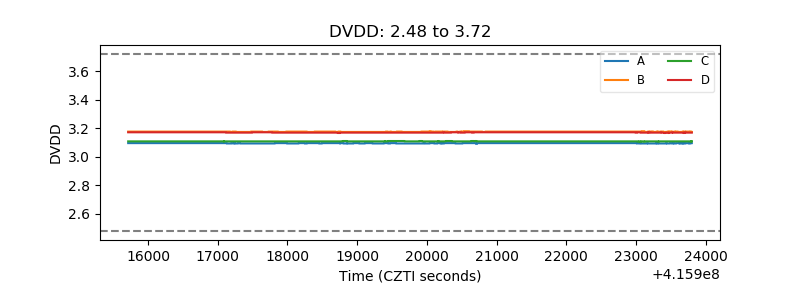 |
| Temperature 1 | 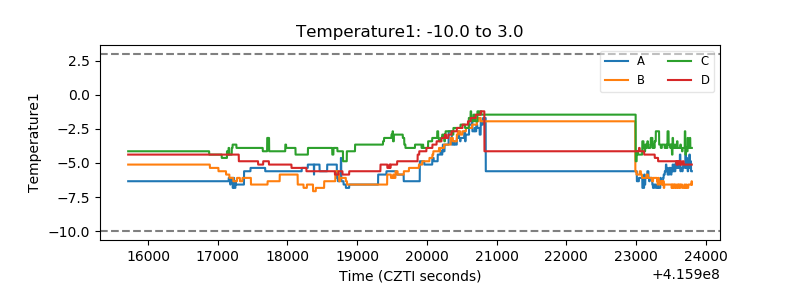 |
| Veto HV Monitor | 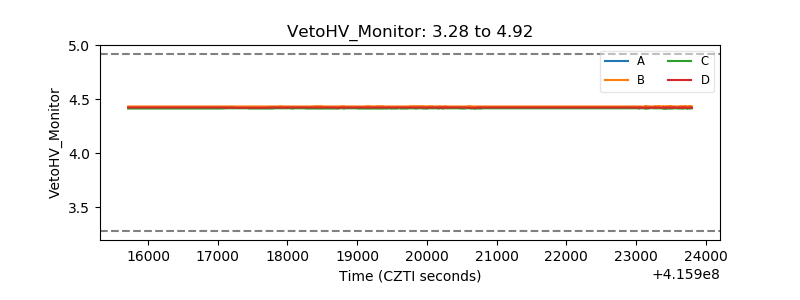 |
| Veto LLD | 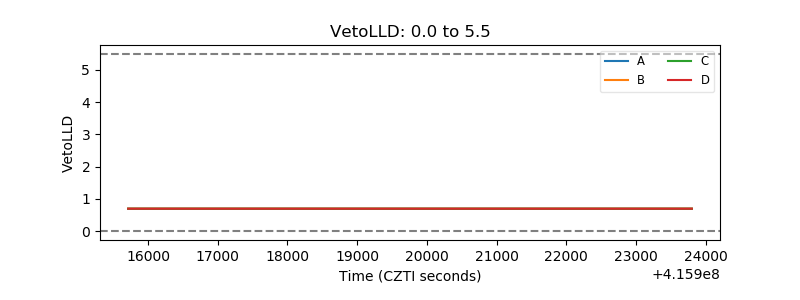 |
| Alpha Counter | 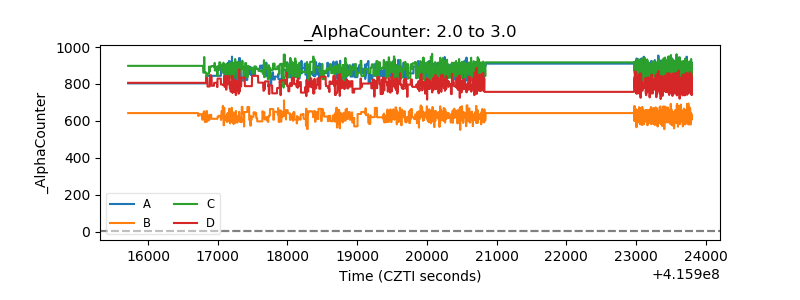 |
| _CPM_Rate | 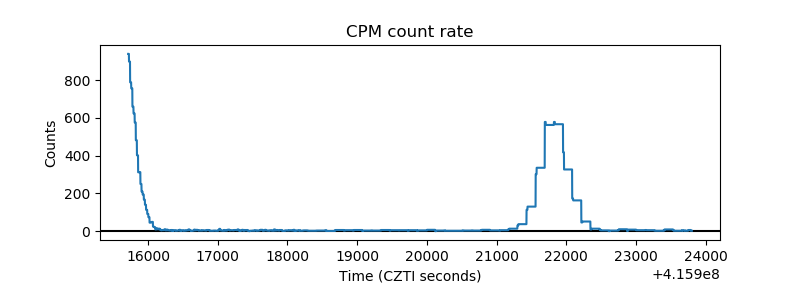 |
| CZT Counter | 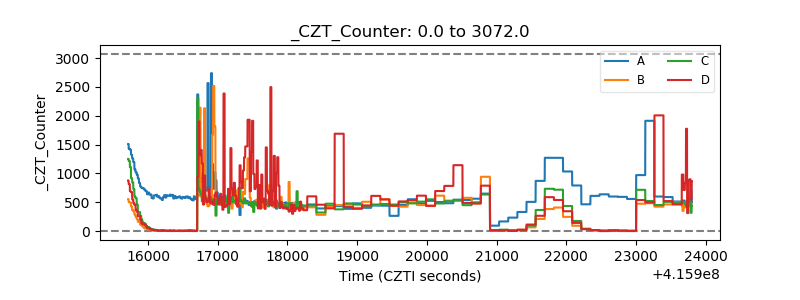 |
| +2.5 Volts monitor | 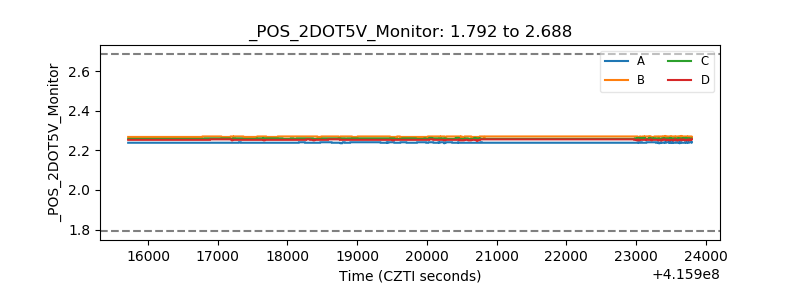 |
| +5 Volts monitor | 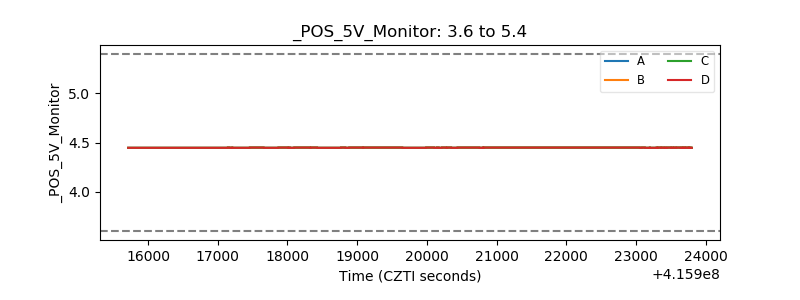 |
| _ROLL_ROT | 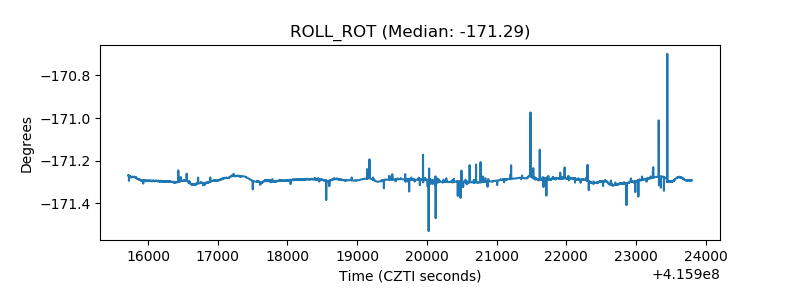 |
| _Roll_DEC | 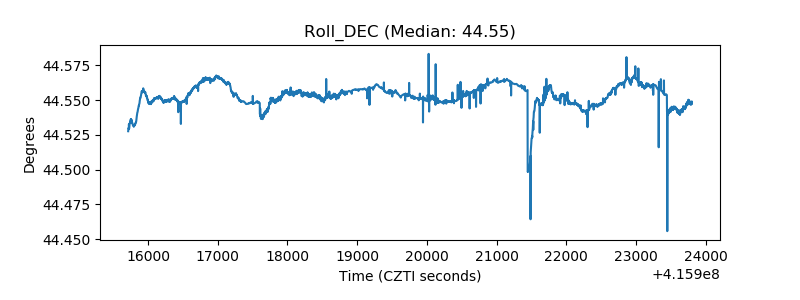 |
| _Roll_RA | 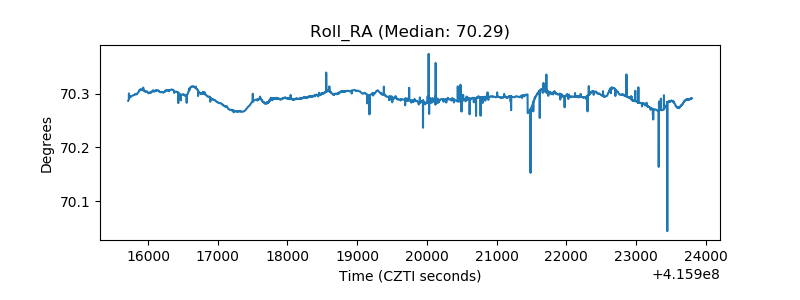 |
| Veto Counter | 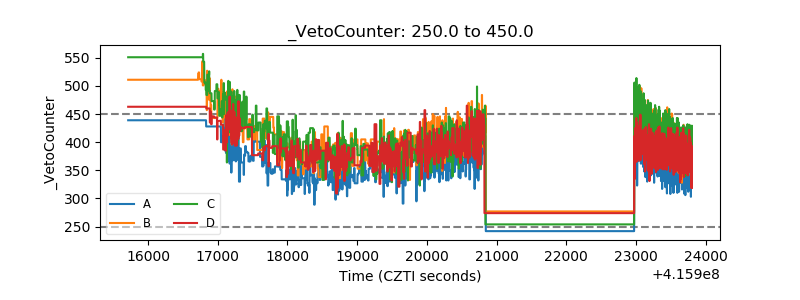 |