| Param | Original file | Final file |
|---|---|---|
| Filename | modeM0/AS1T05_086T01_9000005534_40231cztM0_level2.fits | modeM0/AS1T05_086T01_9000005534_40231cztM0_level2_quad_clean.evt |
| Size (bytes) | 237,257,280 | 46,506,240 |
| Size | 226.3 MB | 44.4 MB |
| Events in quadrant A | 1,563,755 | 337,557 |
| Events in quadrant B | 1,588,696 | 346,807 |
| Events in quadrant C | 1,368,768 | 334,456 |
| Events in quadrant D | 4,039,446 | 187,852 |
| Mode M0 | |||
|---|---|---|---|
| Quadrant | BADHDUFLAG | Total packets | Discarded packets |
| A | 0 | 6270 | 6 |
| B | 0 | 6554 | 12 |
| C | 0 | 5744 | 8 |
| D | 0 | 13959 | 10 |
| Mode M9 | |||
|---|---|---|---|
| Quadrant | BADHDUFLAG | Total packets | Discarded packets |
| A | 0 | 21 | 0 |
| B | 0 | 21 | 0 |
| C | 0 | 21 | 0 |
| D | 0 | 21 | 0 |
| Mode SS | |||
|---|---|---|---|
| Quadrant | BADHDUFLAG | Total packets | Discarded packets |
| A | 0 | 58 | 0 |
| B | 0 | 58 | 0 |
| C | 0 | 58 | 0 |
| D | 0 | 58 | 0 |
| Quadrant | Total seconds | Saturated seconds | Saturation percentage |
|---|---|---|---|
| A | 2827 | 17 | 0.601344% |
| B | 2821 | 41 | 1.453385% |
| C | 2825 | 6 | 0.212389% |
| D | 2825 | 1057 | 37.415929% |
Noise dominated data is calculated using 1-second bins in cleaned event files. If a bin has >2000 counts, and if more than 50% of those come from <1% of pixels, then it is considered to be noise-dominated and hence unusable.
| Quadrant | # 1 sec bins | Bins with >0 counts | Bins with >2000 counts | High rate bins dominated by noise | Noise dominated (total time) | Noise dominated (detector-on time) | Marked lightcurve |
|---|---|---|---|---|---|---|---|
| A | 4865 | 2833 | 8 | 8 | 0.16% | 0.28% | 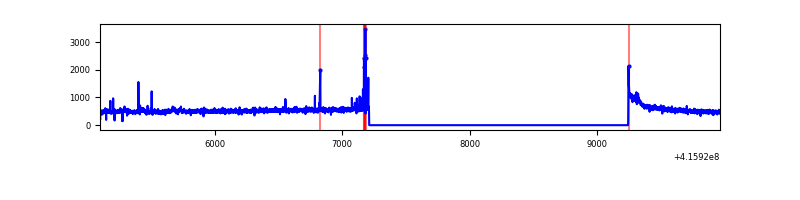 |
| B | 4865 | 2831 | 18 | 18 | 0.37% | 0.64% | 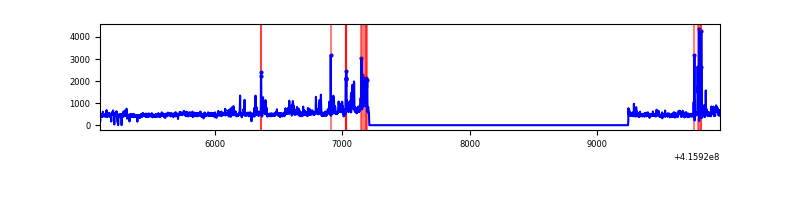 |
| C | 4865 | 2833 | 2 | 2 | 0.04% | 0.07% | 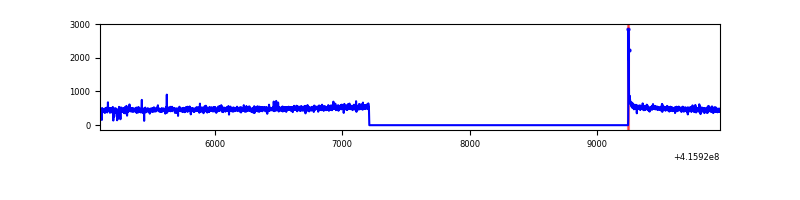 |
| D | 4865 | 2831 | 1028 | 1028 | 21.13% | 36.31% | 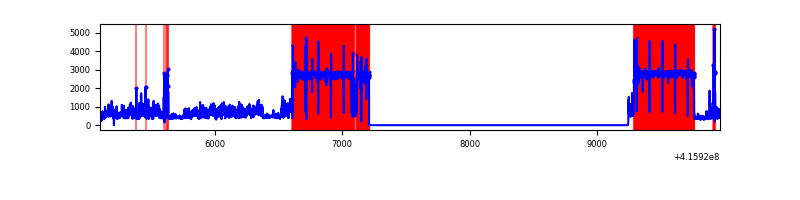 |
Top three noisy pixels from each quadrant. If the there are fewer than three noisy pixels in the level2.evt file, extra rows are filled as -1
| Pixel properties | Quadrant properties | ||||||
|---|---|---|---|---|---|---|---|
| Quadrant | DetID | PixID | Counts | Sigma | Mean | Median | Sigma |
| A | 10 | 83 | 235203 | 3510.66 | 322 | 317 | 66.9 |
| A | 13 | 248 | 23873 | 352.07 | 322 | 317 | 66.9 |
| A | 13 | 252 | 17454 | 256.13 | 322 | 317 | 66.9 |
| B | 0 | 229 | 197549 | 3077.58 | 319 | 310 | 64.1 |
| B | 0 | 245 | 71229 | 1106.57 | 319 | 310 | 64.1 |
| B | 5 | 255 | 33280 | 514.44 | 319 | 310 | 64.1 |
| C | 15 | 214 | 121730 | 1642.42 | 312 | 313 | 73.9 |
| C | 0 | 10 | 12259 | 161.59 | 312 | 313 | 73.9 |
| C | 9 | 187 | 6064 | 77.79 | 312 | 313 | 73.9 |
| D | 12 | 227 | 3168211 | 57614.59 | 217 | 211 | 55.0 |
| D | 13 | 249 | 20380 | 366.8 | 217 | 211 | 55.0 |
| D | 9 | 19 | 8904 | 158.09 | 217 | 211 | 55.0 |
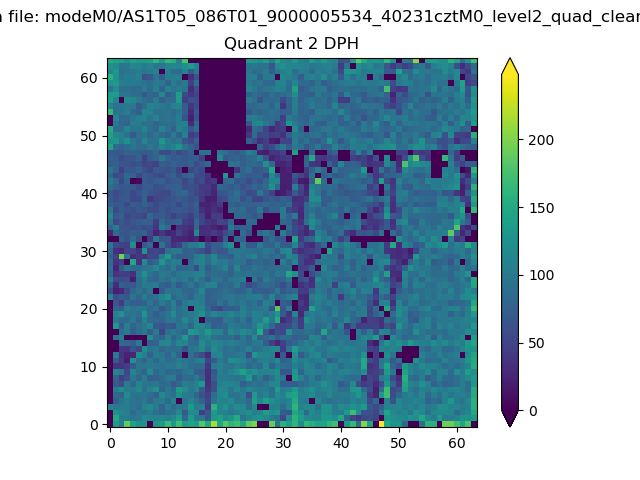
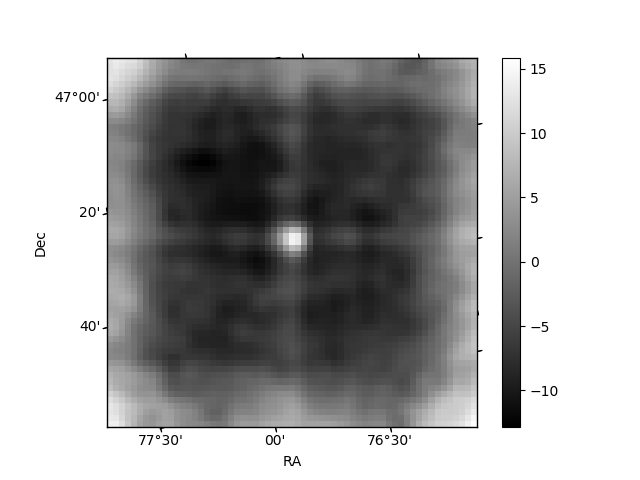
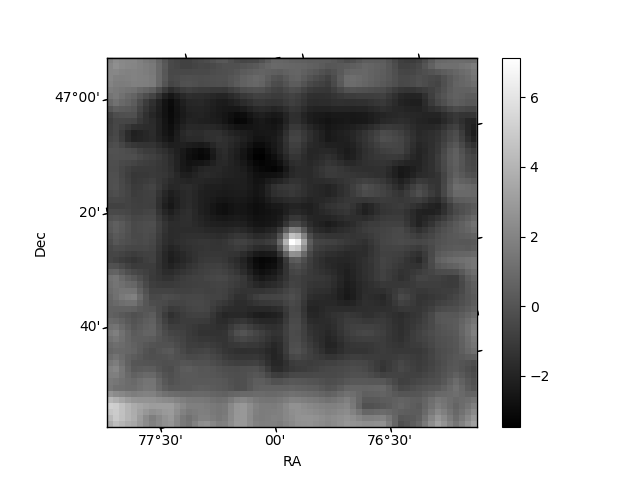
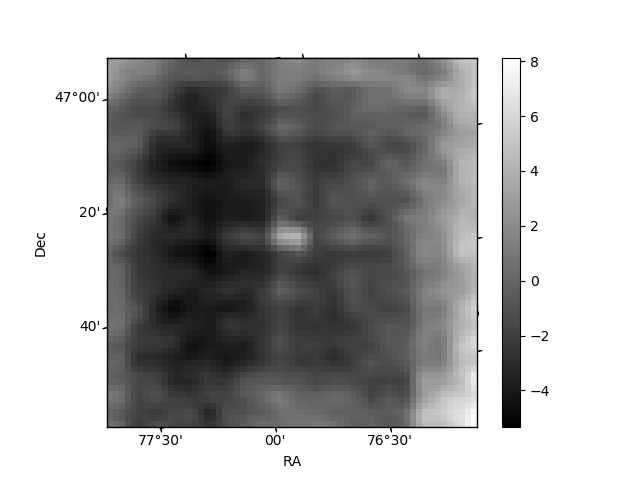
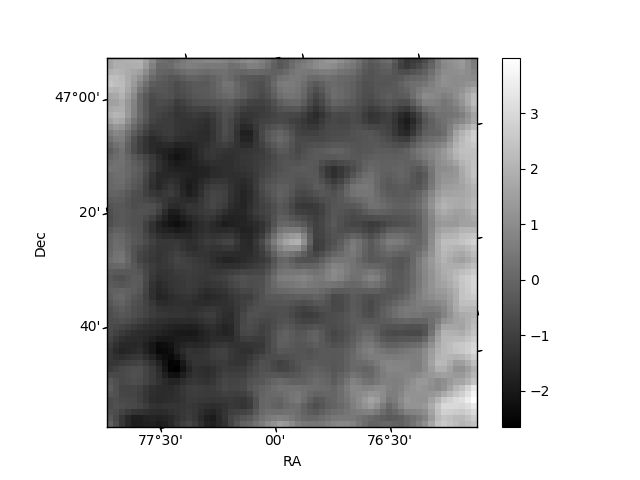
Histogram calculated using DETX and DETY for each event in the final _common_clean file
| Quadrant A | 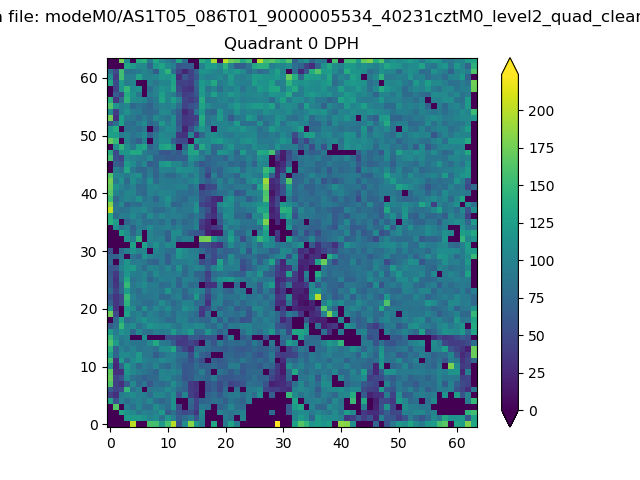 |
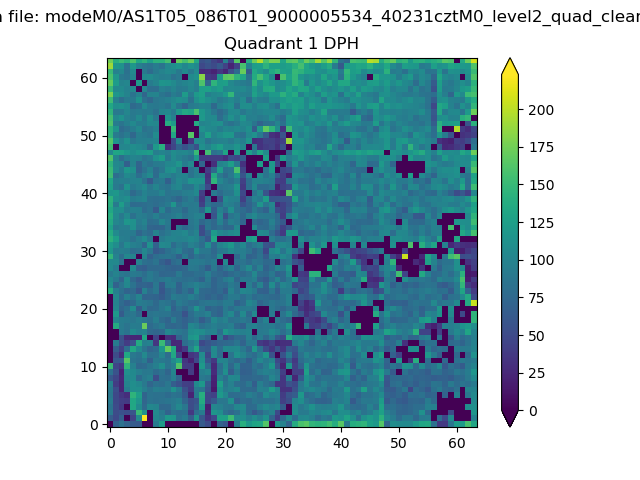 |
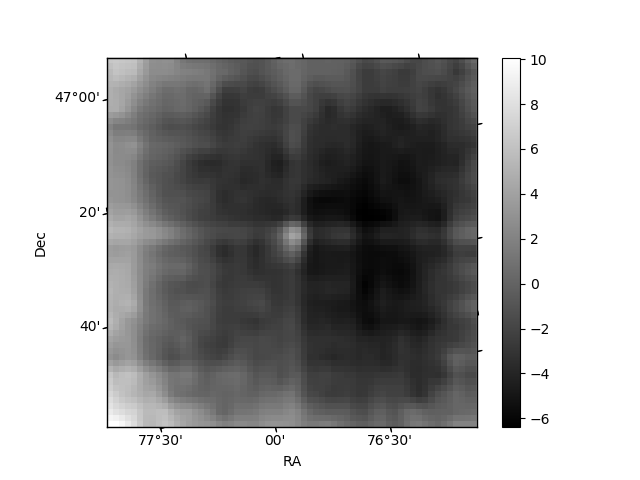
Quadrant B |
|---|---|---|---|
| Quadrant D | 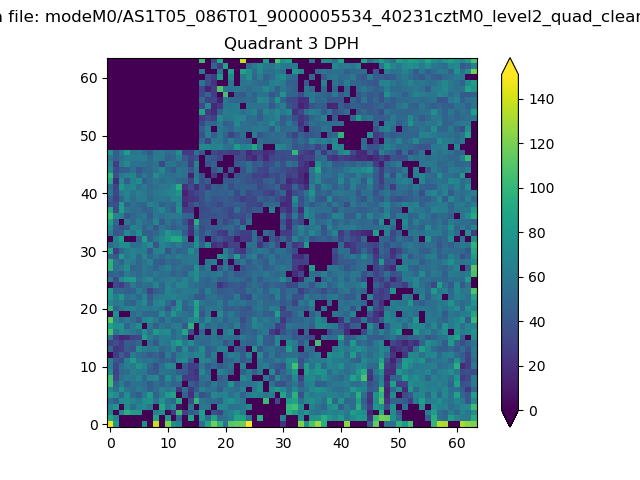 |
 |
Quadrant C |
| Plot type | Count rate plots | Images |
|---|---|---|
| Comparison with Poisson distribution Blue bars denote a histogram of data divided into 1 sec bins. Red curve is a Poisson curve with rate = median count rate of data. |
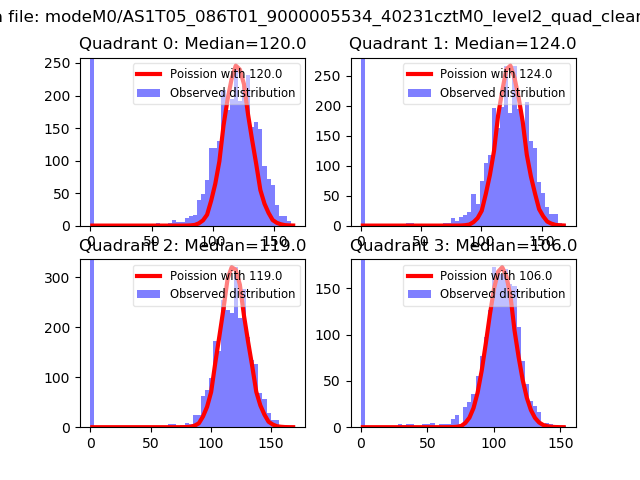 |
 |
| Quadrant-wise count rates Data is divided into 100 sec bins |
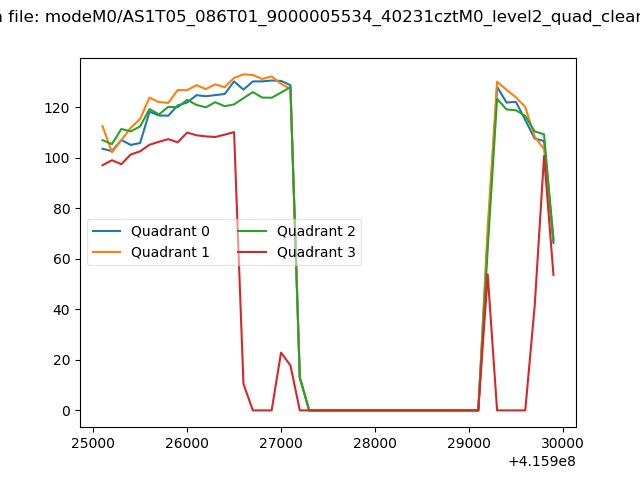 |
|
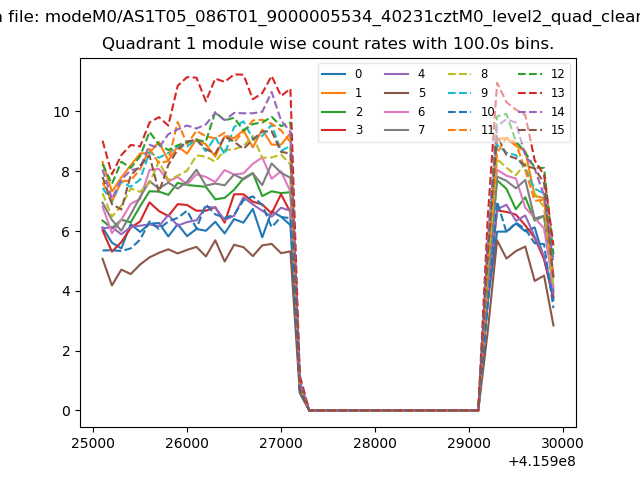
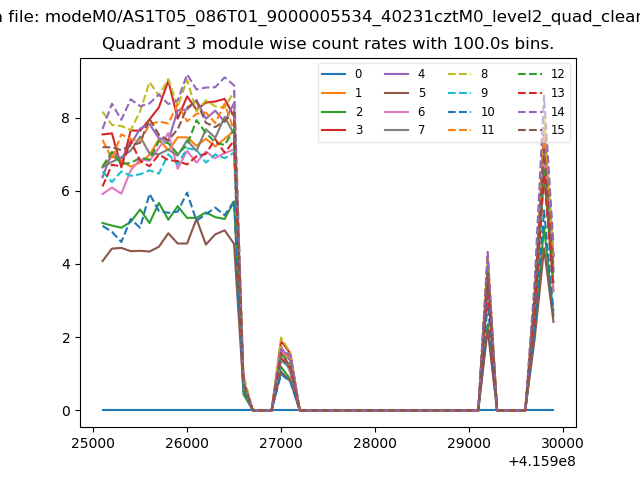
| Module-wise count rates for Quadrant A Data is divided into 100 sec bins |
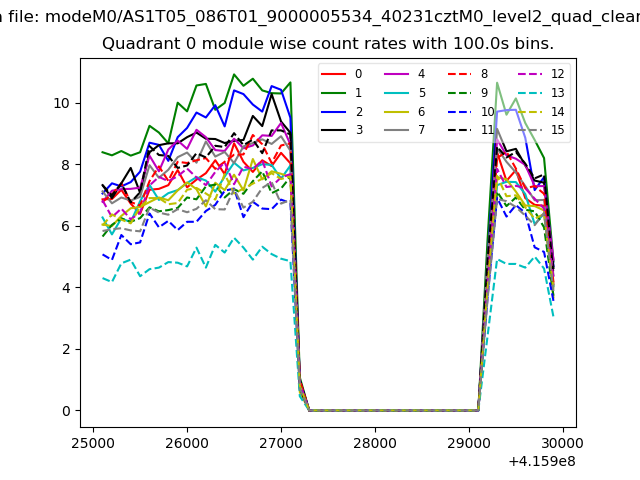 |
 |
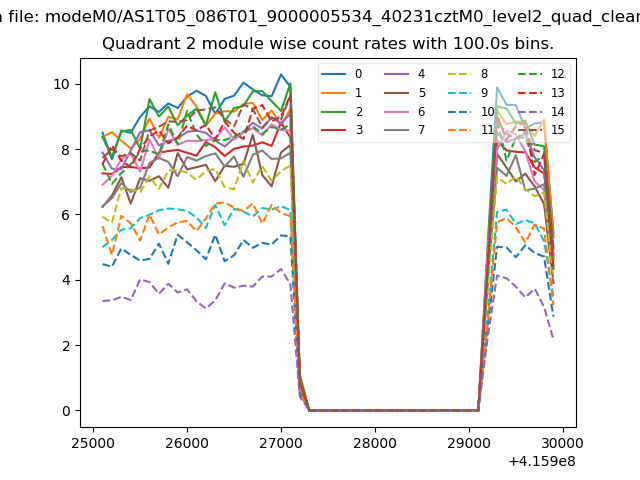
| Module-wise count rates for Quadrant B Data is divided into 100 sec bins |
 |
 |
| Module-wise count rates for Quadrant C Data is divided into 100 sec bins |
 |
 |
| Module-wise count rates for Quadrant D Data is divided into 100 sec bins |
 |
 |
| Parameter | Plot |
|---|---|
| CZT HV Monitor | 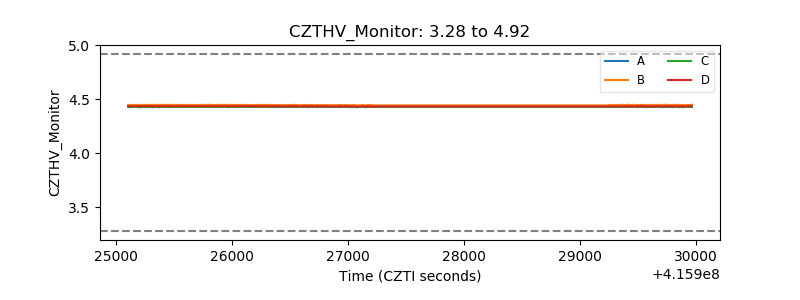 |
| D_VDD | 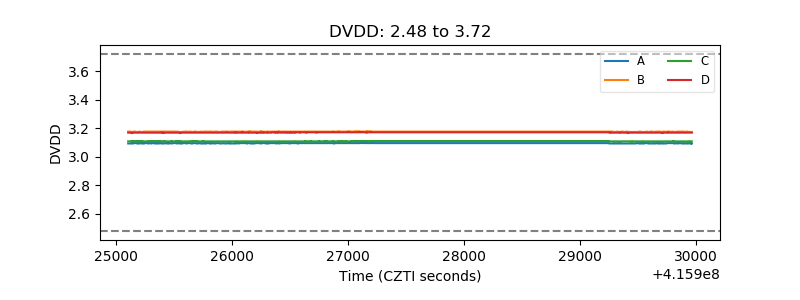 |
| Temperature 1 | 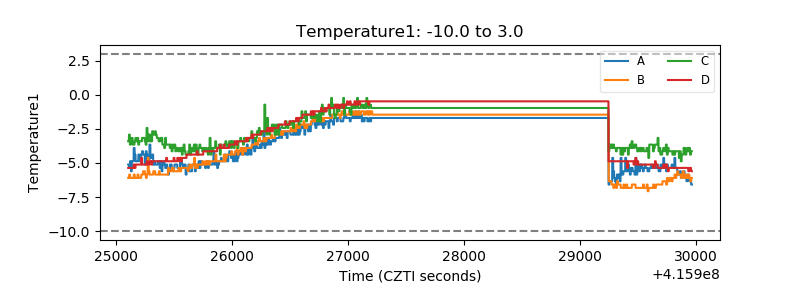 |
| Veto HV Monitor | 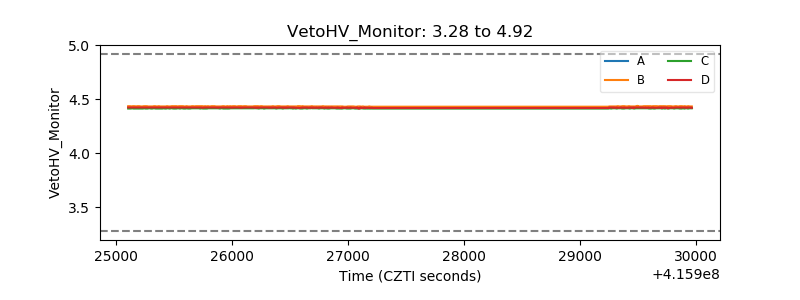 |
| Veto LLD | 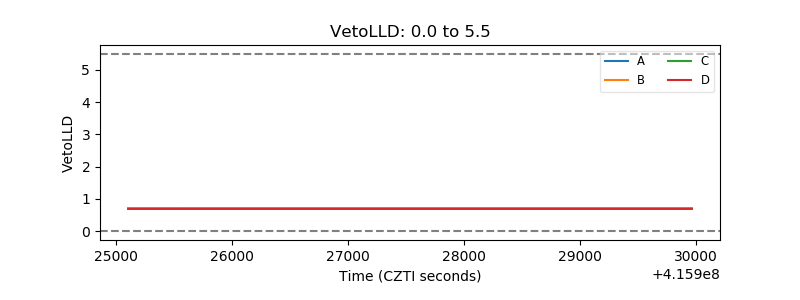 |
| Alpha Counter | 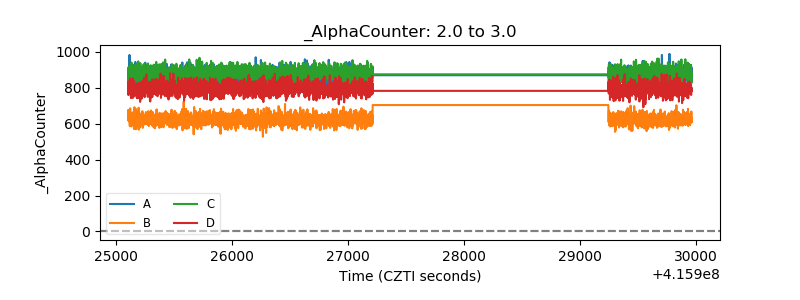 |
| _CPM_Rate | 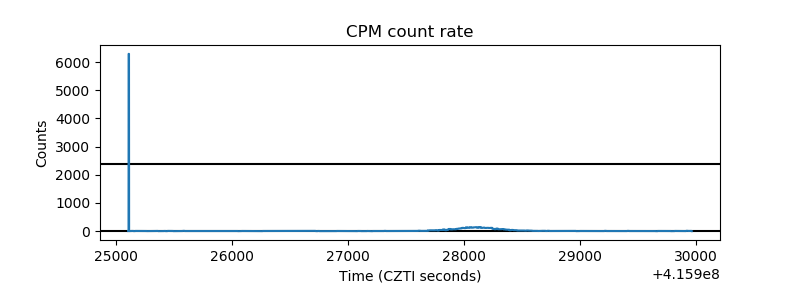 |
| CZT Counter | 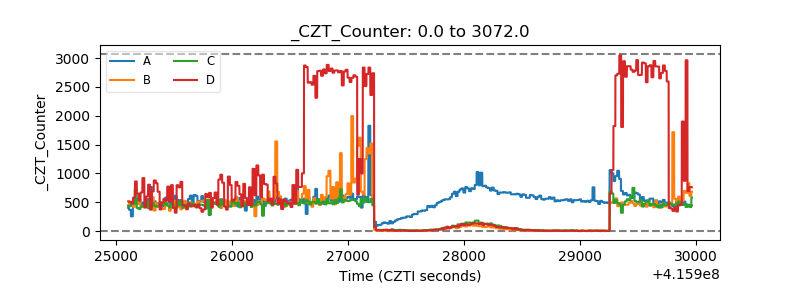 |
| +2.5 Volts monitor | 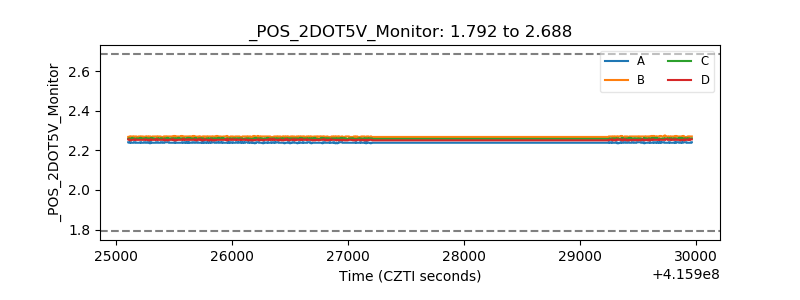 |
| +5 Volts monitor |  |
| _ROLL_ROT | 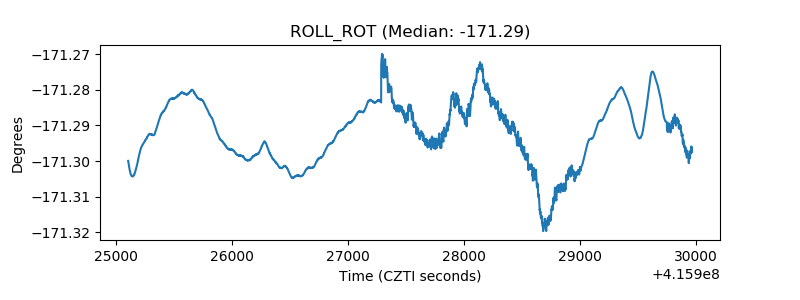 |
| _Roll_DEC | 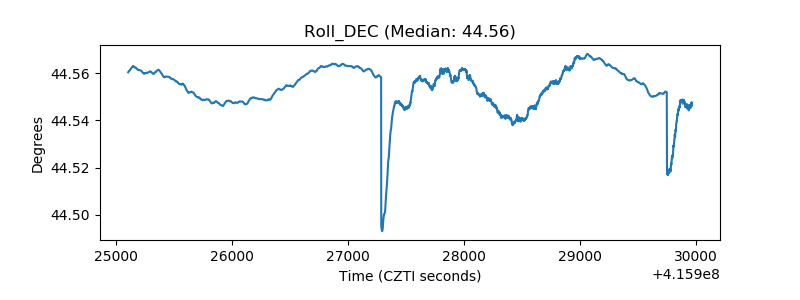 |
| _Roll_RA | 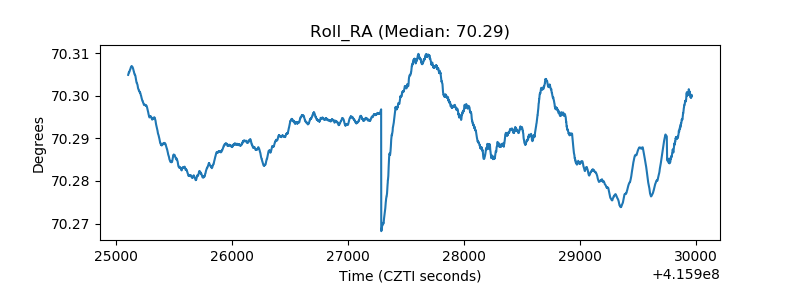 |
| Veto Counter | 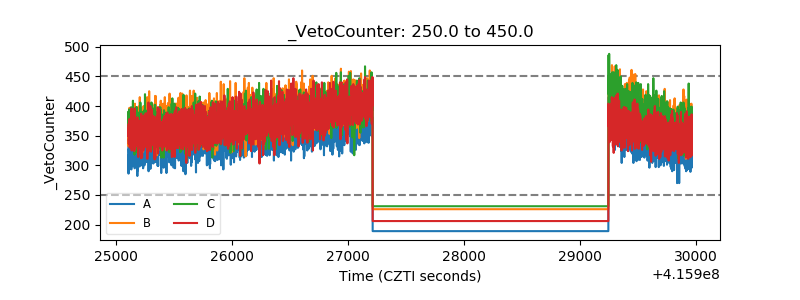 |