| Param | Original file | Final file |
|---|---|---|
| Filename | modeM0/AS1T05_086T01_9000005534_40232cztM0_level2.fits | modeM0/AS1T05_086T01_9000005534_40232cztM0_level2_quad_clean.evt |
| Size (bytes) | 397,748,160 | 90,987,840 |
| Size | 379.3 MB | 86.8 MB |
| Events in quadrant A | 3,168,668 | 625,034 |
| Events in quadrant B | 2,858,590 | 647,731 |
| Events in quadrant C | 2,637,835 | 627,300 |
| Events in quadrant D | 5,625,473 | 466,392 |
| Mode M0 | |||
|---|---|---|---|
| Quadrant | BADHDUFLAG | Total packets | Discarded packets |
| A | 0 | 12865 | 3 |
| B | 0 | 12128 | 2 |
| C | 0 | 11287 | 2 |
| D | 0 | 20710 | 2 |
| Mode M9 | |||
|---|---|---|---|
| Quadrant | BADHDUFLAG | Total packets | Discarded packets |
| A | 0 | 32 | 0 |
| B | 0 | 32 | 0 |
| C | 0 | 32 | 0 |
| D | 0 | 33 | 0 |
| Mode SS | |||
|---|---|---|---|
| Quadrant | BADHDUFLAG | Total packets | Discarded packets |
| A | 0 | 112 | 0 |
| B | 0 | 112 | 0 |
| C | 0 | 112 | 0 |
| D | 0 | 112 | 0 |
| Quadrant | Total seconds | Saturated seconds | Saturation percentage |
|---|---|---|---|
| A | 5559 | 62 | 1.115309% |
| B | 5559 | 42 | 0.755532% |
| C | 5559 | 11 | 0.197877% |
| D | 5559 | 1036 | 18.636445% |
Noise dominated data is calculated using 1-second bins in cleaned event files. If a bin has >2000 counts, and if more than 50% of those come from <1% of pixels, then it is considered to be noise-dominated and hence unusable.
| Quadrant | # 1 sec bins | Bins with >0 counts | Bins with >2000 counts | High rate bins dominated by noise | Noise dominated (total time) | Noise dominated (detector-on time) | Marked lightcurve |
|---|---|---|---|---|---|---|---|
| A | 7292 | 5560 | 33 | 33 | 0.45% | 0.59% | 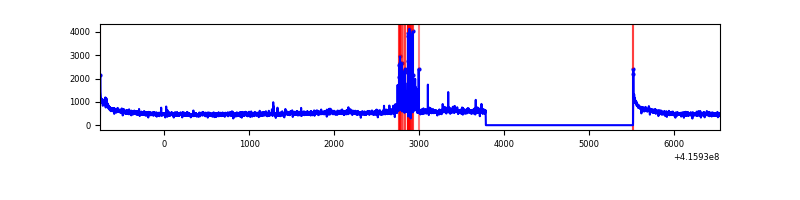 |
| B | 7292 | 5560 | 26 | 26 | 0.36% | 0.47% | 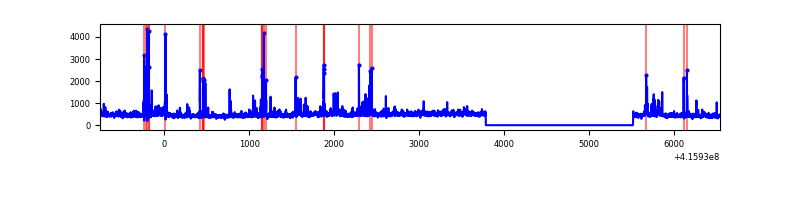 |
| C | 7292 | 5560 | 7 | 7 | 0.10% | 0.13% | 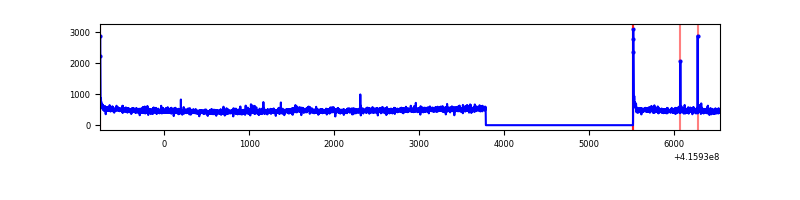 |
| D | 7292 | 5559 | 977 | 977 | 13.40% | 17.58% | 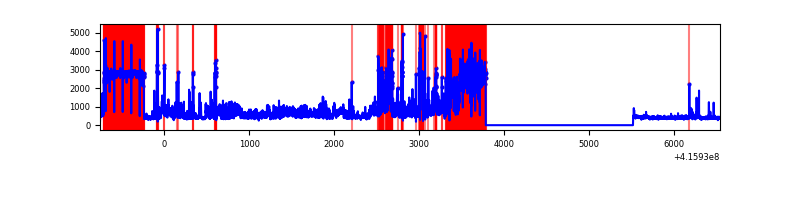 |
Top three noisy pixels from each quadrant. If the there are fewer than three noisy pixels in the level2.evt file, extra rows are filled as -1
| Pixel properties | Quadrant properties | ||||||
|---|---|---|---|---|---|---|---|
| Quadrant | DetID | PixID | Counts | Sigma | Mean | Median | Sigma |
| A | 10 | 83 | 488886 | 3916.75 | 607 | 595 | 124.7 |
| A | 13 | 248 | 166189 | 1328.29 | 607 | 595 | 124.7 |
| A | 12 | 189 | 113836 | 908.35 | 607 | 595 | 124.7 |
| B | 0 | 229 | 266573 | 2238.36 | 608 | 591 | 118.8 |
| B | 5 | 255 | 122030 | 1021.96 | 608 | 591 | 118.8 |
| B | 4 | 171 | 32413 | 267.8 | 608 | 591 | 118.8 |
| C | 15 | 214 | 239774 | 1707.2 | 598 | 603 | 140.1 |
| C | 0 | 10 | 26048 | 181.63 | 598 | 603 | 140.1 |
| C | 9 | 187 | 14416 | 98.6 | 598 | 603 | 140.1 |
| D | 12 | 227 | 3472960 | 27086.02 | 514 | 499 | 128.2 |
| D | 13 | 249 | 60591 | 468.73 | 514 | 499 | 128.2 |
| D | 2 | 250 | 37757 | 290.62 | 514 | 499 | 128.2 |
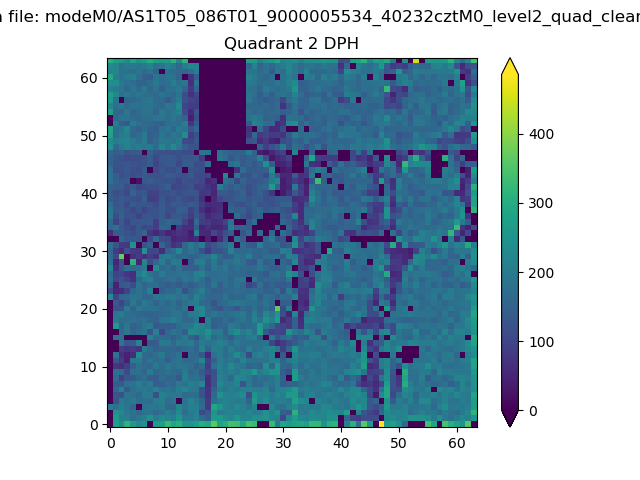
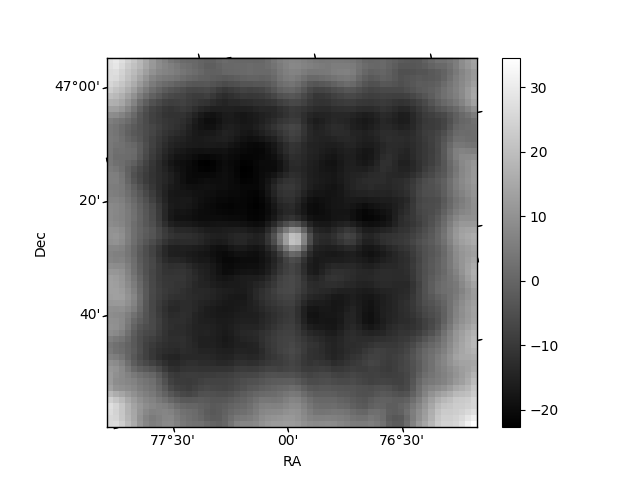
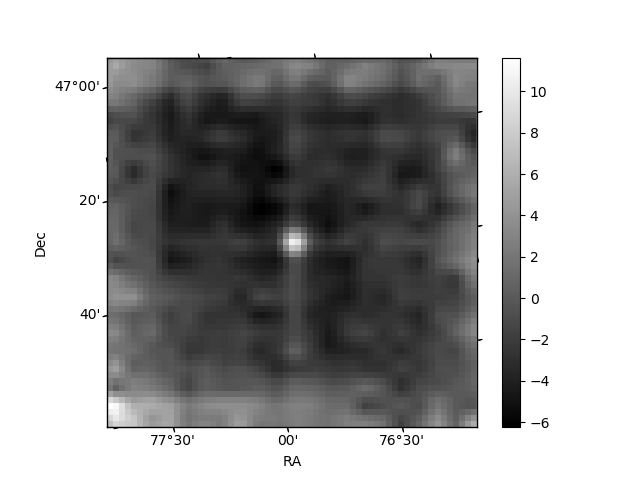
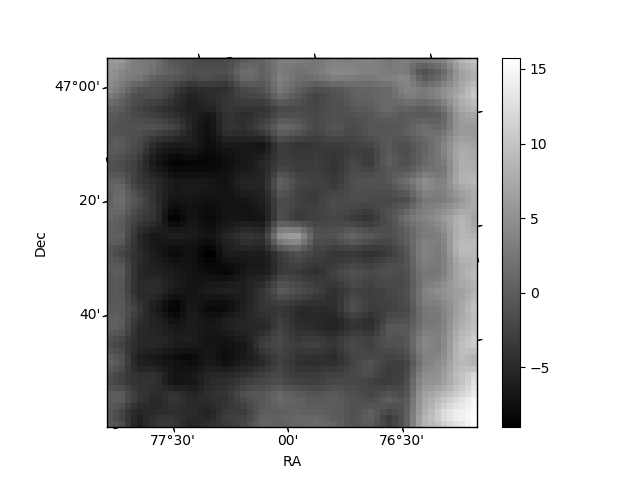
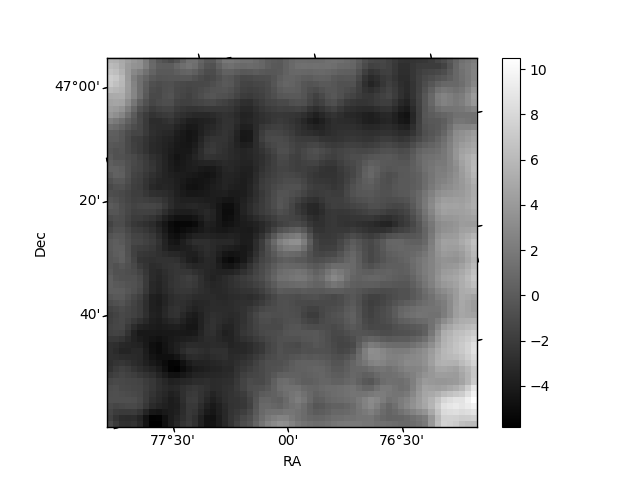
Histogram calculated using DETX and DETY for each event in the final _common_clean file
| Quadrant A | 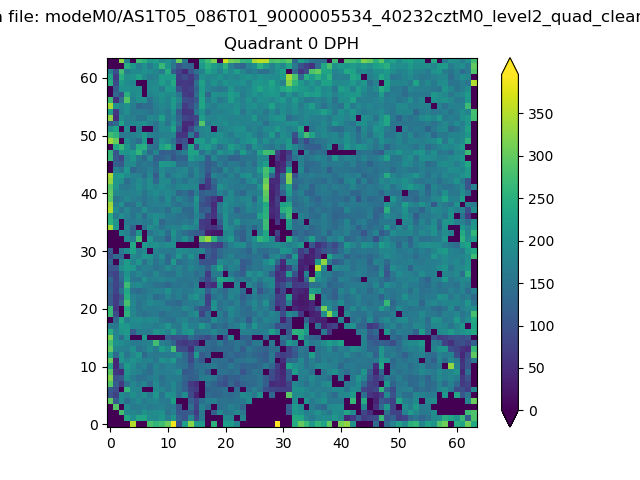 |
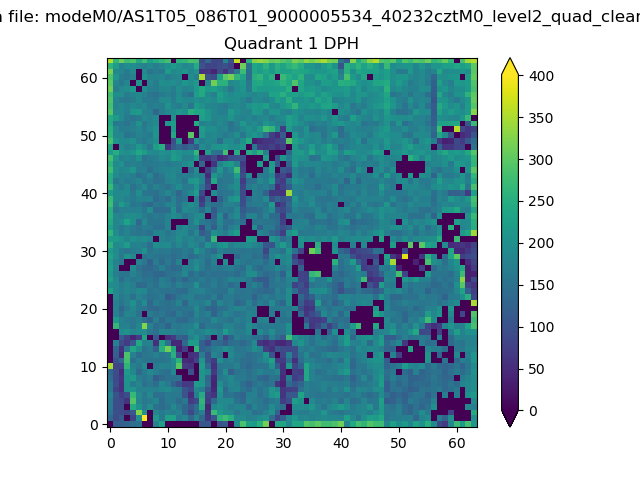 |
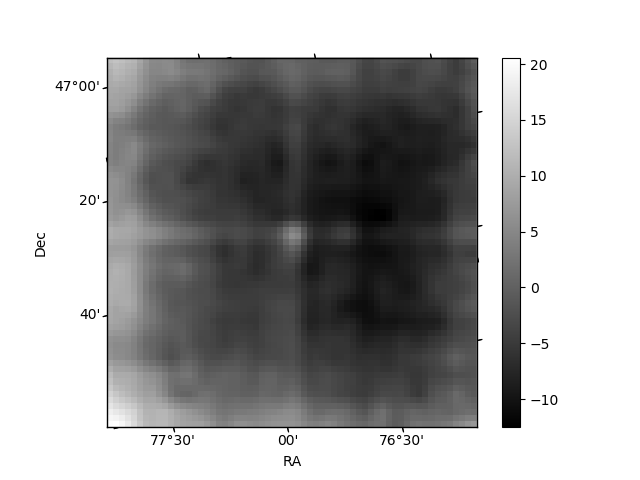
Quadrant B |
|---|---|---|---|
| Quadrant D | 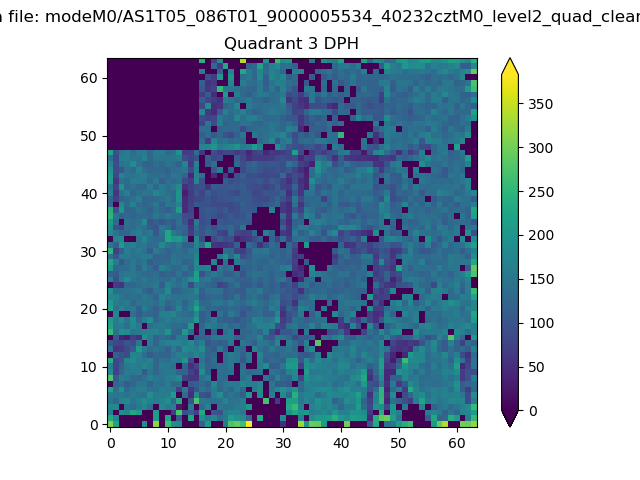 |
 |
Quadrant C |
| Plot type | Count rate plots | Images |
|---|---|---|
| Comparison with Poisson distribution Blue bars denote a histogram of data divided into 1 sec bins. Red curve is a Poisson curve with rate = median count rate of data. |
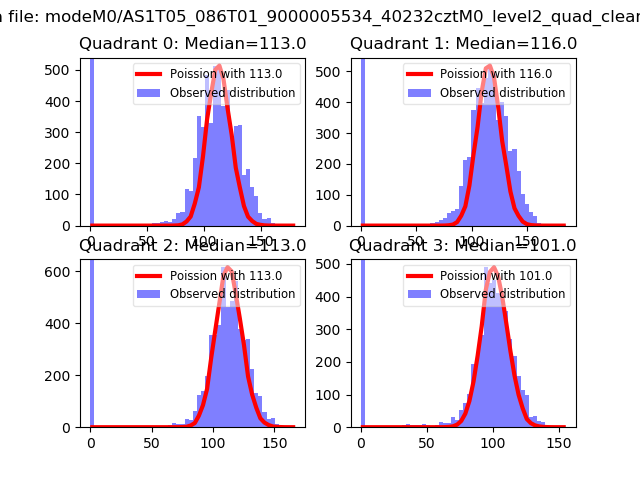 |
 |
| Quadrant-wise count rates Data is divided into 100 sec bins |
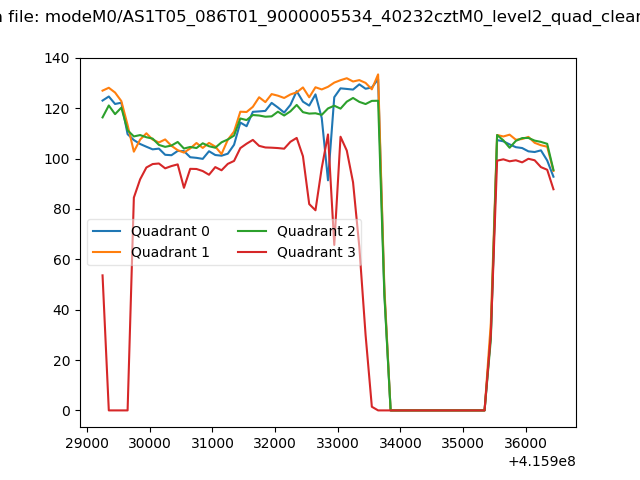 |
|
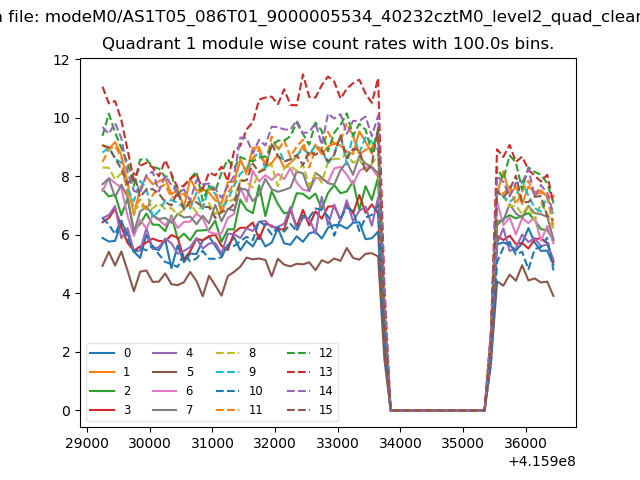
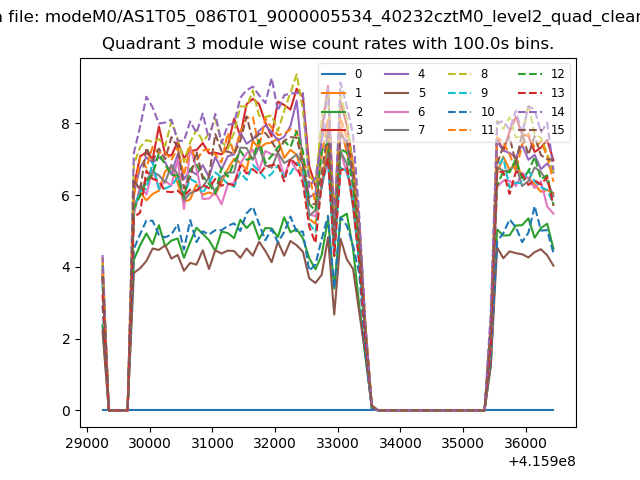
| Module-wise count rates for Quadrant A Data is divided into 100 sec bins |
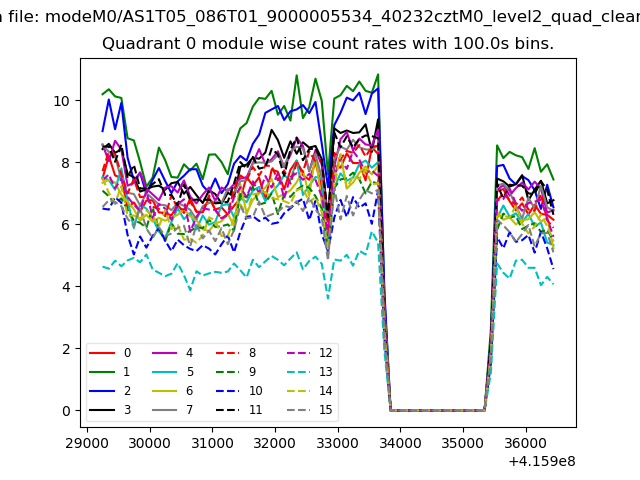 |
 |
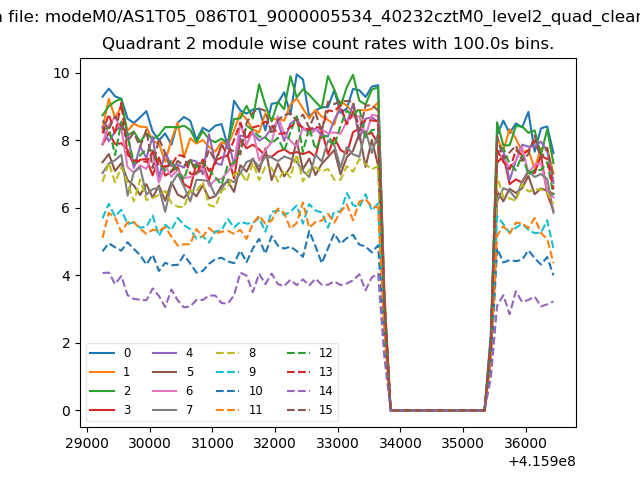
| Module-wise count rates for Quadrant B Data is divided into 100 sec bins |
 |
 |
| Module-wise count rates for Quadrant C Data is divided into 100 sec bins |
 |
 |
| Module-wise count rates for Quadrant D Data is divided into 100 sec bins |
 |
 |
| Parameter | Plot |
|---|---|
| CZT HV Monitor | 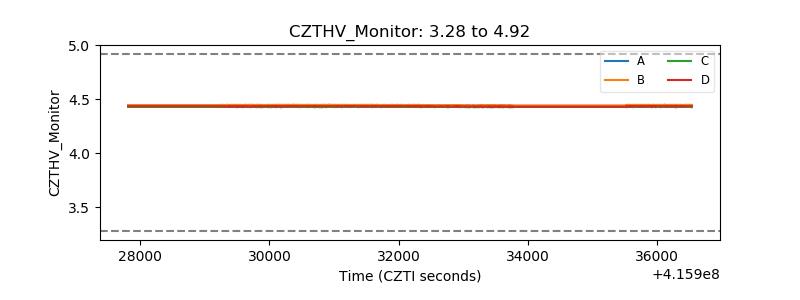 |
| D_VDD | 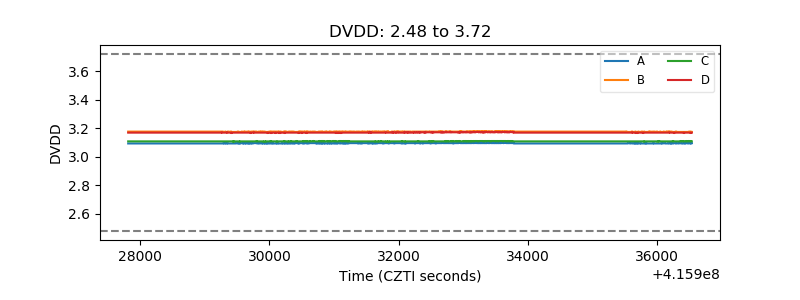 |
| Temperature 1 | 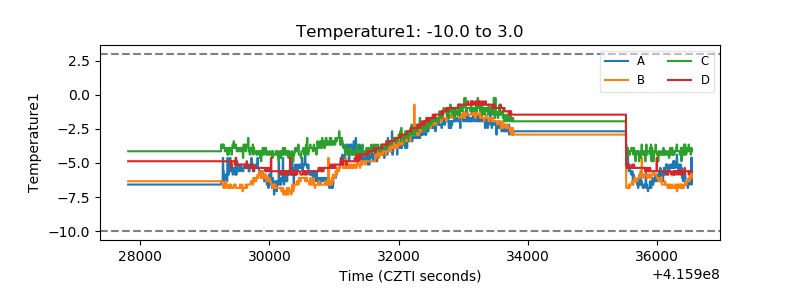 |
| Veto HV Monitor | 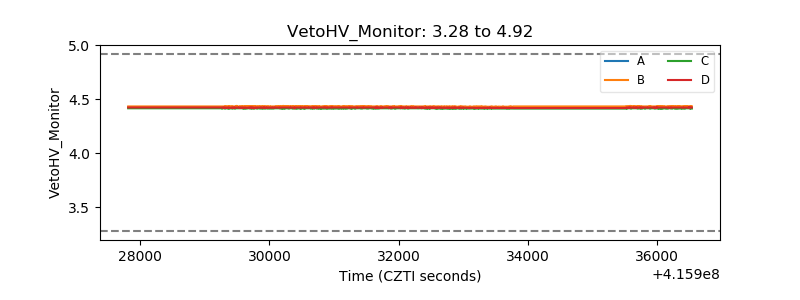 |
| Veto LLD | 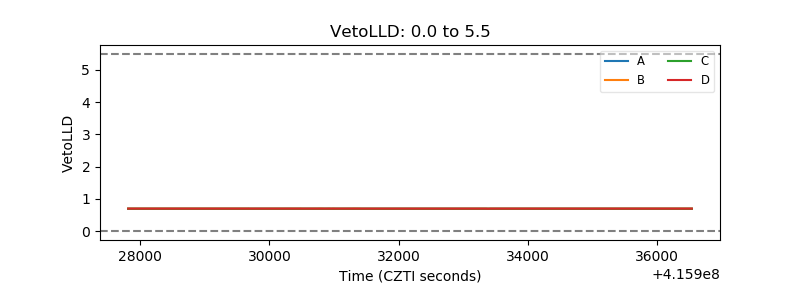 |
| Alpha Counter | 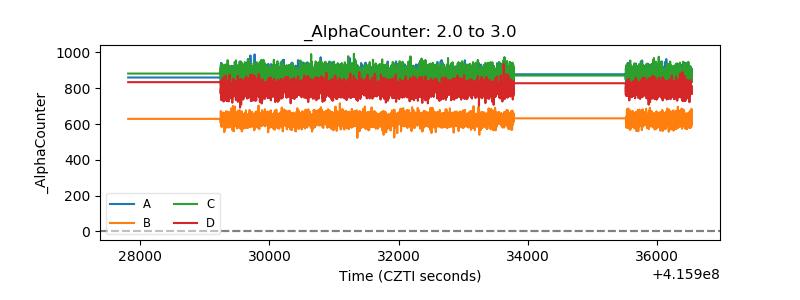 |
| _CPM_Rate | 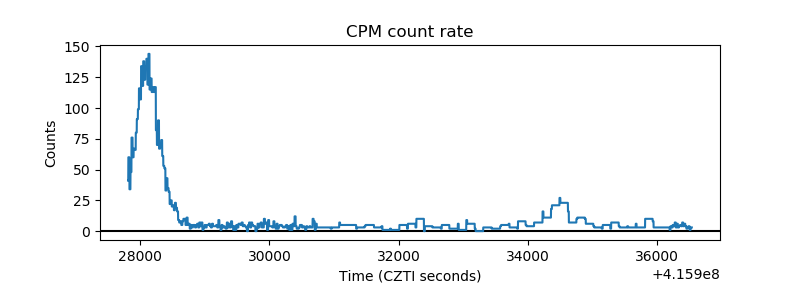 |
| CZT Counter | 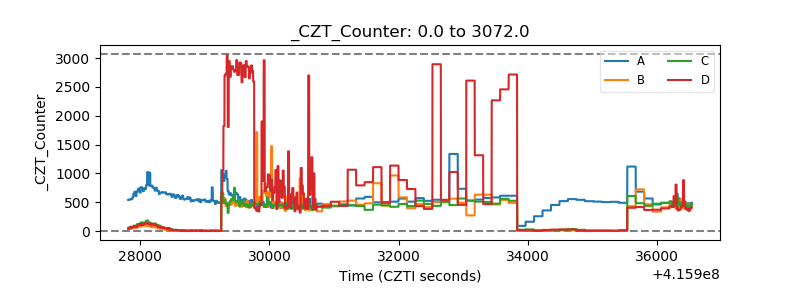 |
| +2.5 Volts monitor | 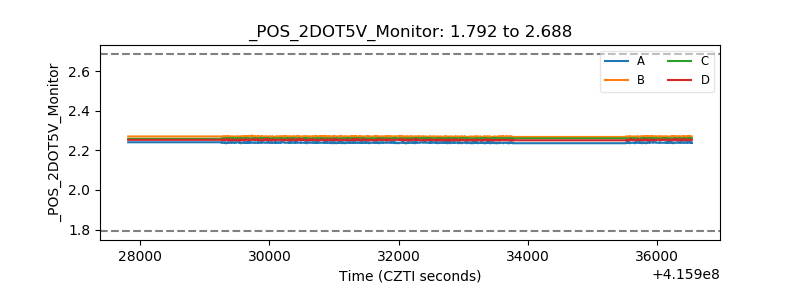 |
| +5 Volts monitor |  |
| _ROLL_ROT | 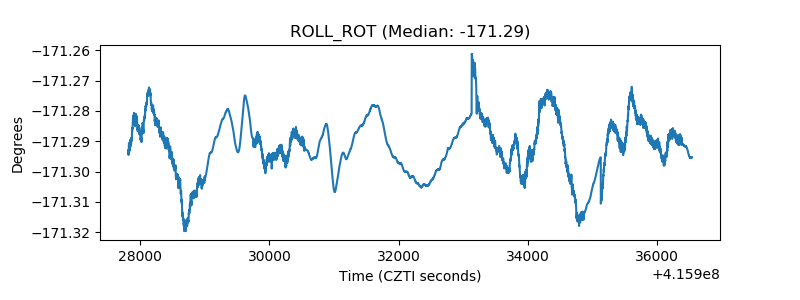 |
| _Roll_DEC | 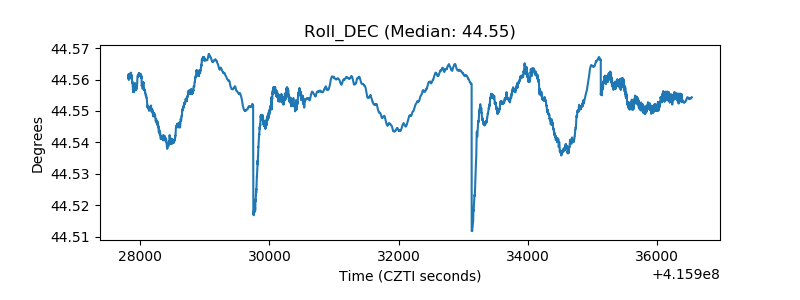 |
| _Roll_RA | 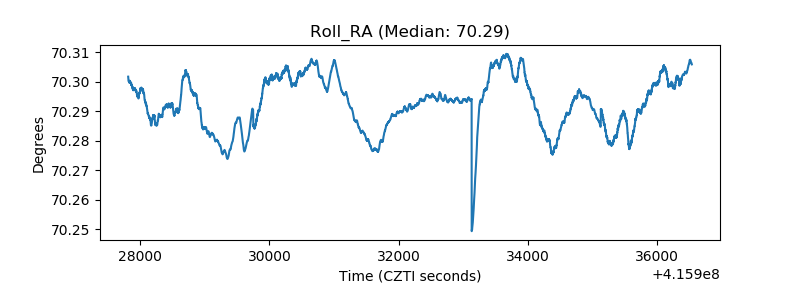 |
| Veto Counter | 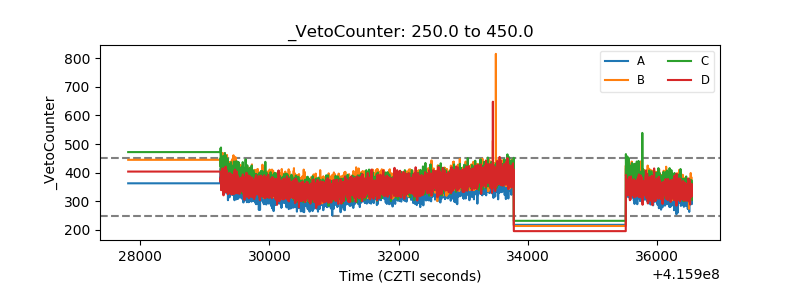 |