| Param | Original file | Final file |
|---|---|---|
| Filename | modeM0/AS1T05_086T01_9000005534_40233cztM0_level2.fits | modeM0/AS1T05_086T01_9000005534_40233cztM0_level2_quad_clean.evt |
| Size (bytes) | 328,112,640 | 98,775,360 |
| Size | 312.9 MB | 94.2 MB |
| Events in quadrant A | 3,155,306 | 656,362 |
| Events in quadrant B | 2,918,321 | 679,500 |
| Events in quadrant C | 2,791,839 | 654,798 |
| Events in quadrant D | 2,826,551 | 593,450 |
| Mode M0 | |||
|---|---|---|---|
| Quadrant | BADHDUFLAG | Total packets | Discarded packets |
| A | 0 | 12836 | 3 |
| B | 0 | 12583 | 2 |
| C | 0 | 11894 | 2 |
| D | 0 | 12598 | 2 |
| Mode M9 | |||
|---|---|---|---|
| Quadrant | BADHDUFLAG | Total packets | Discarded packets |
| A | 0 | 32 | 0 |
| B | 0 | 32 | 0 |
| C | 0 | 32 | 0 |
| D | 0 | 32 | 0 |
| Mode SS | |||
|---|---|---|---|
| Quadrant | BADHDUFLAG | Total packets | Discarded packets |
| A | 0 | 120 | 0 |
| B | 0 | 120 | 0 |
| C | 0 | 120 | 0 |
| D | 0 | 120 | 0 |
| Quadrant | Total seconds | Saturated seconds | Saturation percentage |
|---|---|---|---|
| A | 5823 | 35 | 0.601065% |
| B | 5823 | 35 | 0.601065% |
| C | 5823 | 11 | 0.188906% |
| D | 5823 | 51 | 0.875837% |
Noise dominated data is calculated using 1-second bins in cleaned event files. If a bin has >2000 counts, and if more than 50% of those come from <1% of pixels, then it is considered to be noise-dominated and hence unusable.
| Quadrant | # 1 sec bins | Bins with >0 counts | Bins with >2000 counts | High rate bins dominated by noise | Noise dominated (total time) | Noise dominated (detector-on time) | Marked lightcurve |
|---|---|---|---|---|---|---|---|
| A | 8989 | 5825 | 25 | 25 | 0.28% | 0.43% | 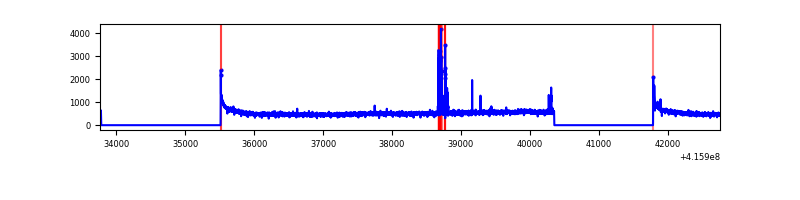 |
| B | 8989 | 5825 | 25 | 25 | 0.28% | 0.43% | 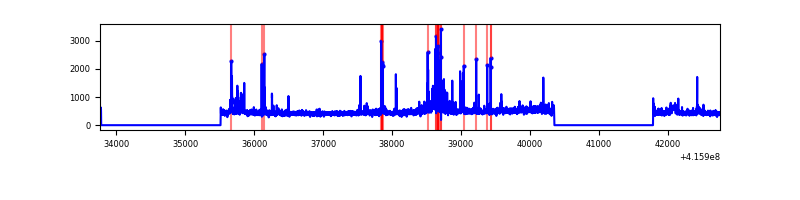 |
| C | 8989 | 5825 | 9 | 9 | 0.10% | 0.15% | 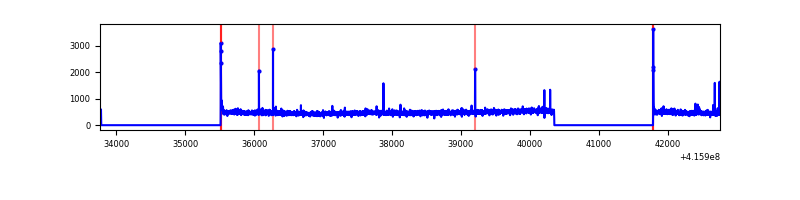 |
| D | 8989 | 5824 | 39 | 39 | 0.43% | 0.67% | 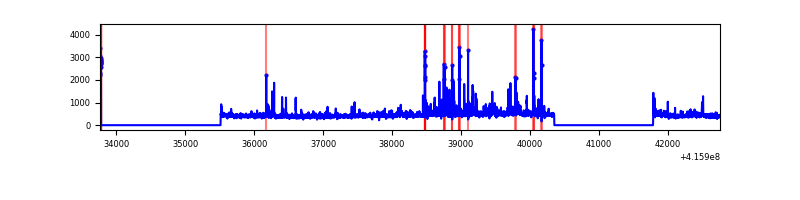 |
Top three noisy pixels from each quadrant. If the there are fewer than three noisy pixels in the level2.evt file, extra rows are filled as -1
| Pixel properties | Quadrant properties | ||||||
|---|---|---|---|---|---|---|---|
| Quadrant | DetID | PixID | Counts | Sigma | Mean | Median | Sigma |
| A | 10 | 83 | 515017 | 3870.68 | 644 | 631 | 132.9 |
| A | 13 | 248 | 80017 | 597.37 | 644 | 631 | 132.9 |
| A | 6 | 10 | 25378 | 186.22 | 644 | 631 | 132.9 |
| B | 0 | 229 | 141229 | 1123.14 | 644 | 628 | 125.2 |
| B | 5 | 255 | 90615 | 718.83 | 644 | 628 | 125.2 |
| B | 0 | 245 | 35966 | 282.28 | 644 | 628 | 125.2 |
| C | 15 | 214 | 250562 | 1693.68 | 630 | 634 | 147.6 |
| C | 0 | 10 | 23978 | 158.19 | 630 | 634 | 147.6 |
| C | 9 | 187 | 21572 | 141.89 | 630 | 634 | 147.6 |
| D | 12 | 227 | 170158 | 1108.06 | 625 | 608 | 153.0 |
| D | 13 | 249 | 65497 | 424.07 | 625 | 608 | 153.0 |
| D | 12 | 218 | 61017 | 394.79 | 625 | 608 | 153.0 |
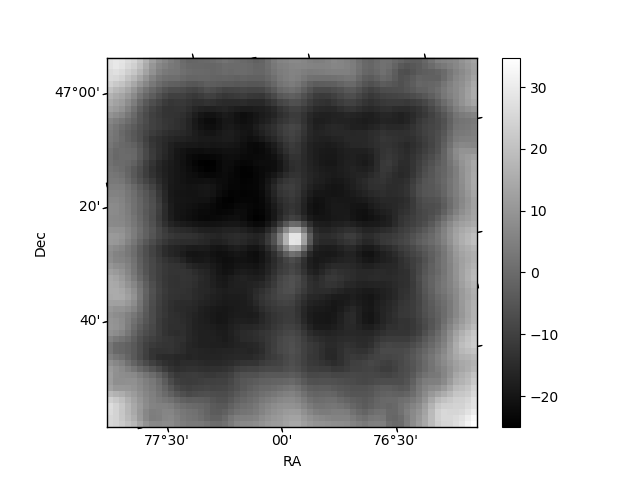
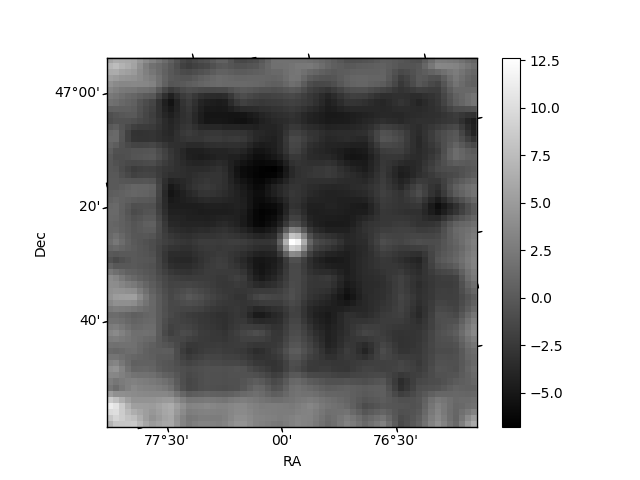
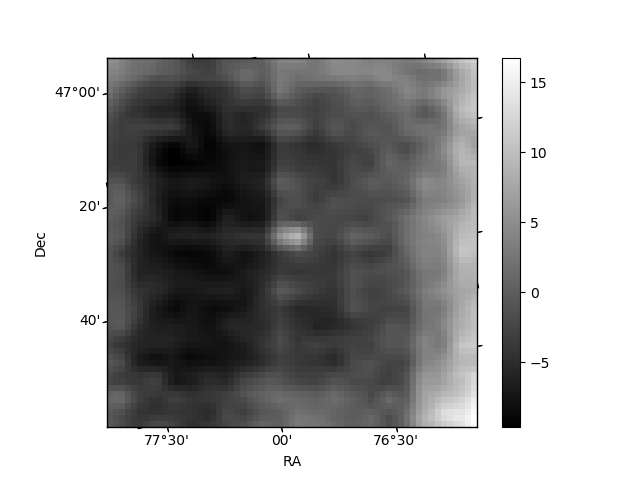
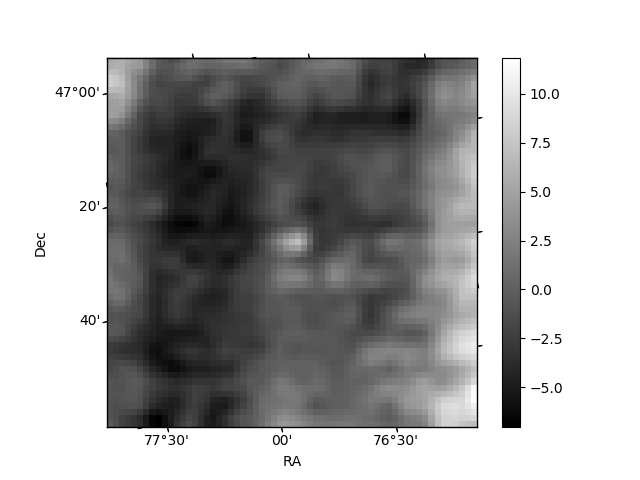
Histogram calculated using DETX and DETY for each event in the final _common_clean file
| Quadrant A | 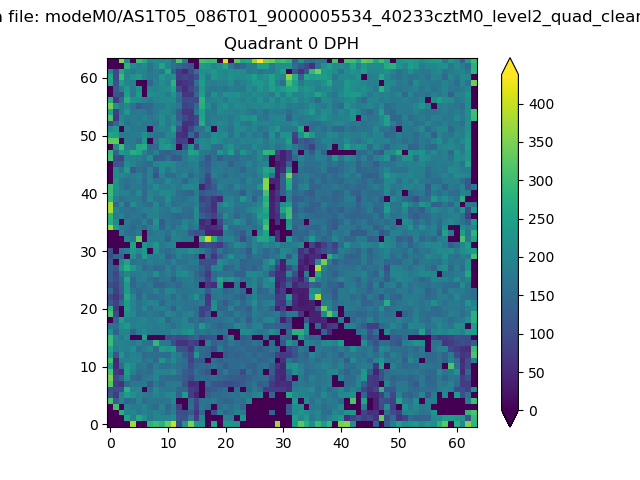 |
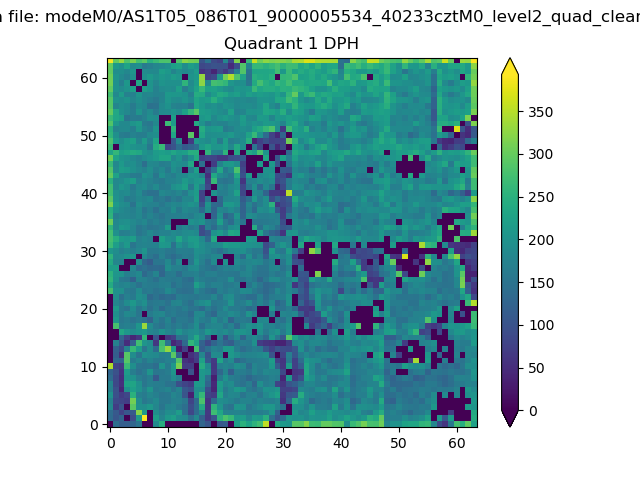 |
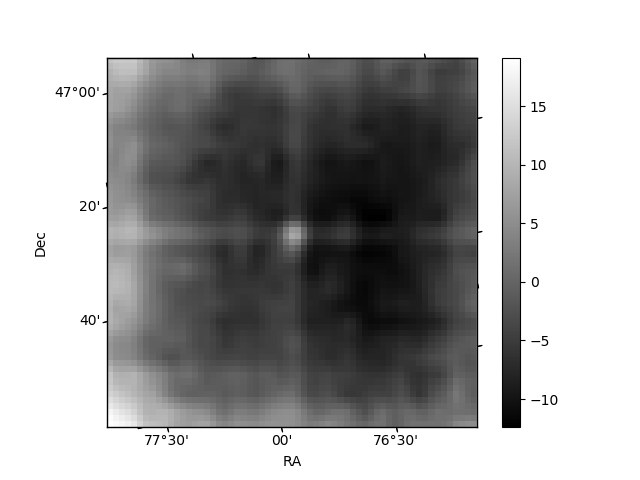
Quadrant B |
|---|---|---|---|
| Quadrant D | 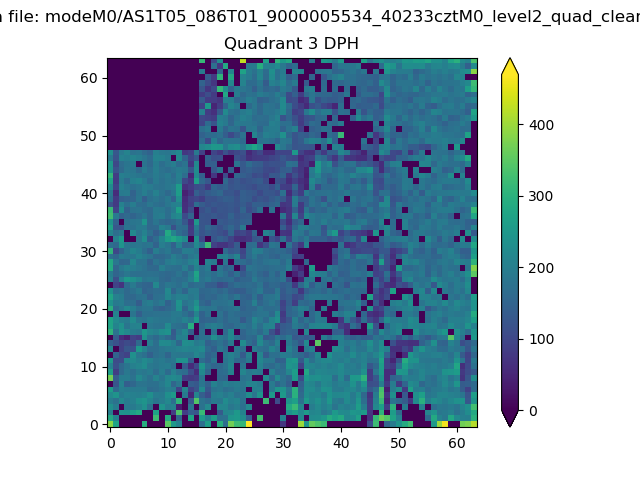 |
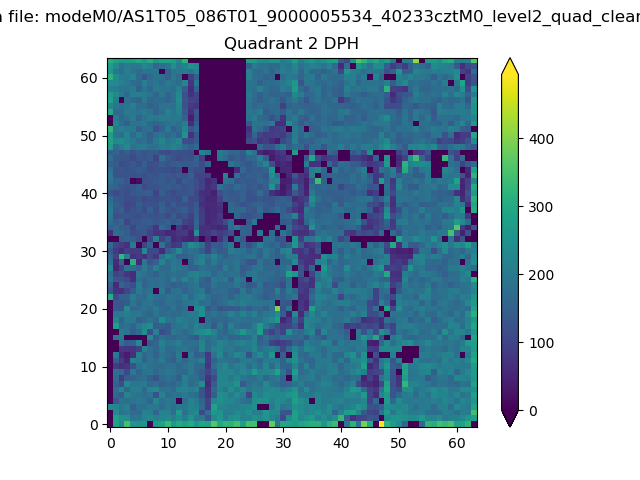 |
Quadrant C |
| Plot type | Count rate plots | Images |
|---|---|---|
| Comparison with Poisson distribution Blue bars denote a histogram of data divided into 1 sec bins. Red curve is a Poisson curve with rate = median count rate of data. |
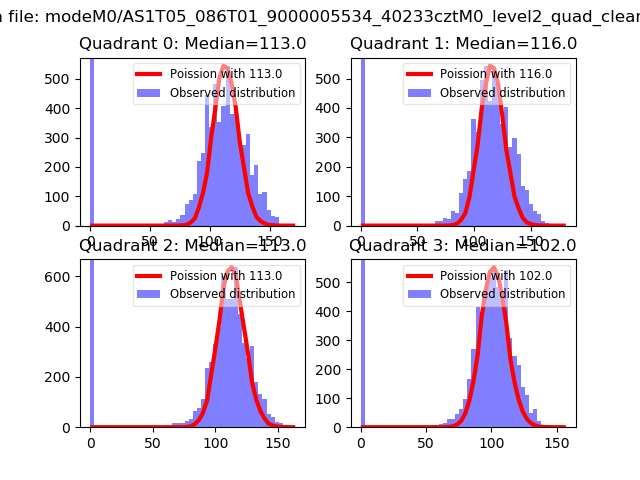 |
 |
| Quadrant-wise count rates Data is divided into 100 sec bins |
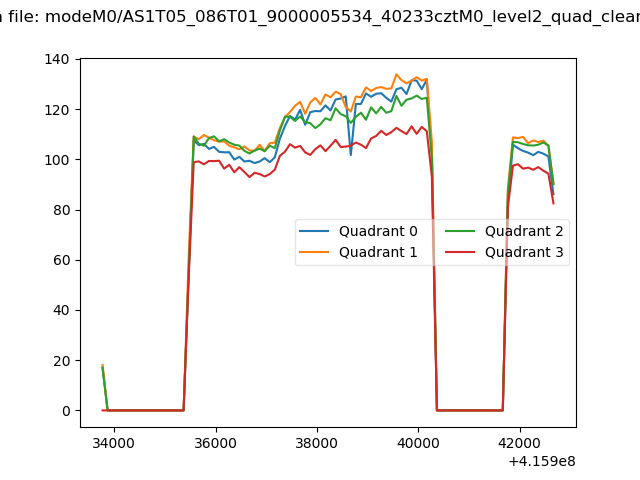 |
|
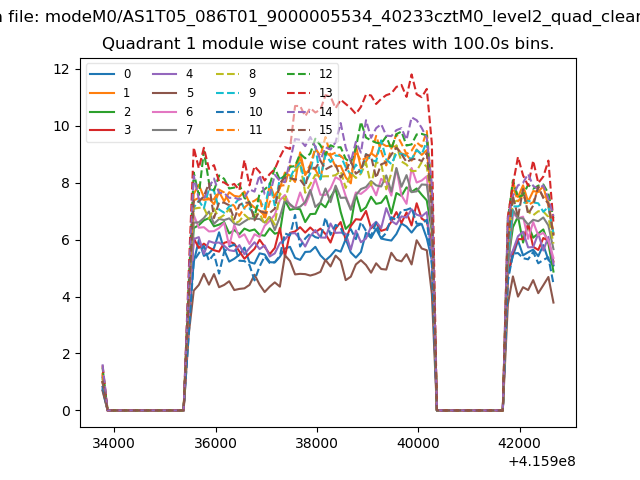
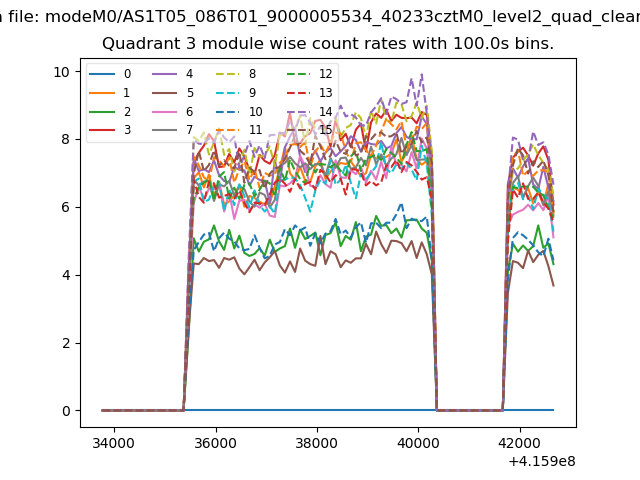
| Module-wise count rates for Quadrant A Data is divided into 100 sec bins |
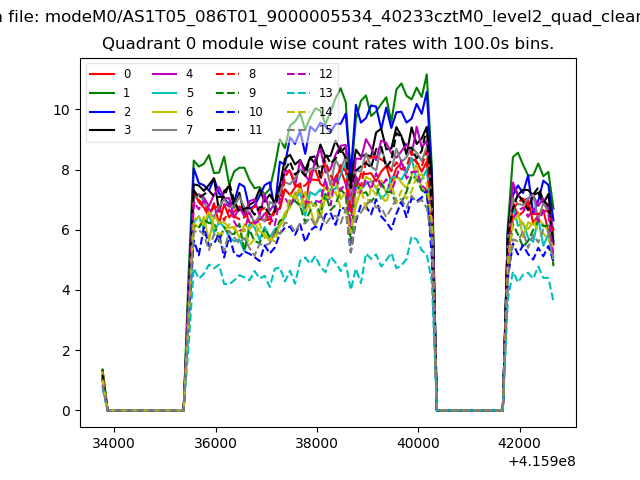 |
 |
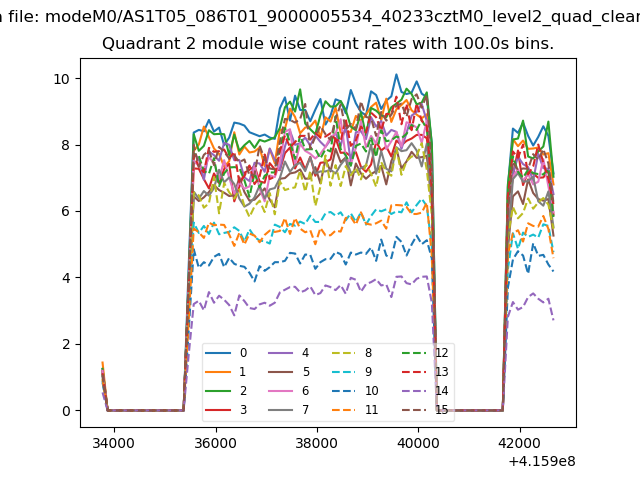
| Module-wise count rates for Quadrant B Data is divided into 100 sec bins |
 |
 |
| Module-wise count rates for Quadrant C Data is divided into 100 sec bins |
 |
 |
| Module-wise count rates for Quadrant D Data is divided into 100 sec bins |
 |
 |
| Parameter | Plot |
|---|---|
| CZT HV Monitor | 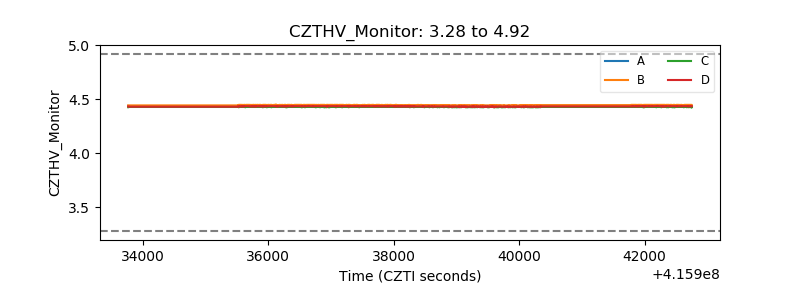 |
| D_VDD | 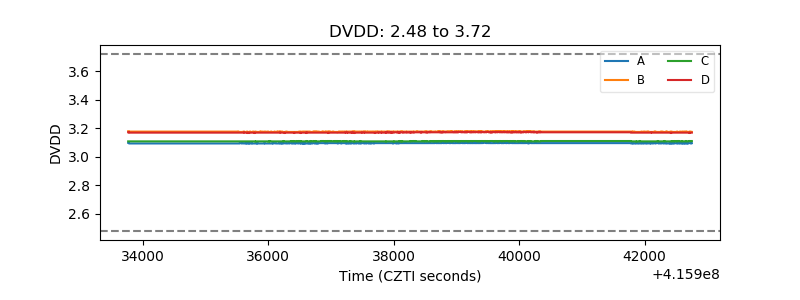 |
| Temperature 1 | 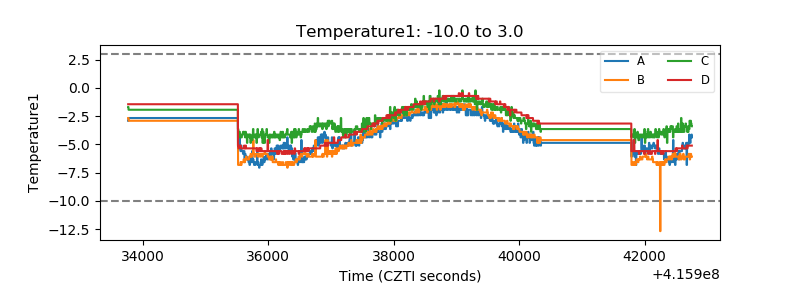 |
| Veto HV Monitor | 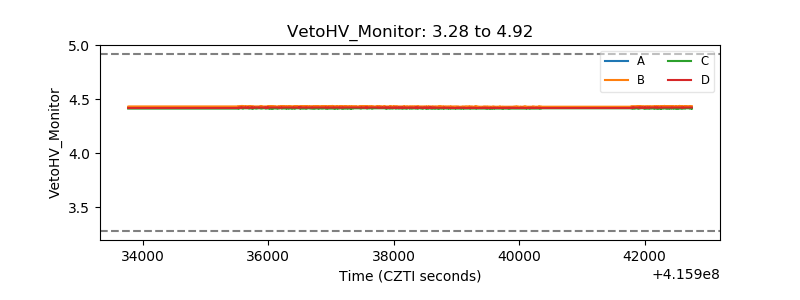 |
| Veto LLD | 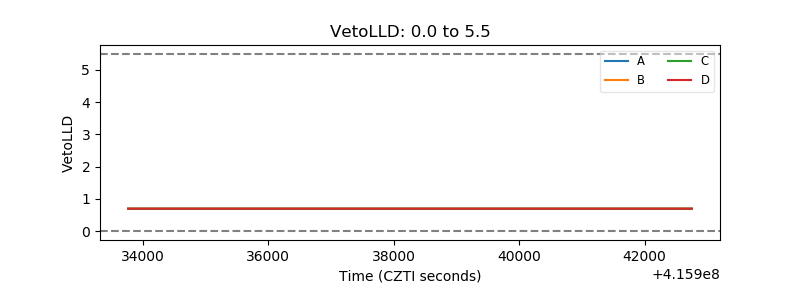 |
| Alpha Counter | 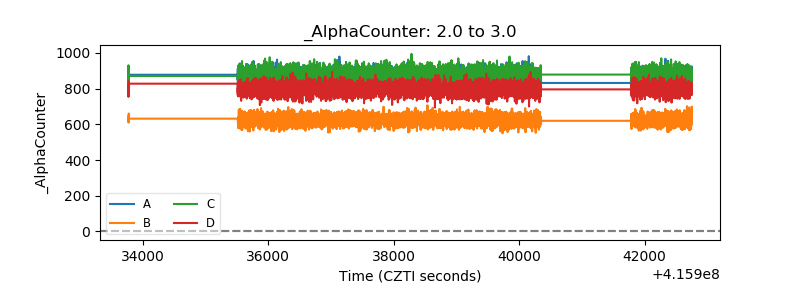 |
| _CPM_Rate | 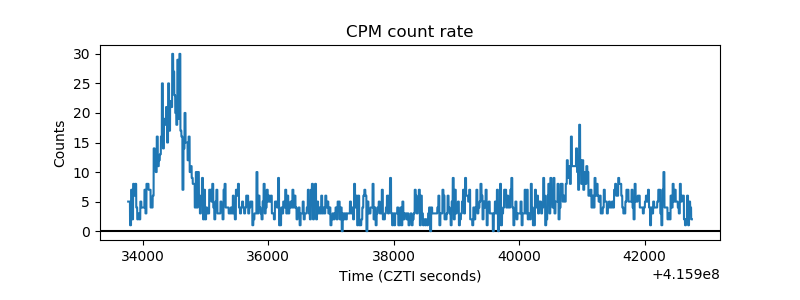 |
| CZT Counter | 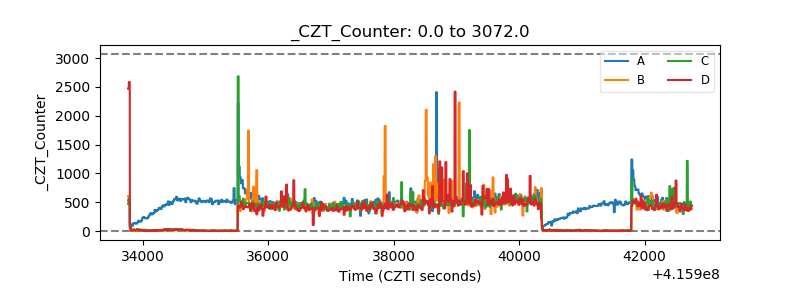 |
| +2.5 Volts monitor | 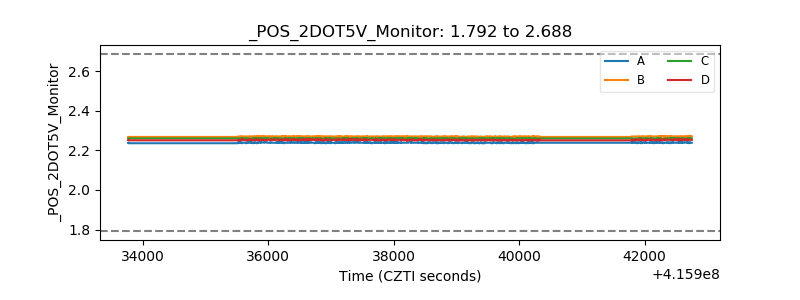 |
| +5 Volts monitor | 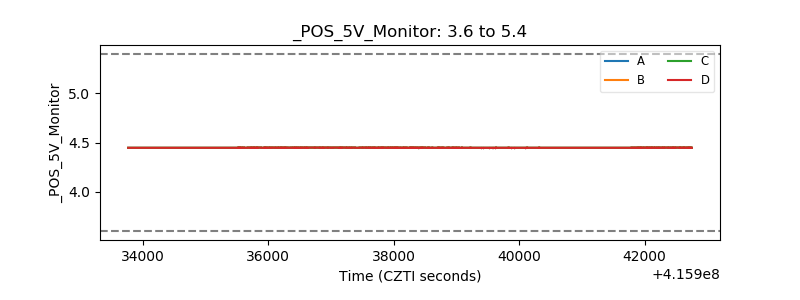 |
| _ROLL_ROT | 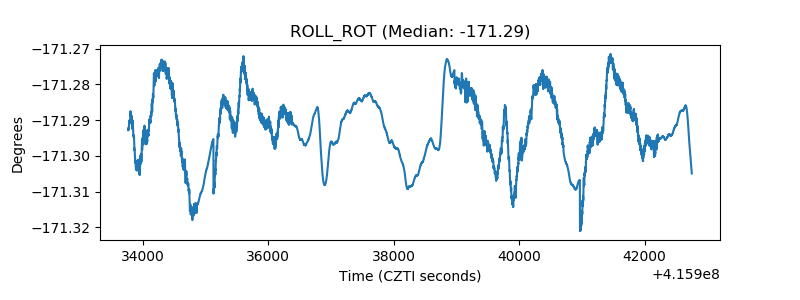 |
| _Roll_DEC | 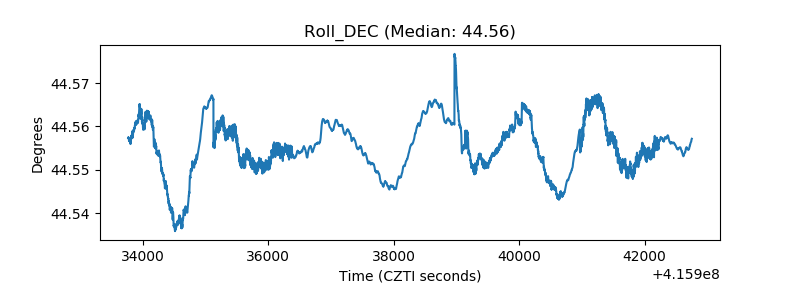 |
| _Roll_RA | 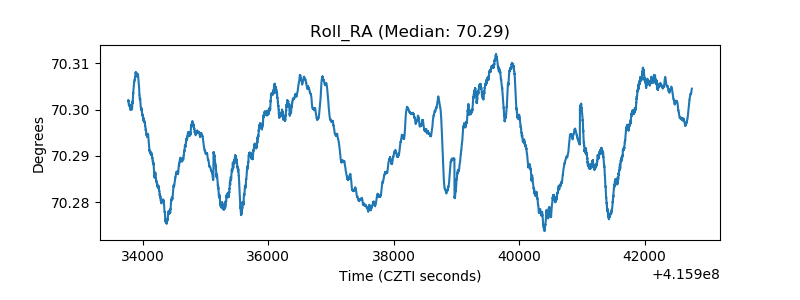 |
| Veto Counter | 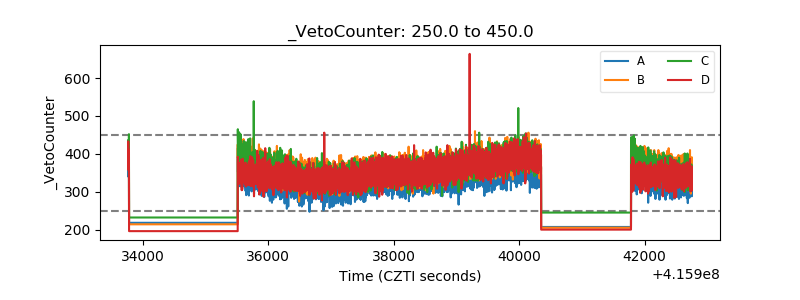 |