| Param | Original file | Final file |
|---|---|---|
| Filename | modeM0/AS1T05_086T01_9000005534_40234cztM0_level2.fits | modeM0/AS1T05_086T01_9000005534_40234cztM0_level2_quad_clean.evt |
| Size (bytes) | 384,431,040 | 101,183,040 |
| Size | 366.6 MB | 96.5 MB |
| Events in quadrant A | 3,691,563 | 672,848 |
| Events in quadrant B | 3,032,569 | 698,994 |
| Events in quadrant C | 3,043,058 | 673,854 |
| Events in quadrant D | 3,995,033 | 597,808 |
| Mode M0 | |||
|---|---|---|---|
| Quadrant | BADHDUFLAG | Total packets | Discarded packets |
| A | 0 | 14555 | 3 |
| B | 0 | 13066 | 2 |
| C | 0 | 12566 | 2 |
| D | 0 | 16111 | 2 |
| Mode M9 | |||
|---|---|---|---|
| Quadrant | BADHDUFLAG | Total packets | Discarded packets |
| A | 0 | 27 | 0 |
| B | 0 | 27 | 0 |
| C | 0 | 27 | 0 |
| D | 0 | 27 | 0 |
| Mode SS | |||
|---|---|---|---|
| Quadrant | BADHDUFLAG | Total packets | Discarded packets |
| A | 0 | 124 | 0 |
| B | 0 | 124 | 0 |
| C | 0 | 124 | 0 |
| D | 0 | 124 | 0 |
| Quadrant | Total seconds | Saturated seconds | Saturation percentage |
|---|---|---|---|
| A | 6016 | 129 | 2.144282% |
| B | 6016 | 60 | 0.997340% |
| C | 6016 | 19 | 0.315824% |
| D | 6016 | 240 | 3.989362% |
Noise dominated data is calculated using 1-second bins in cleaned event files. If a bin has >2000 counts, and if more than 50% of those come from <1% of pixels, then it is considered to be noise-dominated and hence unusable.
| Quadrant | # 1 sec bins | Bins with >0 counts | Bins with >2000 counts | High rate bins dominated by noise | Noise dominated (total time) | Noise dominated (detector-on time) | Marked lightcurve |
|---|---|---|---|---|---|---|---|
| A | 8762 | 6018 | 89 | 89 | 1.02% | 1.48% | 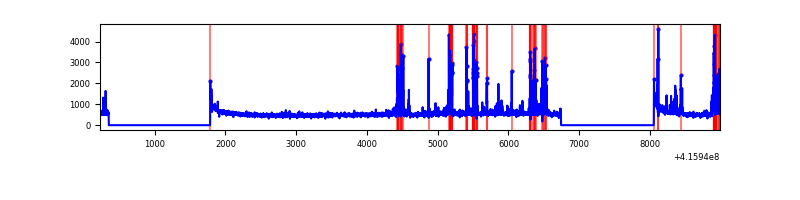 |
| B | 8762 | 6018 | 45 | 45 | 0.51% | 0.75% | 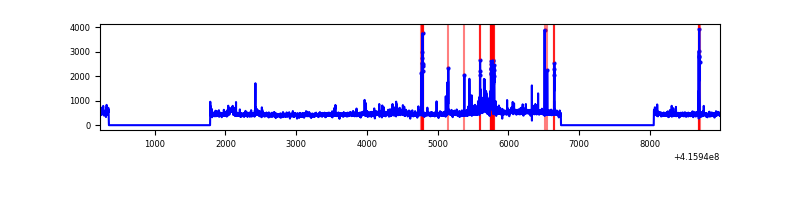 |
| C | 8762 | 6018 | 8 | 8 | 0.09% | 0.13% | 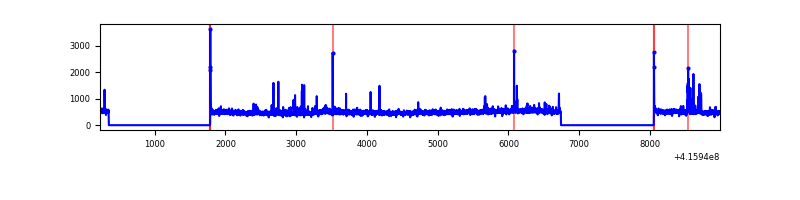 |
| D | 8762 | 6018 | 194 | 194 | 2.21% | 3.22% | 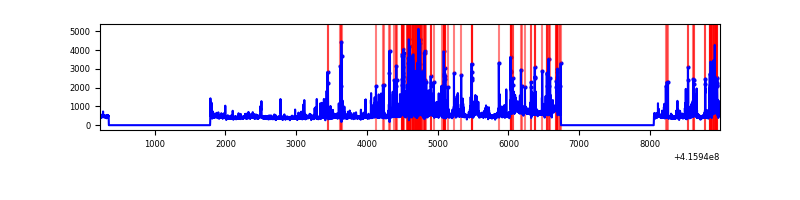 |
Top three noisy pixels from each quadrant. If the there are fewer than three noisy pixels in the level2.evt file, extra rows are filled as -1
| Pixel properties | Quadrant properties | ||||||
|---|---|---|---|---|---|---|---|
| Quadrant | DetID | PixID | Counts | Sigma | Mean | Median | Sigma |
| A | 10 | 83 | 537430 | 3888.13 | 669 | 655 | 138.1 |
| A | 13 | 248 | 511433 | 3699.82 | 669 | 655 | 138.1 |
| A | 6 | 10 | 17982 | 125.51 | 669 | 655 | 138.1 |
| B | 0 | 229 | 124298 | 941.46 | 672 | 656 | 131.3 |
| B | 0 | 221 | 78266 | 590.95 | 672 | 656 | 131.3 |
| B | 5 | 255 | 77271 | 583.37 | 672 | 656 | 131.3 |
| C | 15 | 214 | 259733 | 1668.11 | 659 | 664 | 155.3 |
| C | 14 | 254 | 79739 | 509.15 | 659 | 664 | 155.3 |
| C | 9 | 187 | 60889 | 387.78 | 659 | 664 | 155.3 |
| D | 12 | 227 | 1027515 | 6396.51 | 647 | 629 | 160.5 |
| D | 13 | 249 | 154161 | 956.36 | 647 | 629 | 160.5 |
| D | 9 | 19 | 96145 | 594.97 | 647 | 629 | 160.5 |
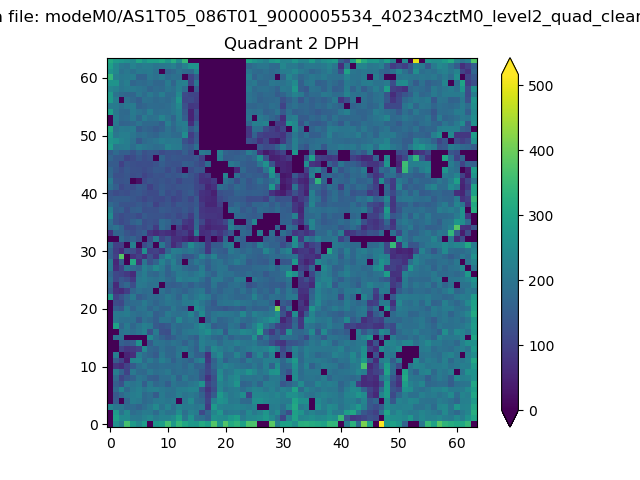
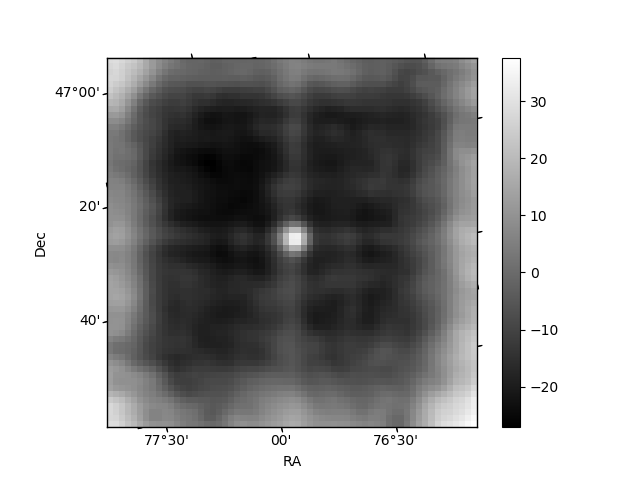
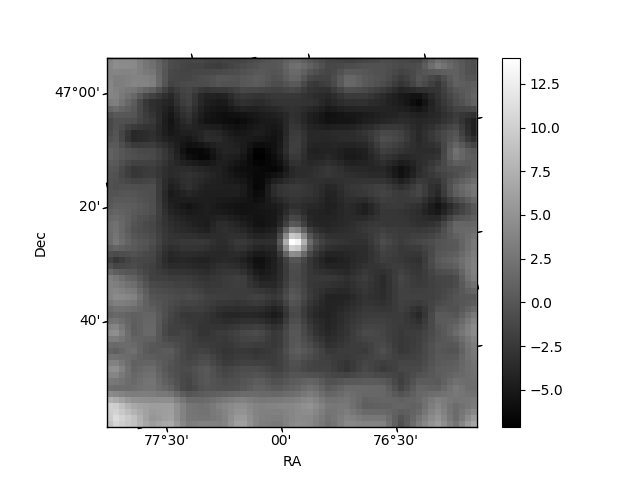
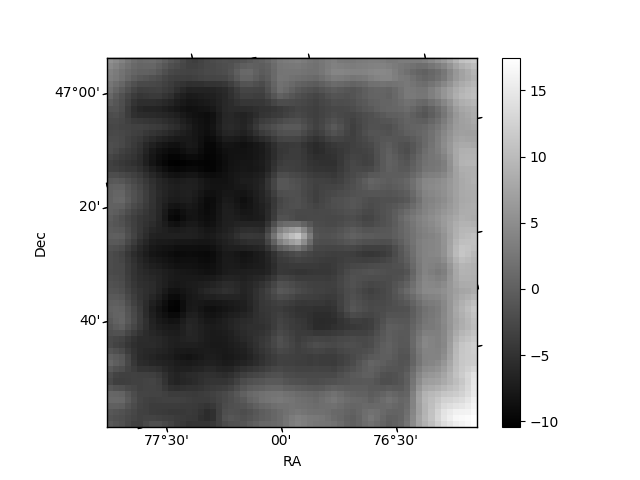
Histogram calculated using DETX and DETY for each event in the final _common_clean file
| Quadrant A | 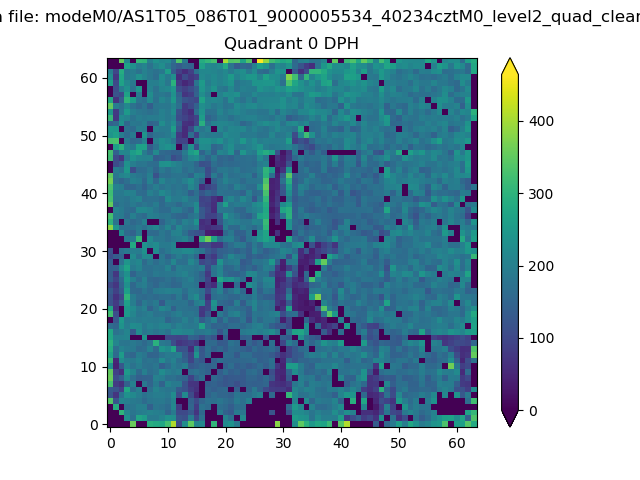 |
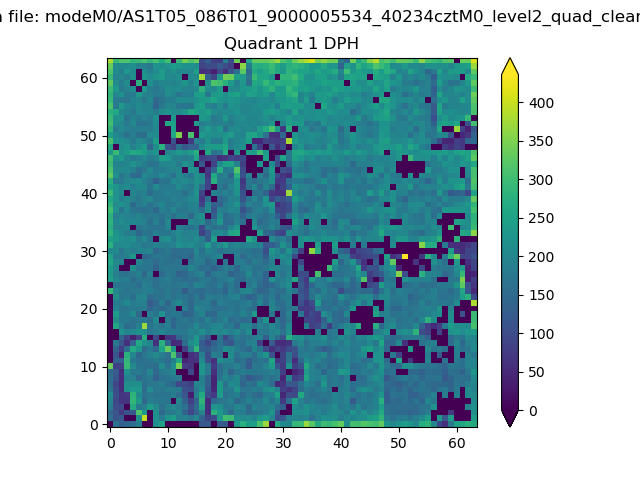 |
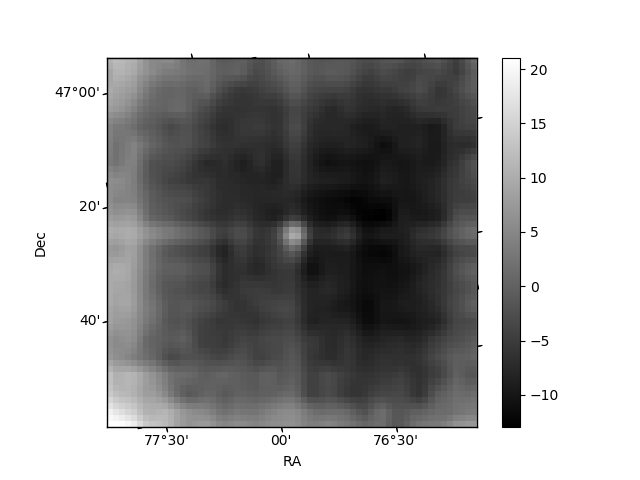
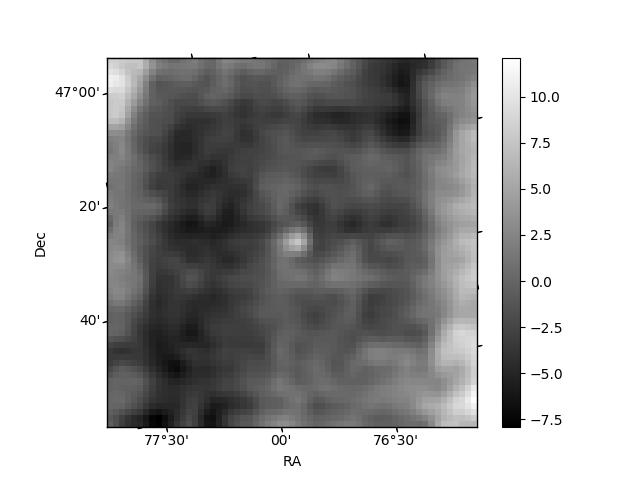
Quadrant B |
|---|---|---|---|
| Quadrant D | 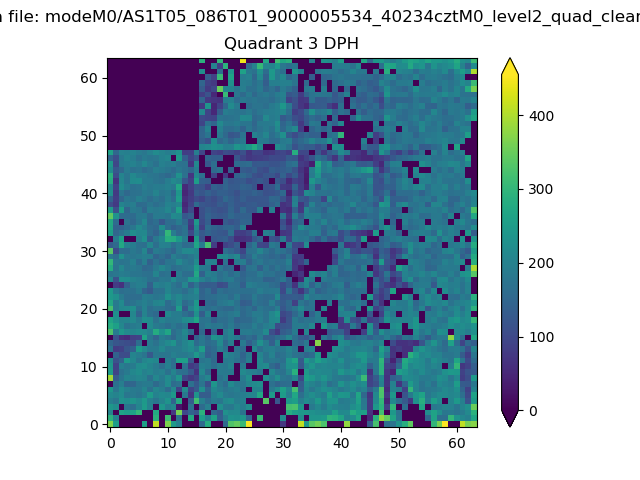 |
 |
Quadrant C |
| Plot type | Count rate plots | Images |
|---|---|---|
| Comparison with Poisson distribution Blue bars denote a histogram of data divided into 1 sec bins. Red curve is a Poisson curve with rate = median count rate of data. |
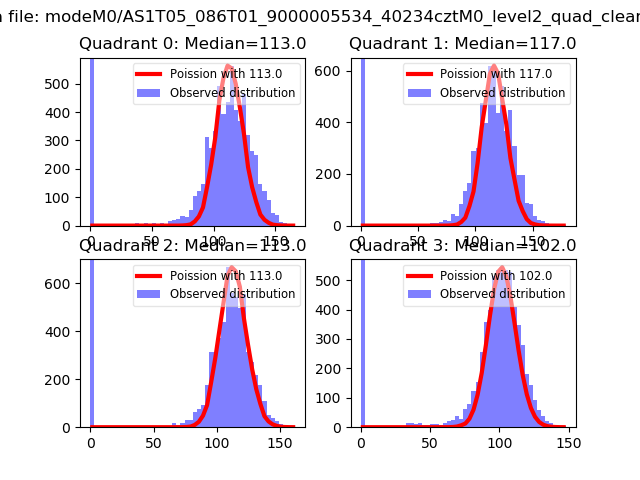 |
 |
| Quadrant-wise count rates Data is divided into 100 sec bins |
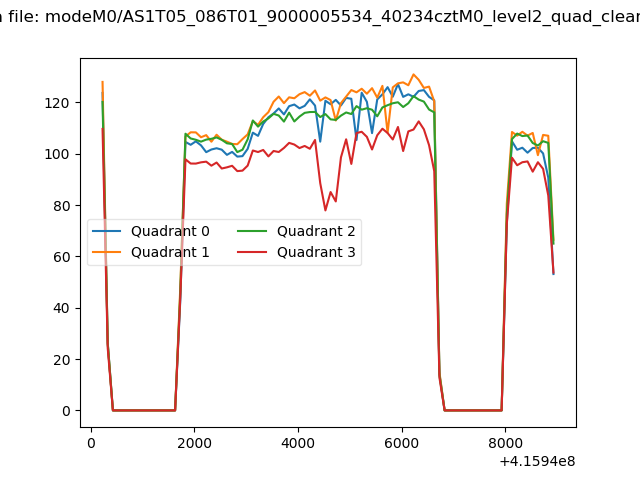 |
|
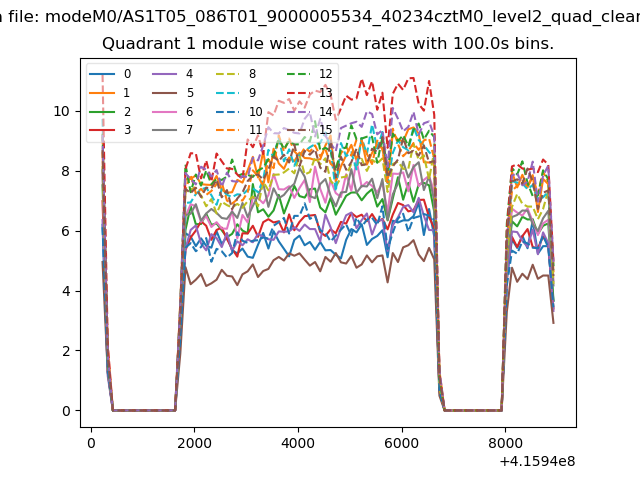
| Module-wise count rates for Quadrant A Data is divided into 100 sec bins |
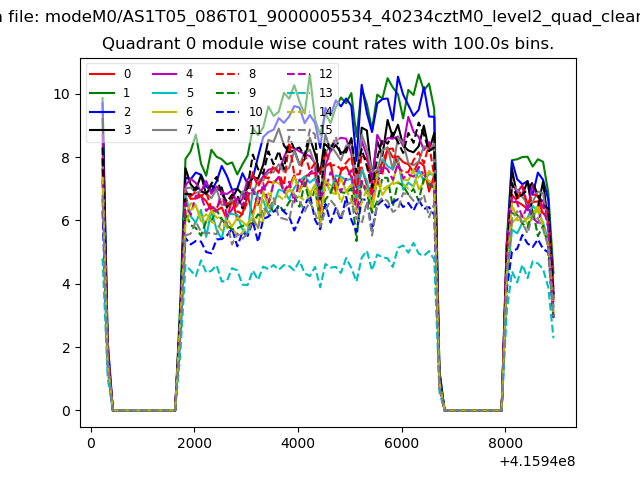 |
 |
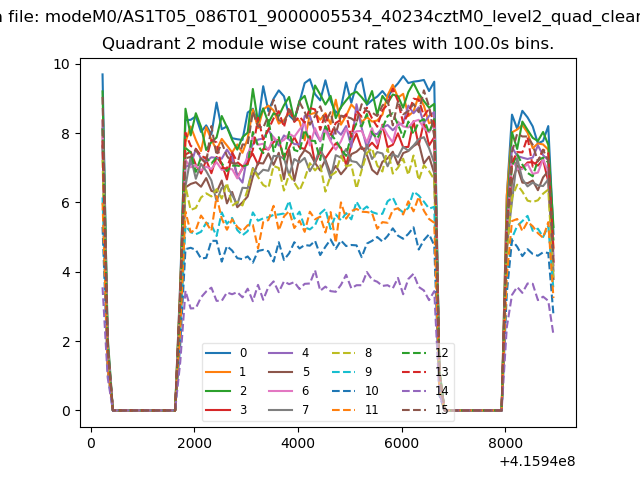
| Module-wise count rates for Quadrant B Data is divided into 100 sec bins |
 |
 |
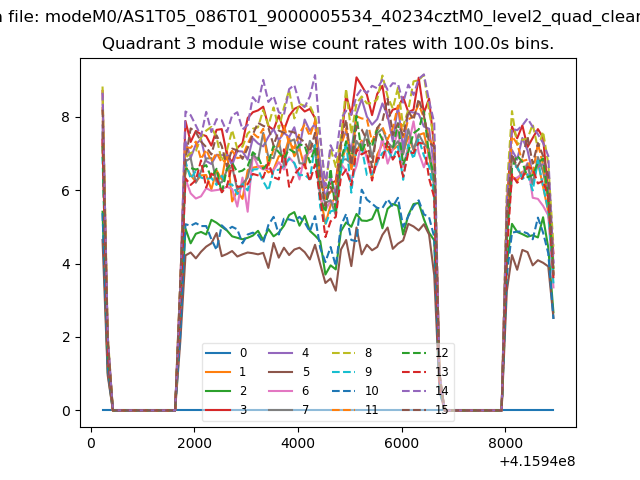
| Module-wise count rates for Quadrant C Data is divided into 100 sec bins |
 |
 |
| Module-wise count rates for Quadrant D Data is divided into 100 sec bins |
 |
 |
| Parameter | Plot |
|---|---|
| CZT HV Monitor | 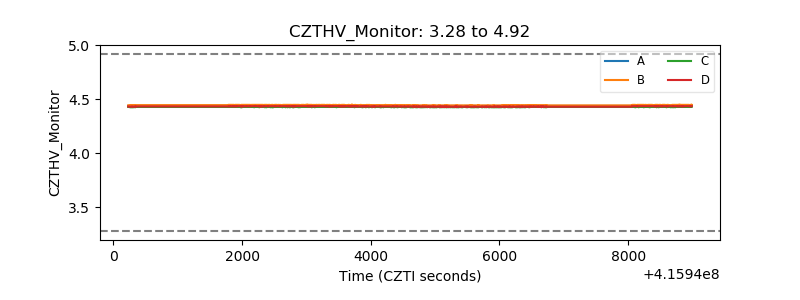 |
| D_VDD | 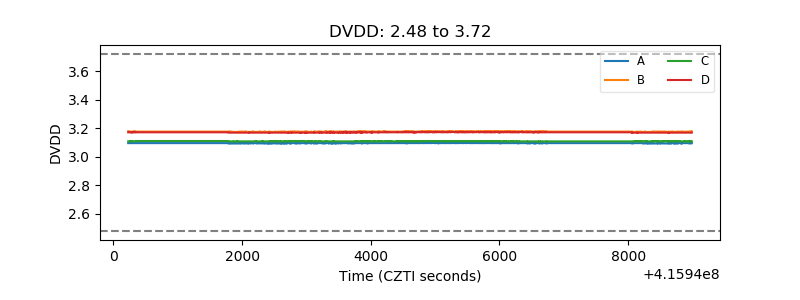 |
| Temperature 1 | 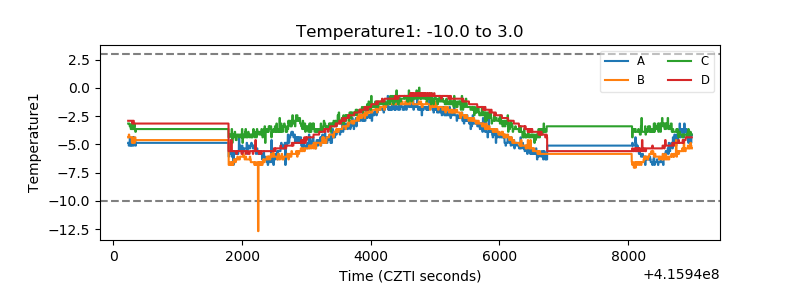 |
| Veto HV Monitor | 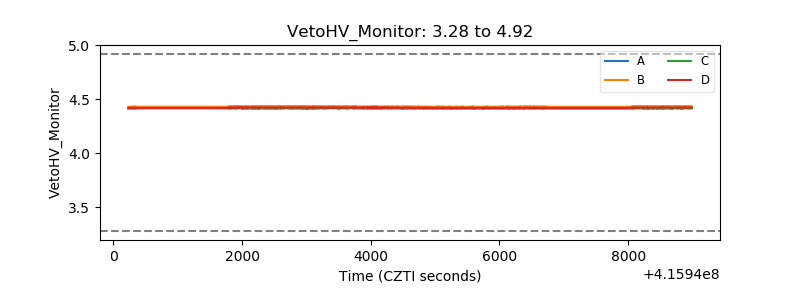 |
| Veto LLD | 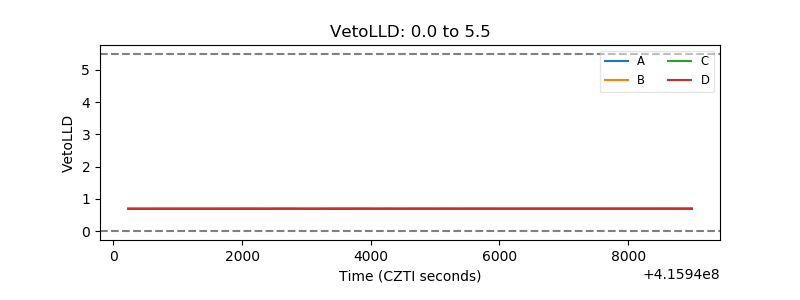 |
| Alpha Counter | 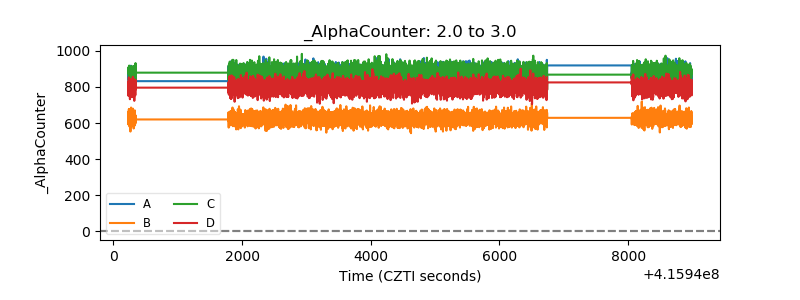 |
| _CPM_Rate | 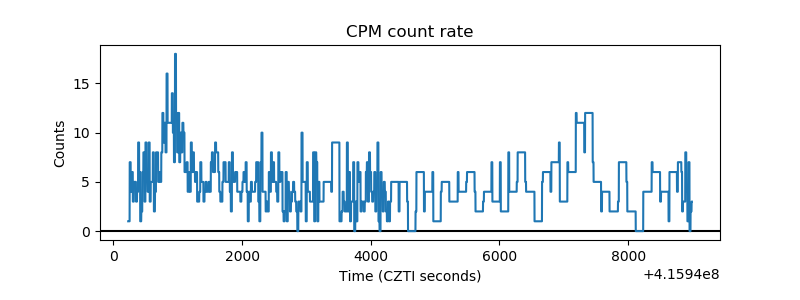 |
| CZT Counter | 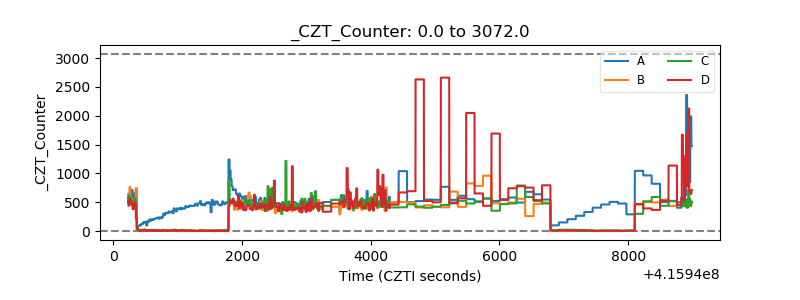 |
| +2.5 Volts monitor |  |
| +5 Volts monitor |  |
| _ROLL_ROT | 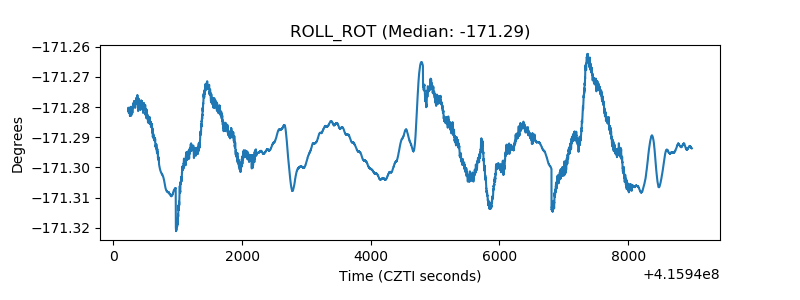 |
| _Roll_DEC | 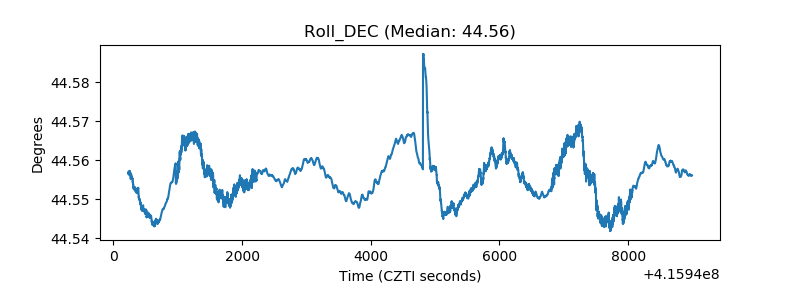 |
| _Roll_RA | 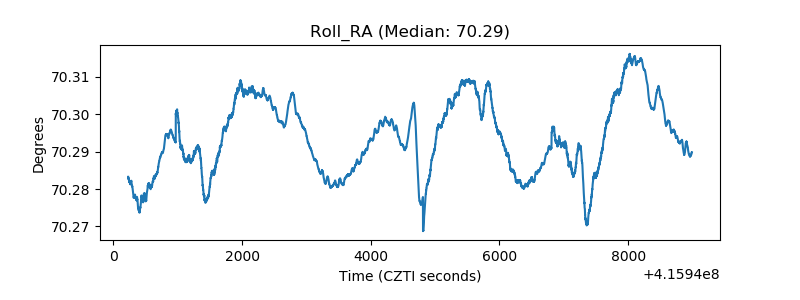 |
| Veto Counter | 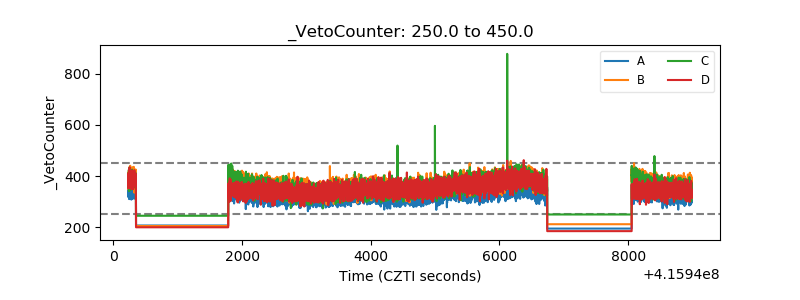 |