| Param | Original file | Final file |
|---|---|---|
| Filename | modeM0/AS1T05_086T01_9000005534_40237cztM0_level2.fits | modeM0/AS1T05_086T01_9000005534_40237cztM0_level2_quad_clean.evt |
| Size (bytes) | 1,151,573,760 | 263,099,520 |
| Size | 1.1 GB | 250.9 MB |
| Events in quadrant A | 10,144,159 | 1,810,592 |
| Events in quadrant B | 8,008,603 | 1,895,432 |
| Events in quadrant C | 11,322,525 | 1,657,847 |
| Events in quadrant D | 11,921,747 | 1,504,989 |
| Mode M0 | |||
|---|---|---|---|
| Quadrant | BADHDUFLAG | Total packets | Discarded packets |
| A | 0 | 39467 | 5 |
| B | 0 | 34123 | 4 |
| C | 0 | 43391 | 4 |
| D | 0 | 46232 | 4 |
| Mode M9 | |||
|---|---|---|---|
| Quadrant | BADHDUFLAG | Total packets | Discarded packets |
| A | 0 | 56 | 0 |
| B | 0 | 56 | 0 |
| C | 0 | 56 | 0 |
| D | 0 | 56 | 0 |
| Mode SS | |||
|---|---|---|---|
| Quadrant | BADHDUFLAG | Total packets | Discarded packets |
| A | 0 | 326 | 0 |
| B | 0 | 326 | 0 |
| C | 0 | 326 | 0 |
| D | 0 | 326 | 0 |
| Quadrant | Total seconds | Saturated seconds | Saturation percentage |
|---|---|---|---|
| A | 15902 | 516 | 3.244875% |
| B | 15902 | 132 | 0.830084% |
| C | 15902 | 1205 | 7.577663% |
| D | 15902 | 1223 | 7.690856% |
Noise dominated data is calculated using 1-second bins in cleaned event files. If a bin has >2000 counts, and if more than 50% of those come from <1% of pixels, then it is considered to be noise-dominated and hence unusable.
| Quadrant | # 1 sec bins | Bins with >0 counts | Bins with >2000 counts | High rate bins dominated by noise | Noise dominated (total time) | Noise dominated (detector-on time) | Marked lightcurve |
|---|---|---|---|---|---|---|---|
| A | 21423 | 15906 | 359 | 359 | 1.68% | 2.26% | 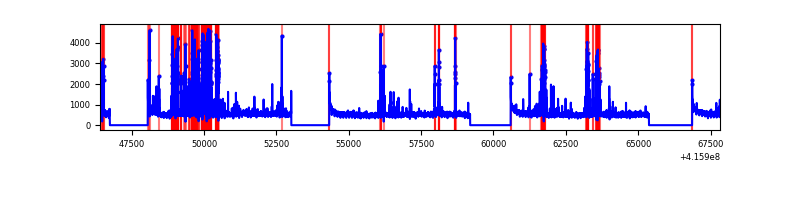 |
| B | 21423 | 15906 | 69 | 69 | 0.32% | 0.43% | 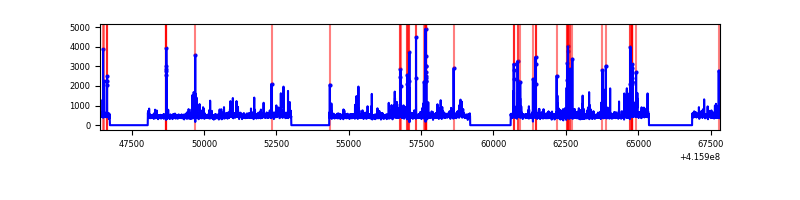 |
| C | 21423 | 15906 | 1000 | 1000 | 4.67% | 6.29% | 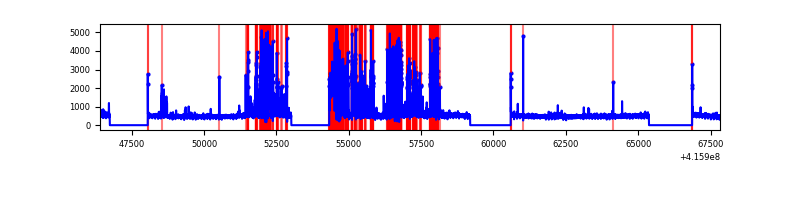 |
| D | 21422 | 15904 | 1121 | 1121 | 5.23% | 7.05% | 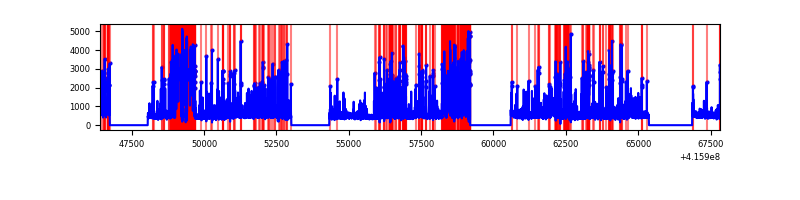 |
Top three noisy pixels from each quadrant. If the there are fewer than three noisy pixels in the level2.evt file, extra rows are filled as -1
| Pixel properties | Quadrant properties | ||||||
|---|---|---|---|---|---|---|---|
| Quadrant | DetID | PixID | Counts | Sigma | Mean | Median | Sigma |
| A | 13 | 248 | 1694923 | 4675.99 | 1777 | 1747 | 362.1 |
| A | 10 | 83 | 1318398 | 3636.15 | 1777 | 1747 | 362.1 |
| A | 6 | 10 | 124465 | 338.91 | 1777 | 1747 | 362.1 |
| B | 5 | 255 | 526717 | 1520.52 | 1791 | 1745 | 345.3 |
| B | 0 | 221 | 178809 | 512.84 | 1791 | 1745 | 345.3 |
| B | 0 | 230 | 73821 | 208.76 | 1791 | 1745 | 345.3 |
| C | 5 | 250 | 3762480 | 9644.62 | 1679 | 1695 | 389.9 |
| C | 15 | 214 | 651638 | 1666.79 | 1679 | 1695 | 389.9 |
| C | 10 | 22 | 79204 | 198.77 | 1679 | 1695 | 389.9 |
| D | 12 | 227 | 3968379 | 9635.37 | 1674 | 1631 | 411.7 |
| D | 13 | 249 | 491370 | 1189.59 | 1674 | 1631 | 411.7 |
| D | 9 | 19 | 300997 | 727.17 | 1674 | 1631 | 411.7 |
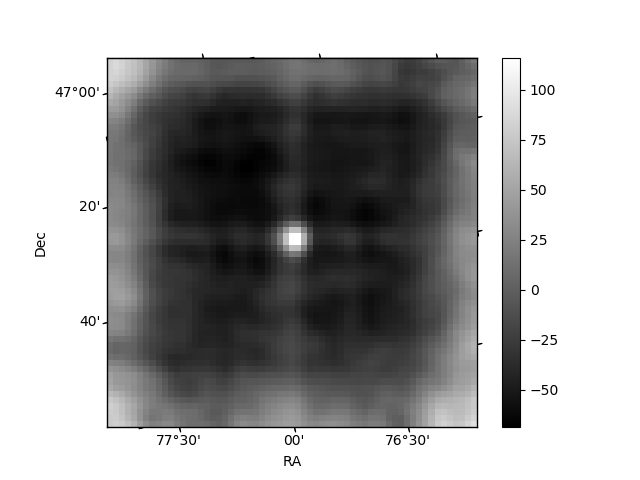
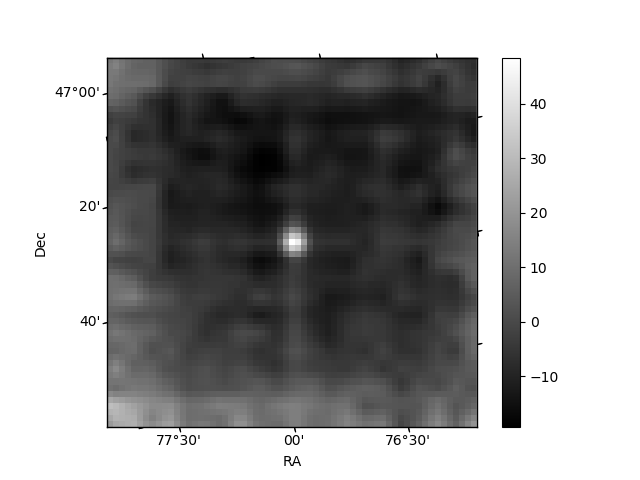
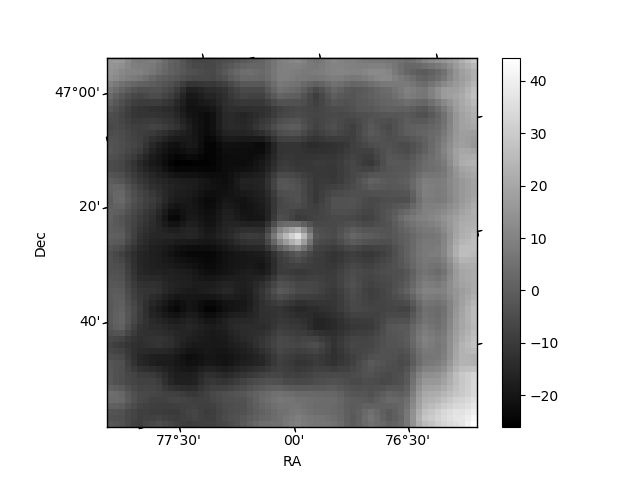
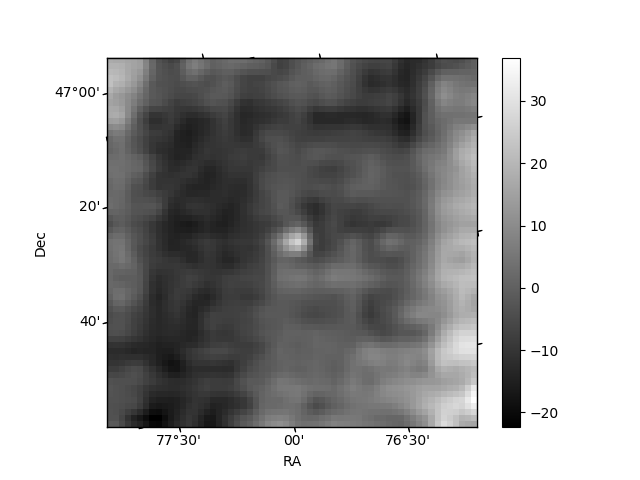
Histogram calculated using DETX and DETY for each event in the final _common_clean file
| Quadrant A | 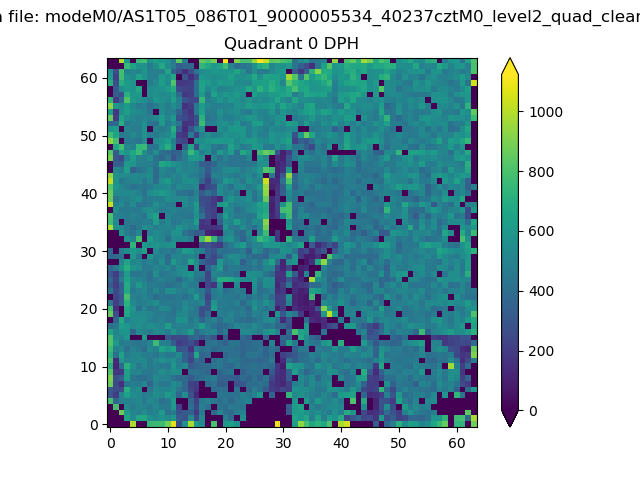 |
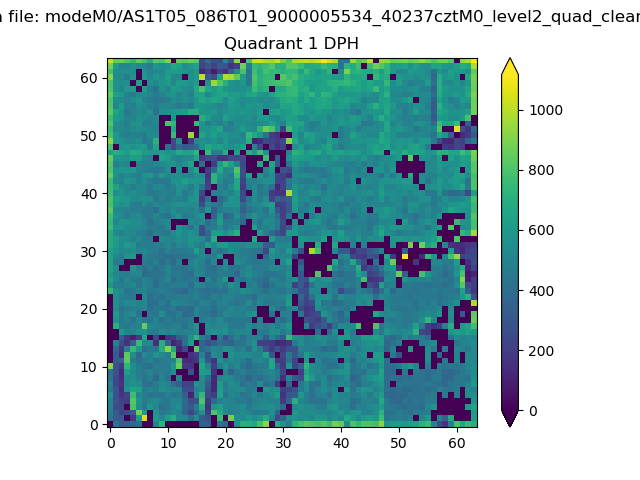 |
Quadrant B |
|---|---|---|---|
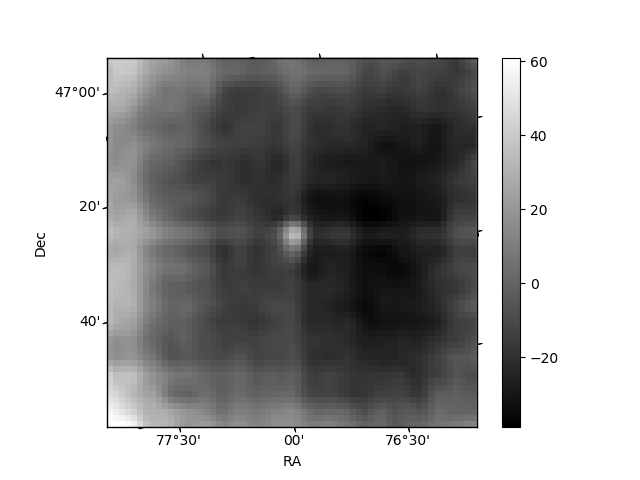
| Quadrant D | 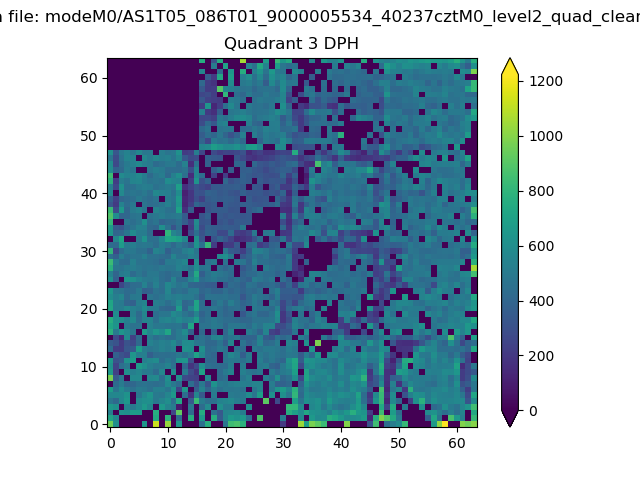 |
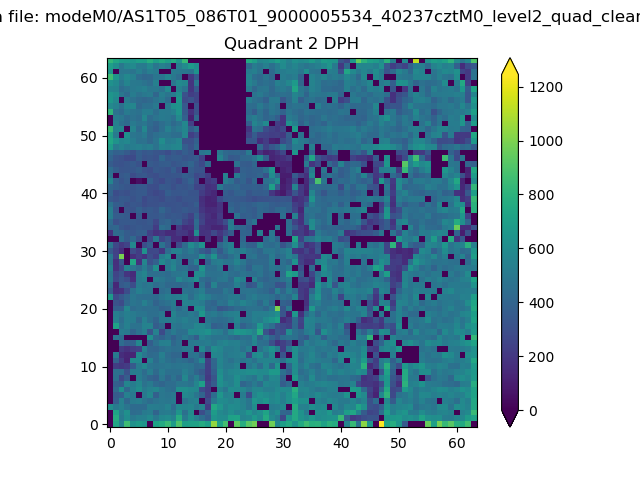 |
Quadrant C |
| Plot type | Count rate plots | Images |
|---|---|---|
| Comparison with Poisson distribution Blue bars denote a histogram of data divided into 1 sec bins. Red curve is a Poisson curve with rate = median count rate of data. |
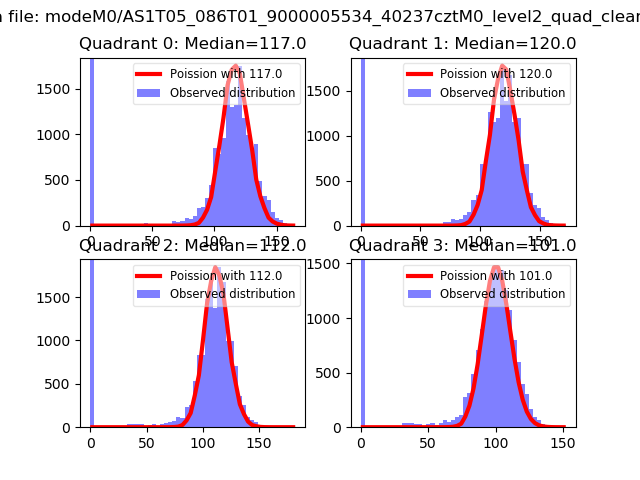 |
 |
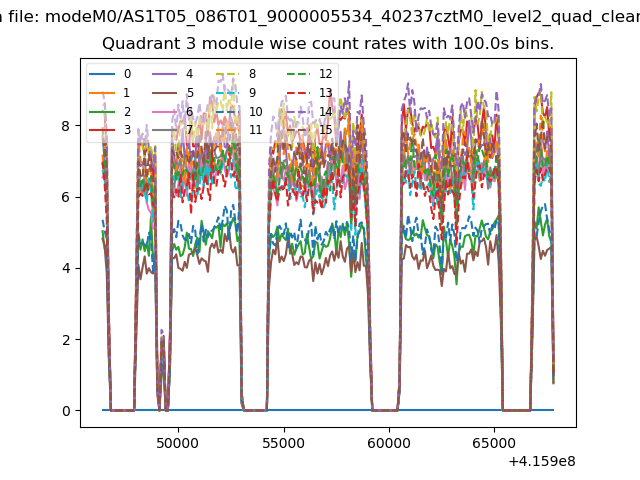
| Quadrant-wise count rates Data is divided into 100 sec bins |
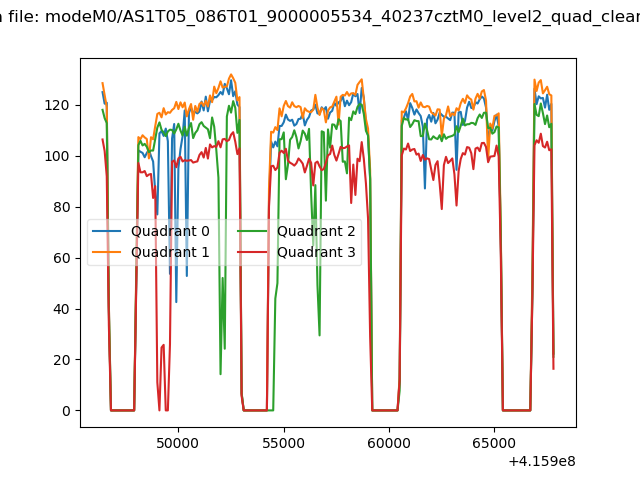 |
|
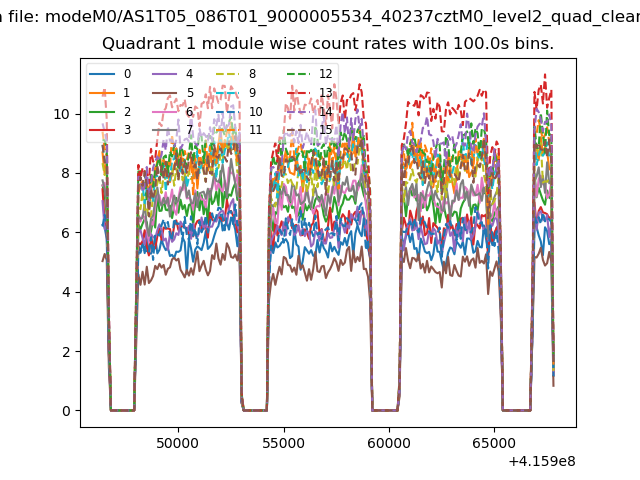
| Module-wise count rates for Quadrant A Data is divided into 100 sec bins |
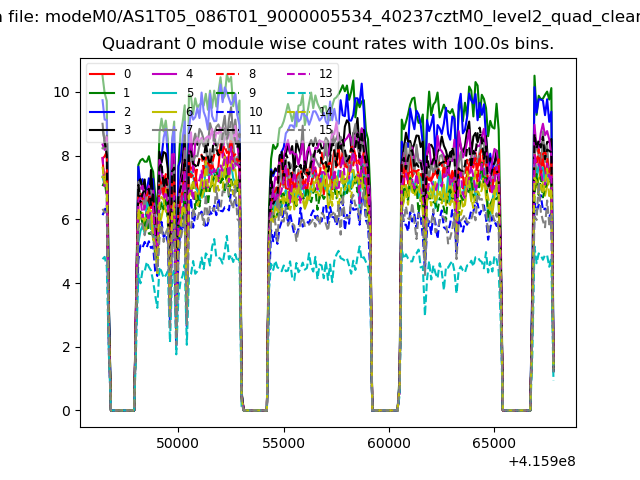 |
 |
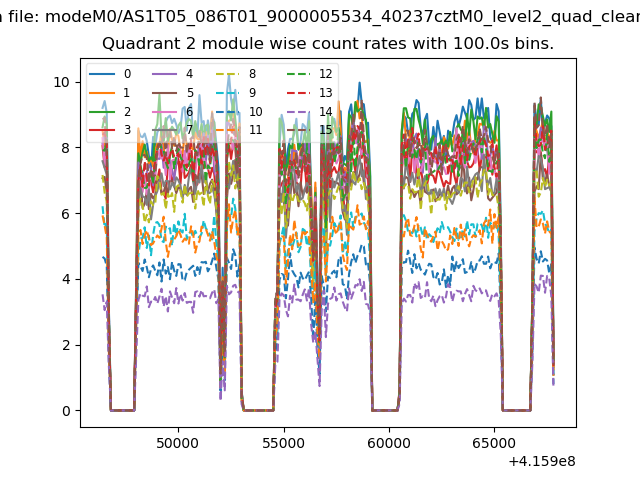
| Module-wise count rates for Quadrant B Data is divided into 100 sec bins |
 |
 |
| Module-wise count rates for Quadrant C Data is divided into 100 sec bins |
 |
 |
| Module-wise count rates for Quadrant D Data is divided into 100 sec bins |
 |
 |
| Parameter | Plot |
|---|---|
| CZT HV Monitor | 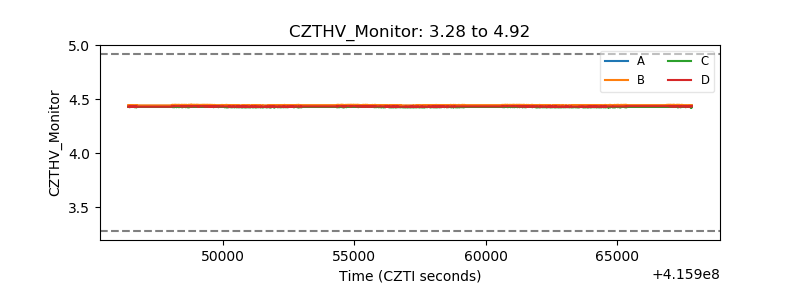 |
| D_VDD | 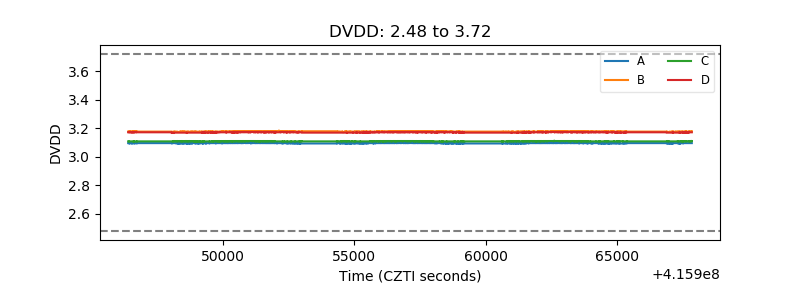 |
| Temperature 1 | 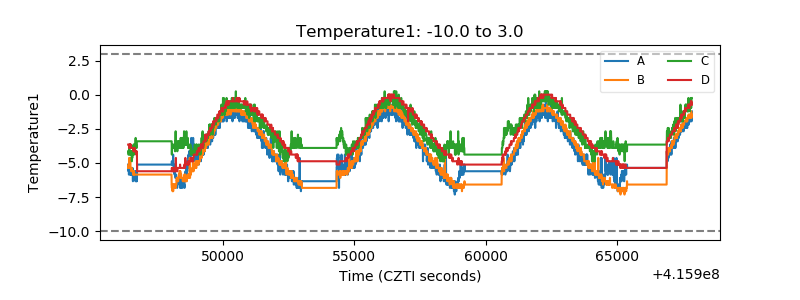 |
| Veto HV Monitor | 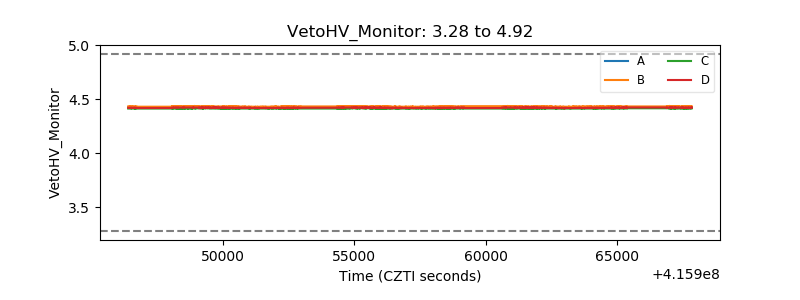 |
| Veto LLD | 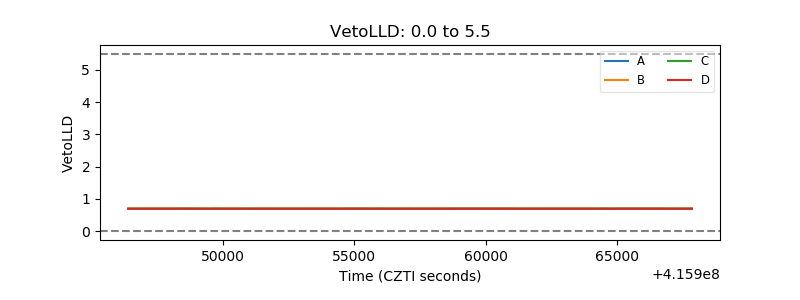 |
| Alpha Counter | 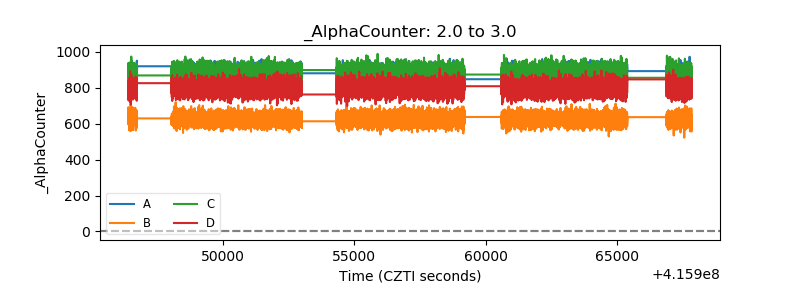 |
| _CPM_Rate | 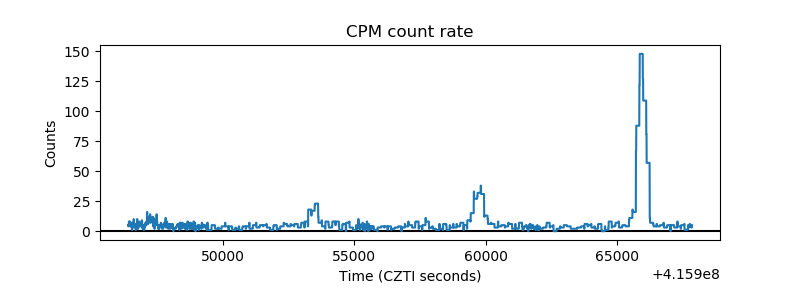 |
| CZT Counter | 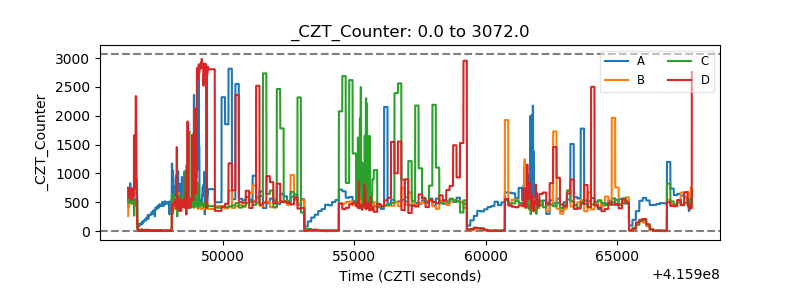 |
| +2.5 Volts monitor | 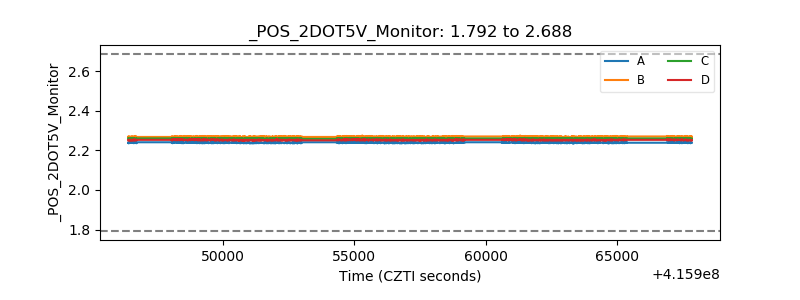 |
| +5 Volts monitor | 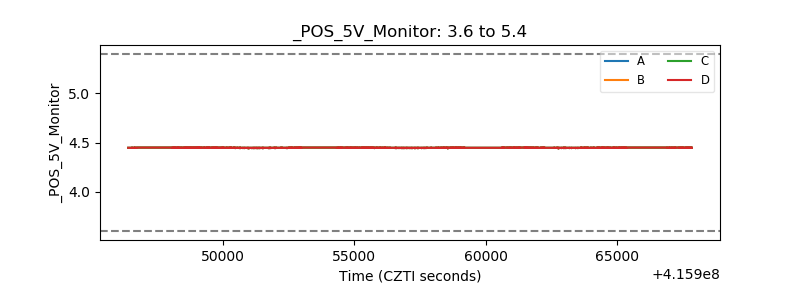 |
| _ROLL_ROT | 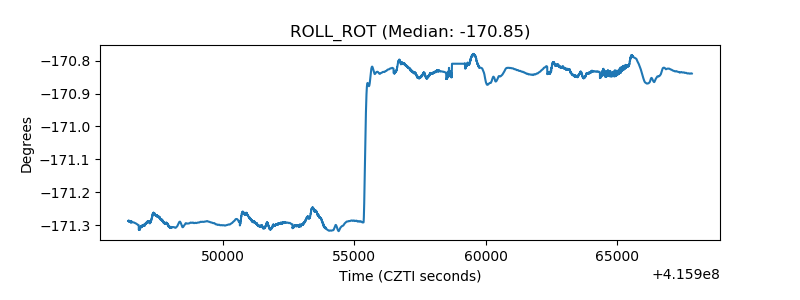 |
| _Roll_DEC | 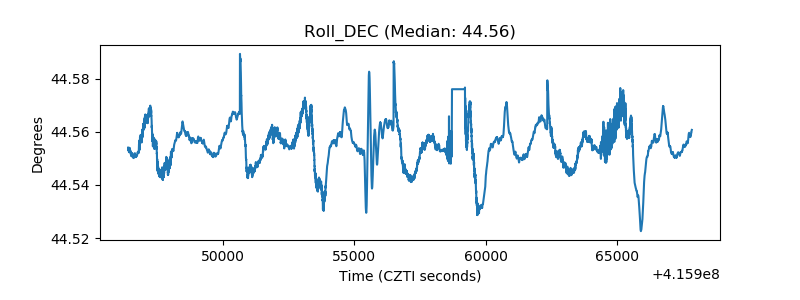 |
| _Roll_RA | 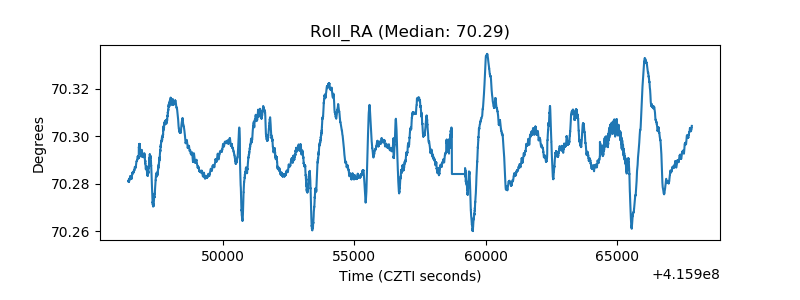 |
| Veto Counter | 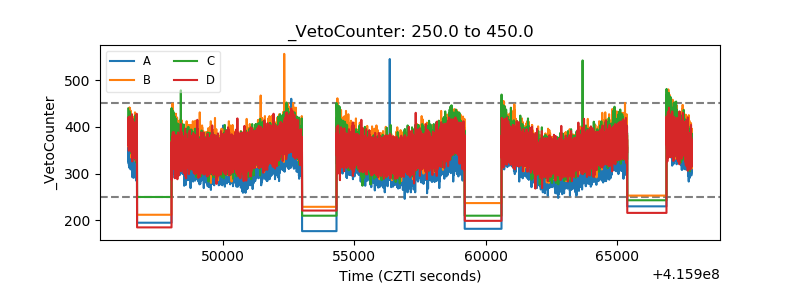 |