| Param | Original file | Final file |
|---|---|---|
| Filename | modeM0/AS1T05_086T01_9000005534_40238cztM0_level2.fits | modeM0/AS1T05_086T01_9000005534_40238cztM0_level2_quad_clean.evt |
| Size (bytes) | 379,676,160 | 94,187,520 |
| Size | 362.1 MB | 89.8 MB |
| Events in quadrant A | 3,285,700 | 648,750 |
| Events in quadrant B | 2,712,464 | 671,102 |
| Events in quadrant C | 2,658,912 | 630,397 |
| Events in quadrant D | 4,968,512 | 516,254 |
| Mode M0 | |||
|---|---|---|---|
| Quadrant | BADHDUFLAG | Total packets | Discarded packets |
| A | 0 | 13136 | 2 |
| B | 0 | 11723 | 1 |
| C | 0 | 11234 | 1 |
| D | 0 | 18345 | 1 |
| Mode M9 | |||
|---|---|---|---|
| Quadrant | BADHDUFLAG | Total packets | Discarded packets |
| A | 0 | 16 | 0 |
| B | 0 | 16 | 0 |
| C | 0 | 16 | 0 |
| D | 0 | 16 | 0 |
| Mode SS | |||
|---|---|---|---|
| Quadrant | BADHDUFLAG | Total packets | Discarded packets |
| A | 0 | 112 | 0 |
| B | 0 | 112 | 0 |
| C | 0 | 112 | 0 |
| D | 0 | 112 | 0 |
| Quadrant | Total seconds | Saturated seconds | Saturation percentage |
|---|---|---|---|
| A | 5507 | 81 | 1.470855% |
| B | 5507 | 30 | 0.544761% |
| C | 5507 | 8 | 0.145270% |
| D | 5507 | 722 | 13.110587% |
Noise dominated data is calculated using 1-second bins in cleaned event files. If a bin has >2000 counts, and if more than 50% of those come from <1% of pixels, then it is considered to be noise-dominated and hence unusable.
| Quadrant | # 1 sec bins | Bins with >0 counts | Bins with >2000 counts | High rate bins dominated by noise | Noise dominated (total time) | Noise dominated (detector-on time) | Marked lightcurve |
|---|---|---|---|---|---|---|---|
| A | 7119 | 5508 | 54 | 54 | 0.76% | 0.98% | 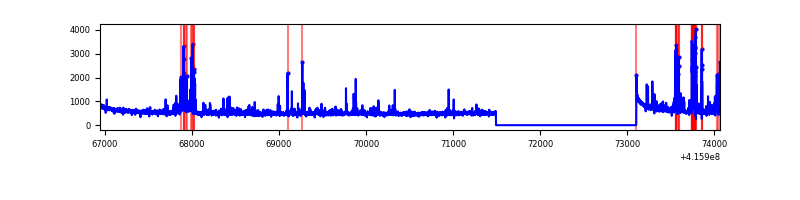 |
| B | 7119 | 5508 | 14 | 14 | 0.20% | 0.25% | 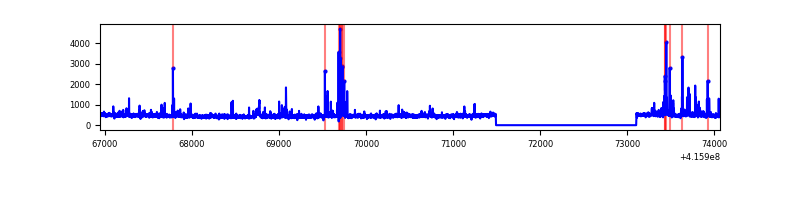 |
| C | 7119 | 5508 | 3 | 3 | 0.04% | 0.05% | 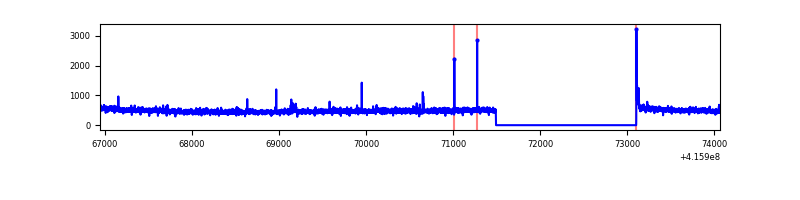 |
| D | 7119 | 5508 | 645 | 645 | 9.06% | 11.71% | 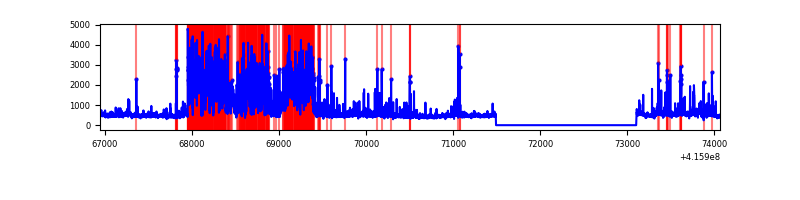 |
Top three noisy pixels from each quadrant. If the there are fewer than three noisy pixels in the level2.evt file, extra rows are filled as -1
| Pixel properties | Quadrant properties | ||||||
|---|---|---|---|---|---|---|---|
| Quadrant | DetID | PixID | Counts | Sigma | Mean | Median | Sigma |
| A | 10 | 83 | 475867 | 3706.49 | 618 | 606 | 128.2 |
| A | 13 | 248 | 300100 | 2335.71 | 618 | 606 | 128.2 |
| A | 2 | 79 | 85305 | 660.55 | 618 | 606 | 128.2 |
| B | 5 | 255 | 113844 | 937.66 | 617 | 600 | 120.8 |
| B | 4 | 171 | 97826 | 805.03 | 617 | 600 | 120.8 |
| B | 0 | 221 | 30961 | 251.39 | 617 | 600 | 120.8 |
| C | 15 | 214 | 238971 | 1681.72 | 604 | 609 | 141.7 |
| C | 0 | 10 | 16729 | 113.73 | 604 | 609 | 141.7 |
| C | 9 | 187 | 13711 | 92.44 | 604 | 609 | 141.7 |
| D | 12 | 233 | 2001944 | 13933.41 | 573 | 558 | 143.6 |
| D | 12 | 227 | 481873 | 3350.86 | 573 | 558 | 143.6 |
| D | 13 | 249 | 118995 | 824.54 | 573 | 558 | 143.6 |
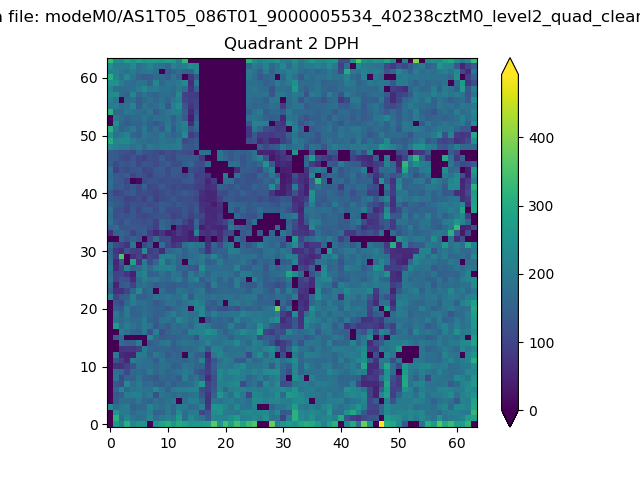
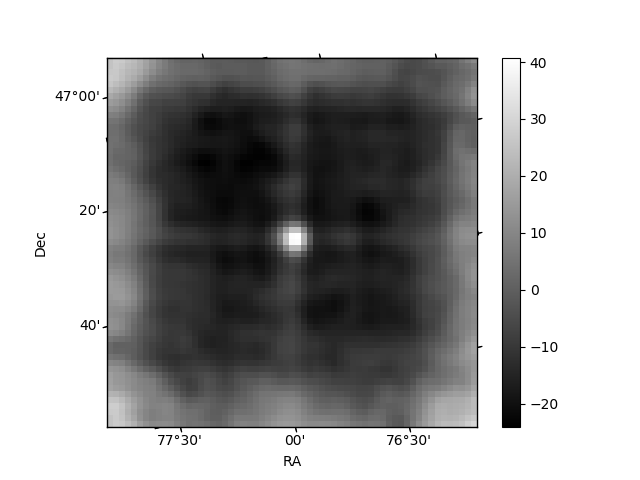
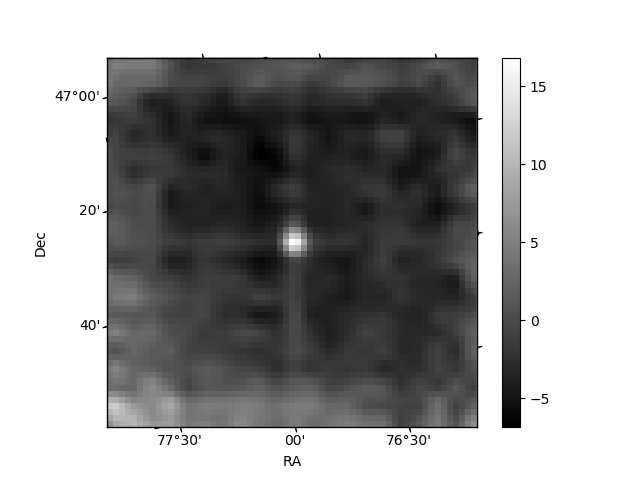
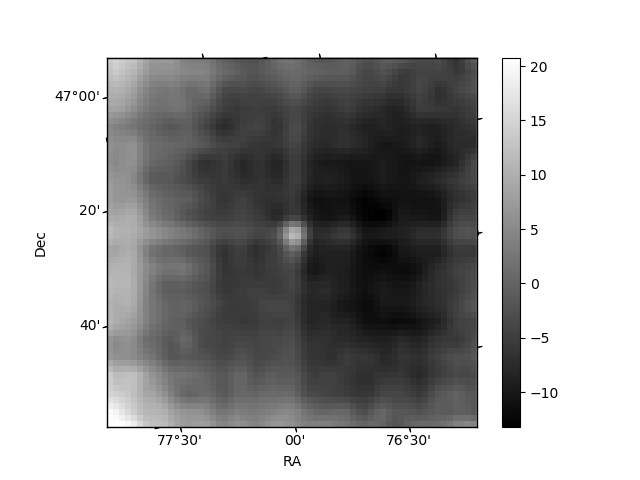
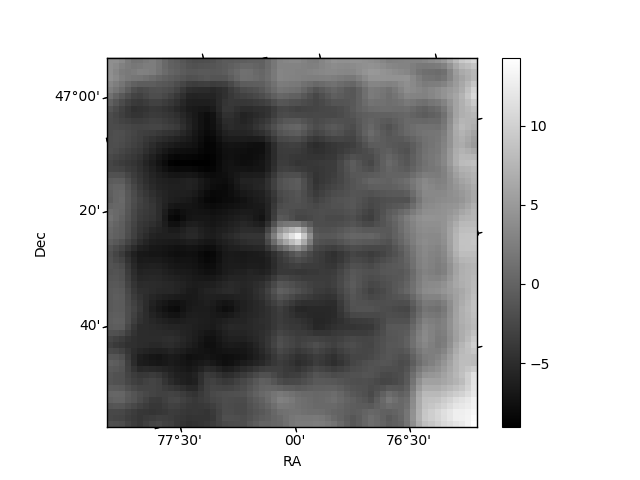
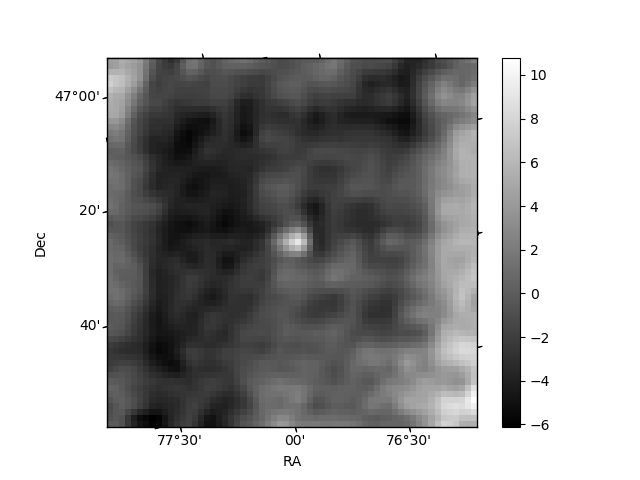
Histogram calculated using DETX and DETY for each event in the final _common_clean file
| Quadrant A | 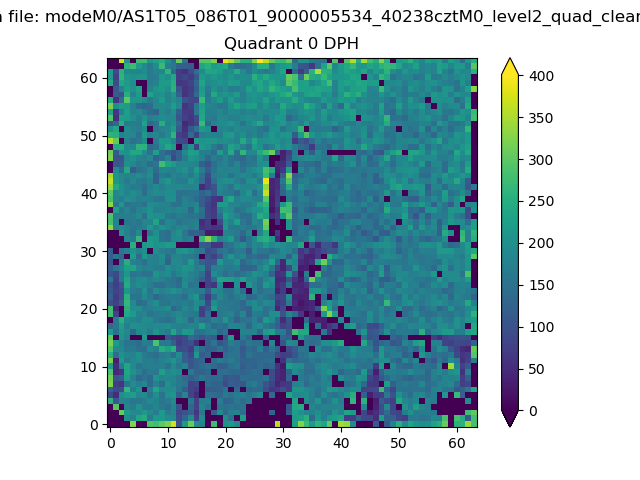 |
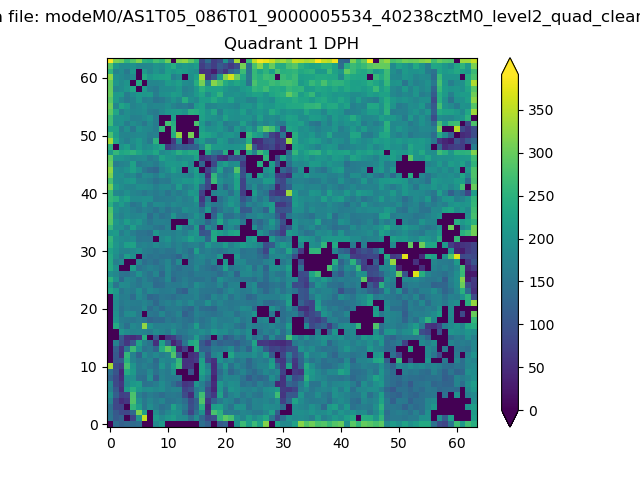 |
Quadrant B |
|---|---|---|---|
| Quadrant D | 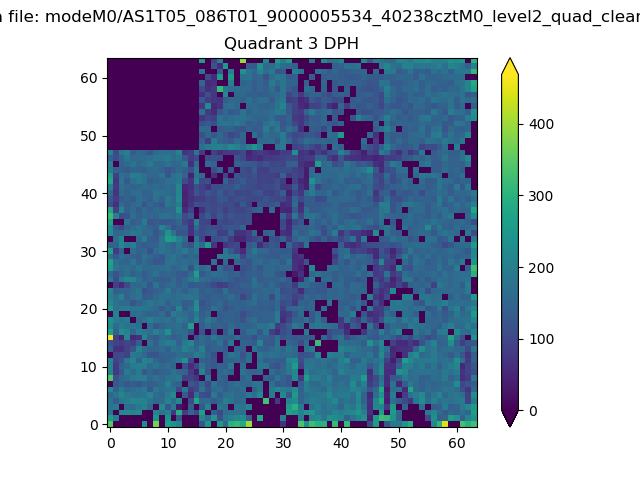 |
 |
Quadrant C |
| Plot type | Count rate plots | Images |
|---|---|---|
| Comparison with Poisson distribution Blue bars denote a histogram of data divided into 1 sec bins. Red curve is a Poisson curve with rate = median count rate of data. |
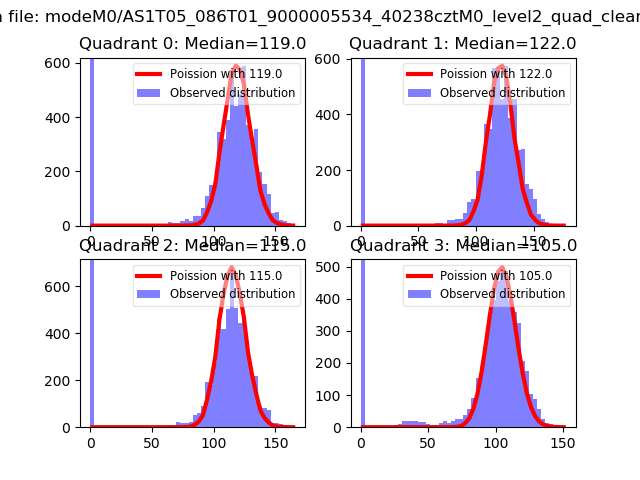 |
 |
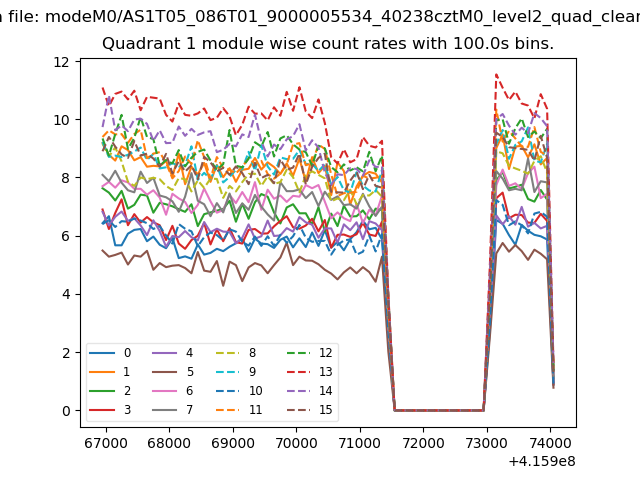
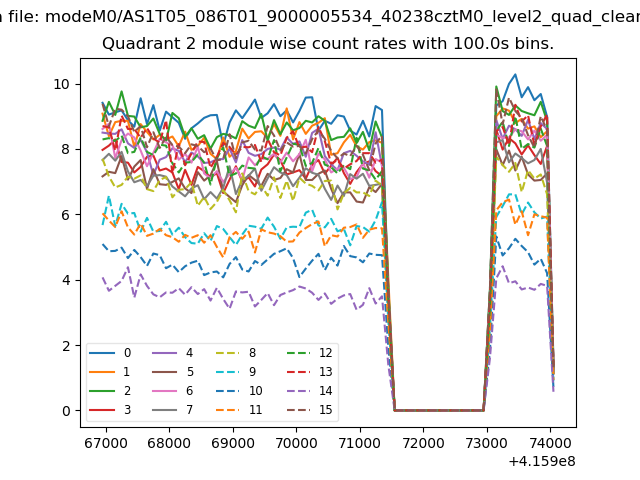
| Quadrant-wise count rates Data is divided into 100 sec bins |
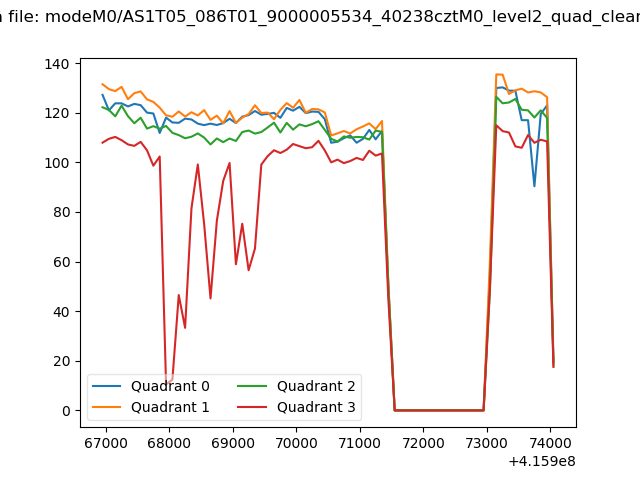 |
|
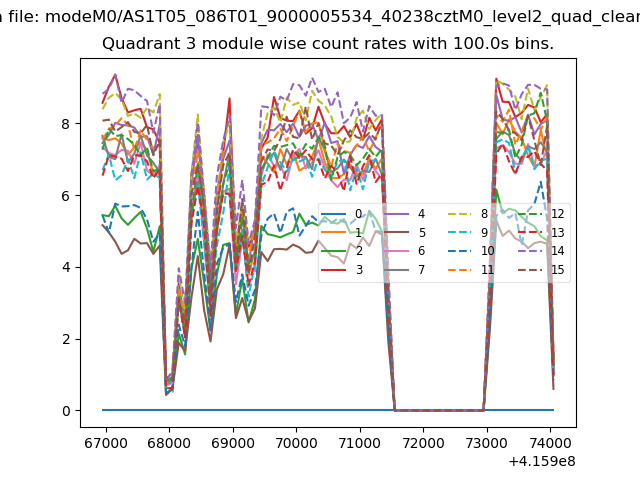
| Module-wise count rates for Quadrant A Data is divided into 100 sec bins |
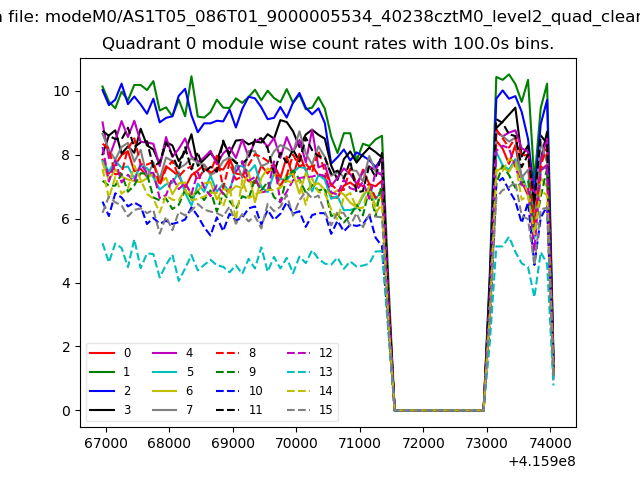 |
 |
| Module-wise count rates for Quadrant B Data is divided into 100 sec bins |
 |
 |
| Module-wise count rates for Quadrant C Data is divided into 100 sec bins |
 |
 |
| Module-wise count rates for Quadrant D Data is divided into 100 sec bins |
 |
 |
| Parameter | Plot |
|---|---|
| CZT HV Monitor | 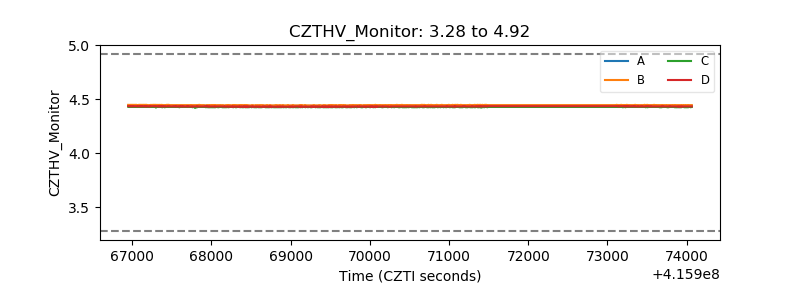 |
| D_VDD | 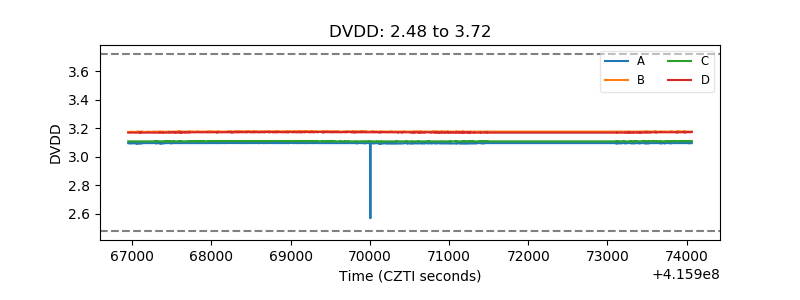 |
| Temperature 1 | 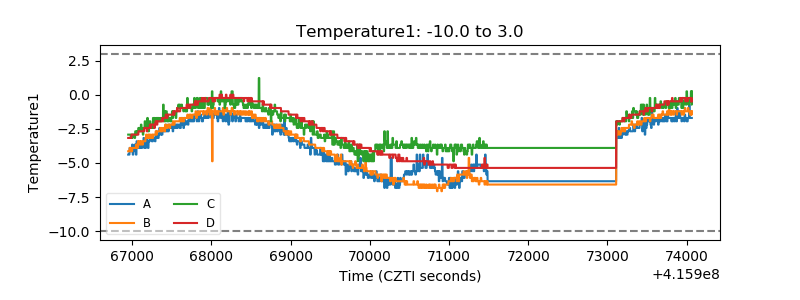 |
| Veto HV Monitor | 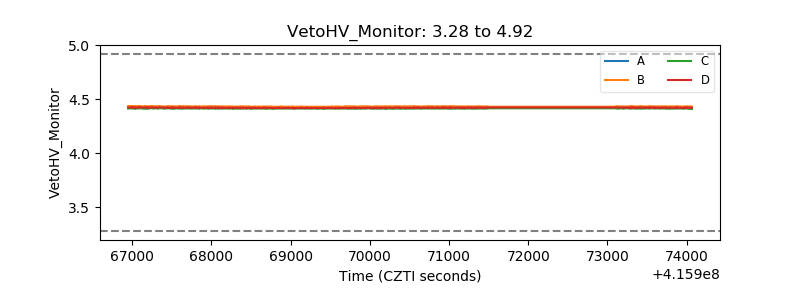 |
| Veto LLD | 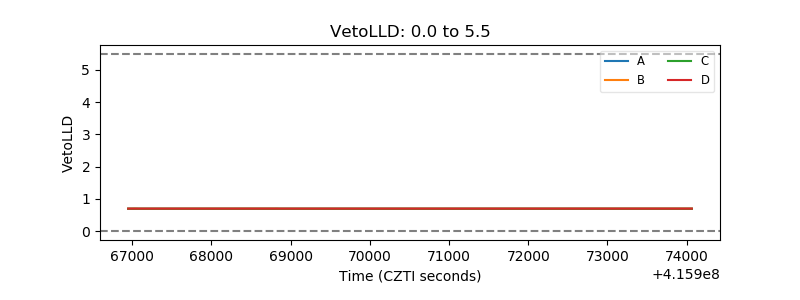 |
| Alpha Counter | 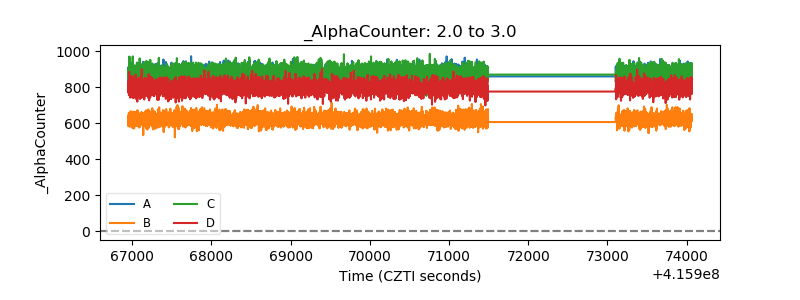 |
| _CPM_Rate | 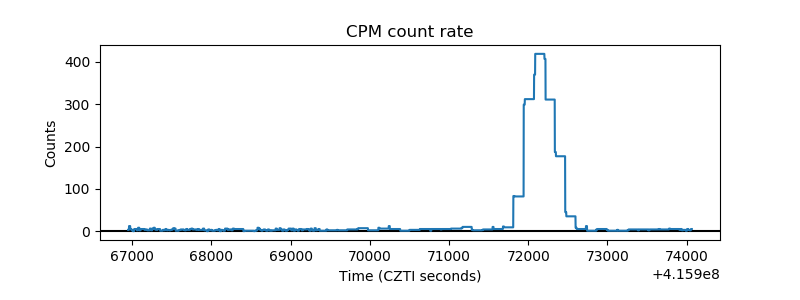 |
| CZT Counter | 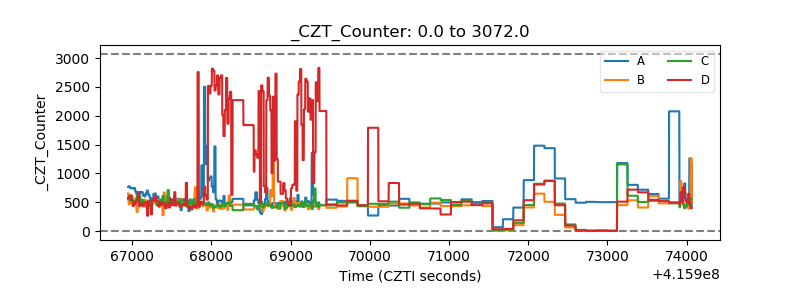 |
| +2.5 Volts monitor | 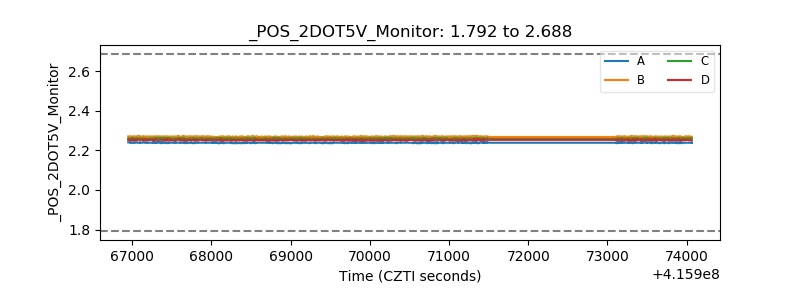 |
| +5 Volts monitor |  |
| _ROLL_ROT | 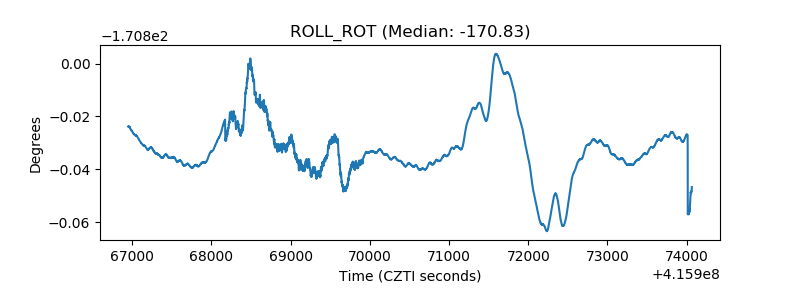 |
| _Roll_DEC | 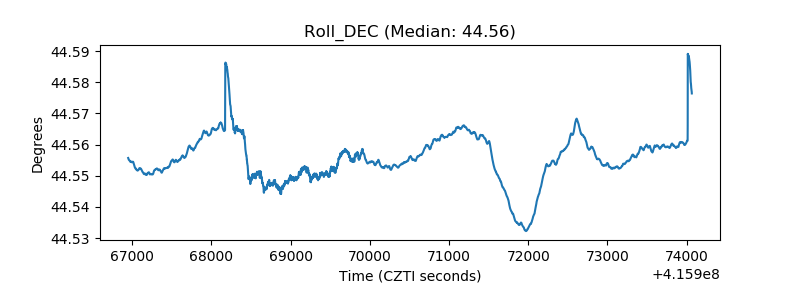 |
| _Roll_RA | 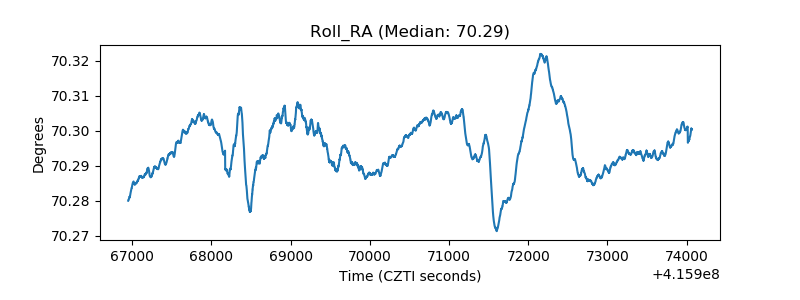 |
| Veto Counter | 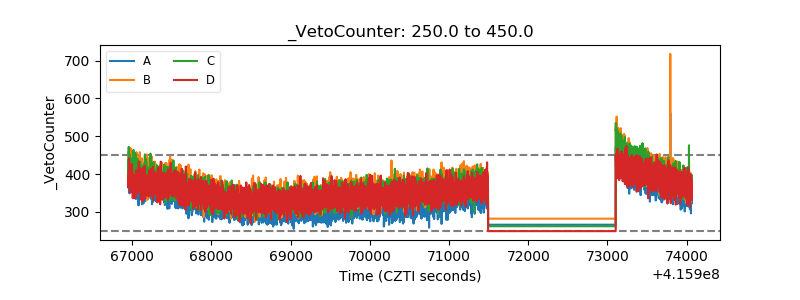 |