| Param | Original file | Final file |
|---|---|---|
| Filename | modeM0/AS1T05_086T01_9000005534_40240cztM0_level2.fits | modeM0/AS1T05_086T01_9000005534_40240cztM0_level2_quad_clean.evt |
| Size (bytes) | 354,839,040 | 97,992,000 |
| Size | 338.4 MB | 93.5 MB |
| Events in quadrant A | 3,678,860 | 654,584 |
| Events in quadrant B | 2,804,124 | 685,520 |
| Events in quadrant C | 2,701,487 | 647,722 |
| Events in quadrant D | 3,517,854 | 590,404 |
| Mode M0 | |||
|---|---|---|---|
| Quadrant | BADHDUFLAG | Total packets | Discarded packets |
| A | 0 | 14411 | 3 |
| B | 0 | 11926 | 2 |
| C | 0 | 11420 | 2 |
| D | 0 | 14088 | 2 |
| Mode M9 | |||
|---|---|---|---|
| Quadrant | BADHDUFLAG | Total packets | Discarded packets |
| A | 0 | 17 | 0 |
| B | 0 | 17 | 0 |
| C | 0 | 17 | 0 |
| D | 0 | 17 | 0 |
| Mode SS | |||
|---|---|---|---|
| Quadrant | BADHDUFLAG | Total packets | Discarded packets |
| A | 0 | 114 | 0 |
| B | 0 | 114 | 0 |
| C | 0 | 114 | 0 |
| D | 0 | 114 | 0 |
| Quadrant | Total seconds | Saturated seconds | Saturation percentage |
|---|---|---|---|
| A | 5558 | 191 | 3.436488% |
| B | 5558 | 36 | 0.647715% |
| C | 5558 | 9 | 0.161929% |
| D | 5559 | 96 | 1.726929% |
Noise dominated data is calculated using 1-second bins in cleaned event files. If a bin has >2000 counts, and if more than 50% of those come from <1% of pixels, then it is considered to be noise-dominated and hence unusable.
| Quadrant | # 1 sec bins | Bins with >0 counts | Bins with >2000 counts | High rate bins dominated by noise | Noise dominated (total time) | Noise dominated (detector-on time) | Marked lightcurve |
|---|---|---|---|---|---|---|---|
| A | 7292 | 5559 | 121 | 121 | 1.66% | 2.18% | 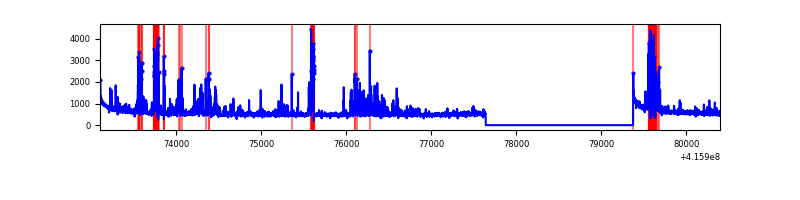 |
| B | 7292 | 5559 | 21 | 21 | 0.29% | 0.38% | 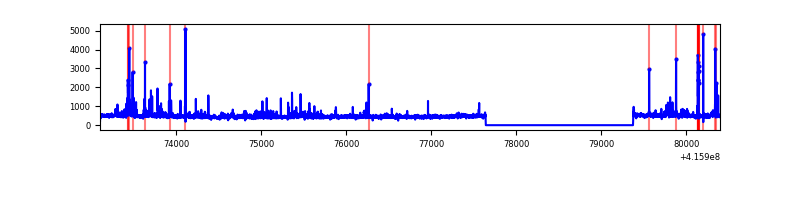 |
| C | 7292 | 5559 | 4 | 4 | 0.05% | 0.07% | 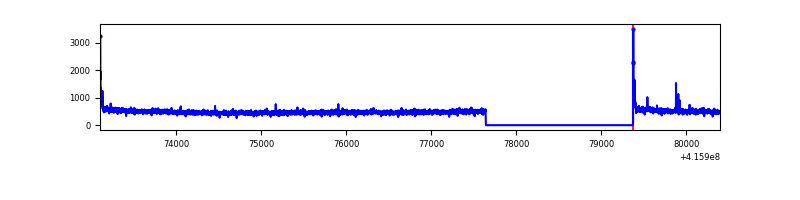 |
| D | 7293 | 5560 | 83 | 83 | 1.14% | 1.49% | 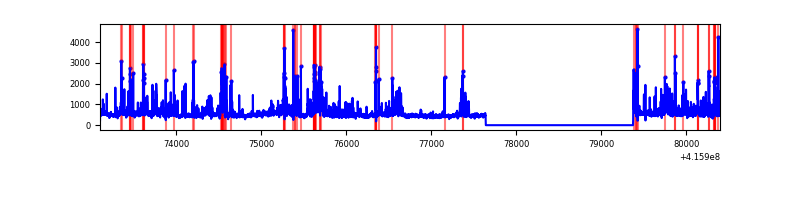 |
Top three noisy pixels from each quadrant. If the there are fewer than three noisy pixels in the level2.evt file, extra rows are filled as -1
| Pixel properties | Quadrant properties | ||||||
|---|---|---|---|---|---|---|---|
| Quadrant | DetID | PixID | Counts | Sigma | Mean | Median | Sigma |
| A | 13 | 248 | 621741 | 4913.53 | 618 | 607 | 126.4 |
| A | 10 | 83 | 516447 | 4080.59 | 618 | 607 | 126.4 |
| A | 2 | 79 | 117217 | 922.45 | 618 | 607 | 126.4 |
| B | 4 | 171 | 126405 | 1034.78 | 625 | 608 | 121.6 |
| B | 5 | 255 | 51028 | 414.75 | 625 | 608 | 121.6 |
| B | 0 | 245 | 49017 | 398.2 | 625 | 608 | 121.6 |
| C | 15 | 214 | 241505 | 1680.64 | 611 | 616 | 143.3 |
| C | 0 | 10 | 41964 | 288.48 | 611 | 616 | 143.3 |
| C | 9 | 187 | 19998 | 135.22 | 611 | 616 | 143.3 |
| D | 12 | 227 | 384473 | 2579.58 | 609 | 594 | 148.8 |
| D | 2 | 249 | 322345 | 2162.09 | 609 | 594 | 148.8 |
| D | 13 | 249 | 153265 | 1025.92 | 609 | 594 | 148.8 |
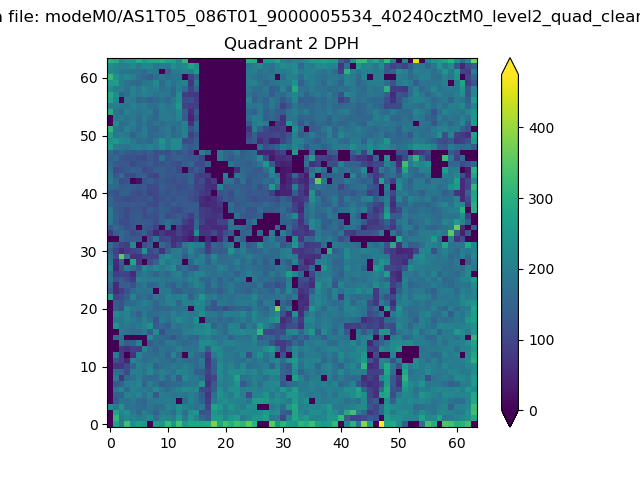
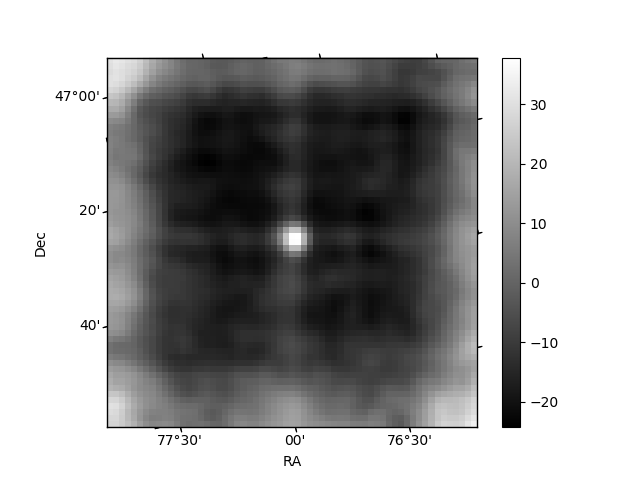
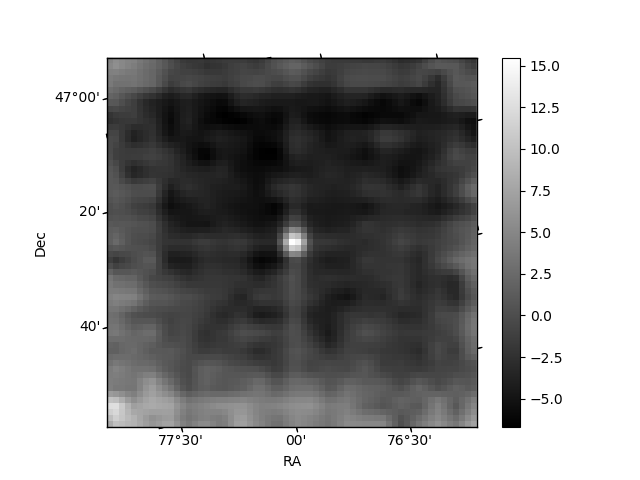
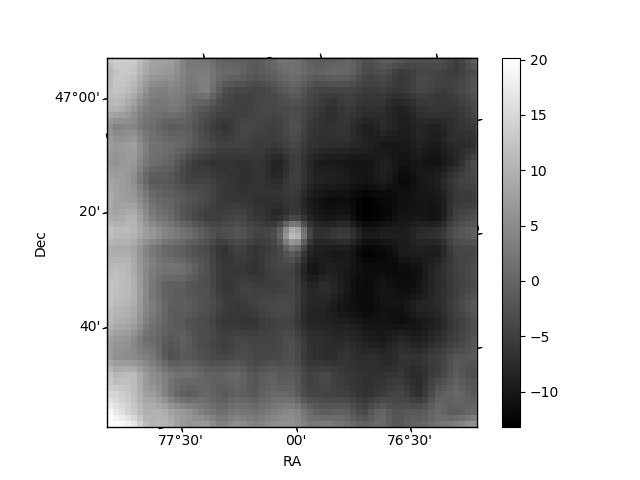
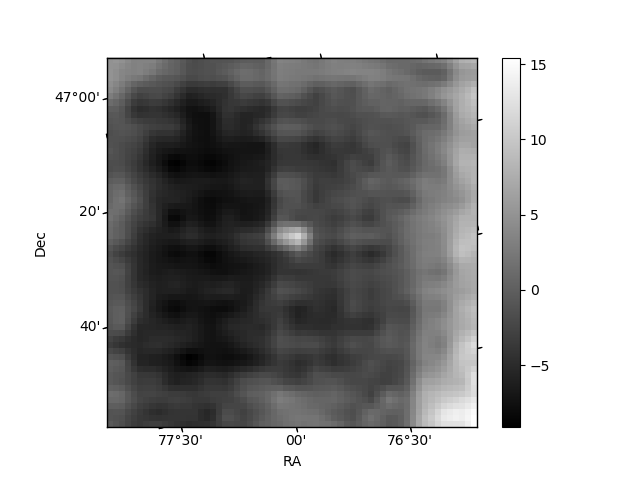
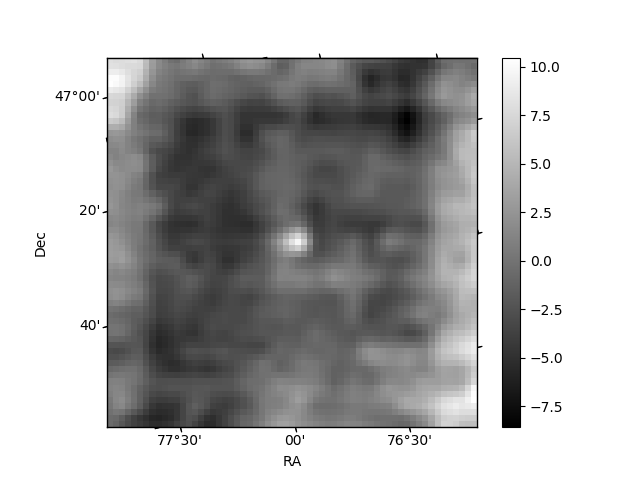
Histogram calculated using DETX and DETY for each event in the final _common_clean file
| Quadrant A | 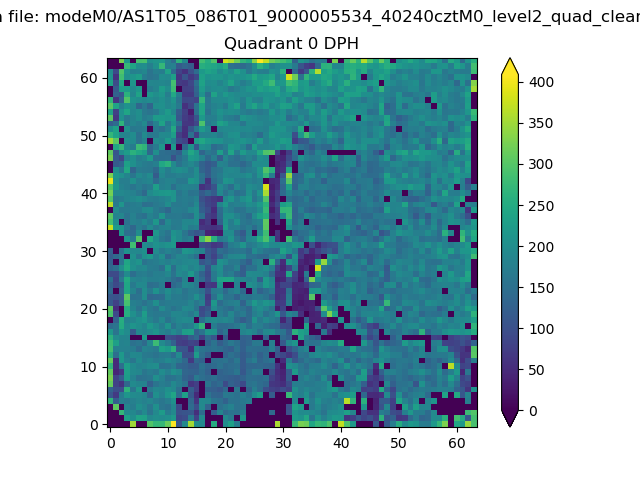 |
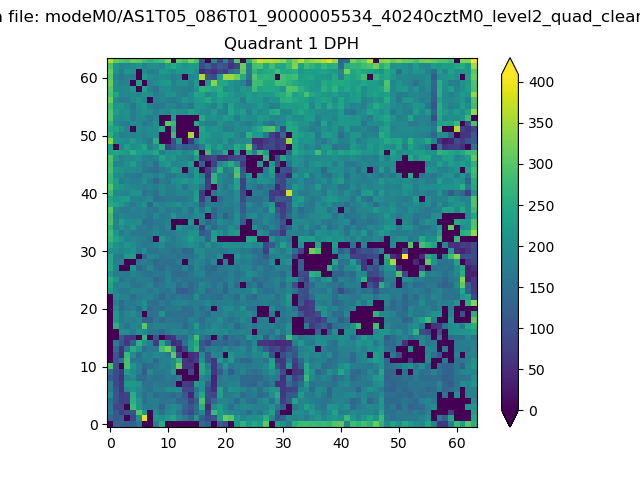 |
Quadrant B |
|---|---|---|---|
| Quadrant D | 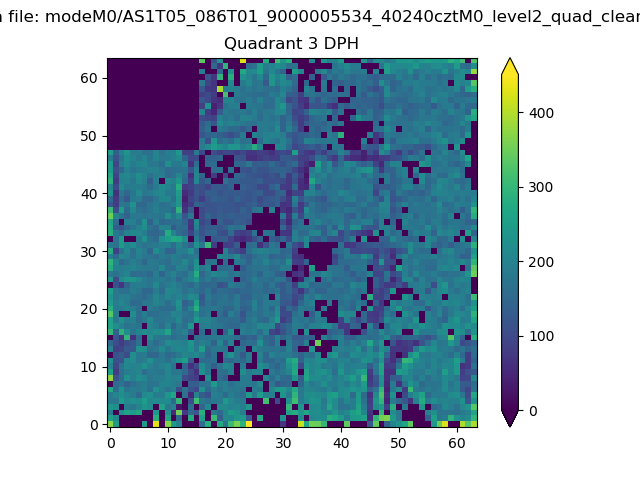 |
 |
Quadrant C |
| Plot type | Count rate plots | Images |
|---|---|---|
| Comparison with Poisson distribution Blue bars denote a histogram of data divided into 1 sec bins. Red curve is a Poisson curve with rate = median count rate of data. |
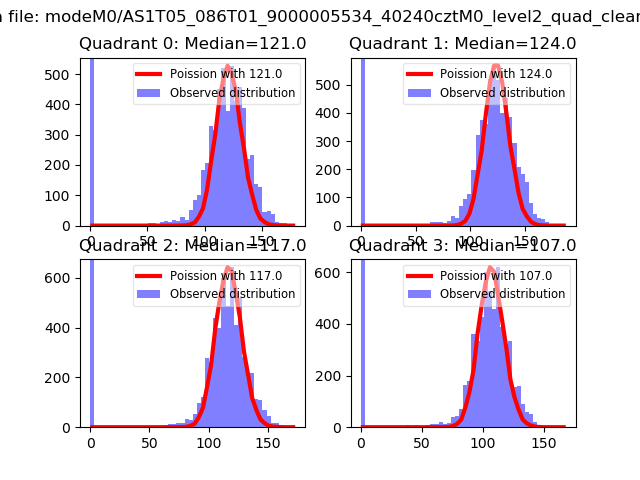 |
 |
| Quadrant-wise count rates Data is divided into 100 sec bins |
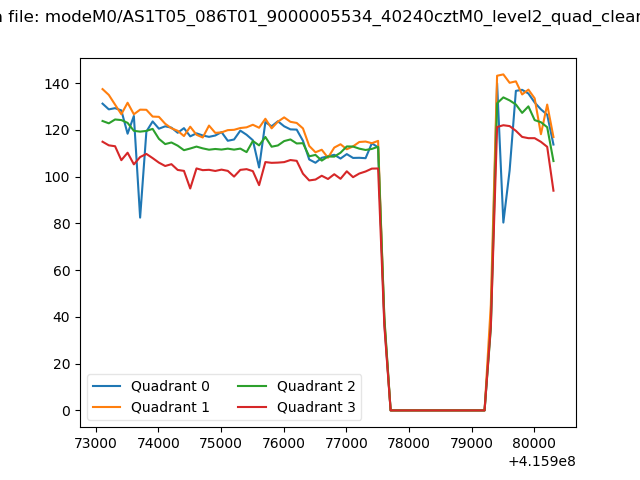 |
|
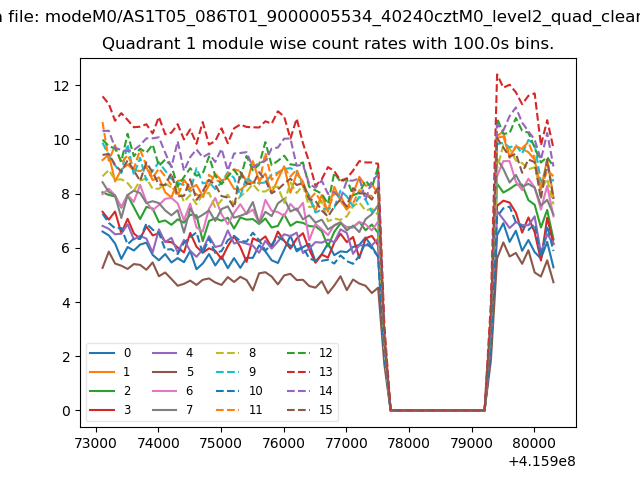
| Module-wise count rates for Quadrant A Data is divided into 100 sec bins |
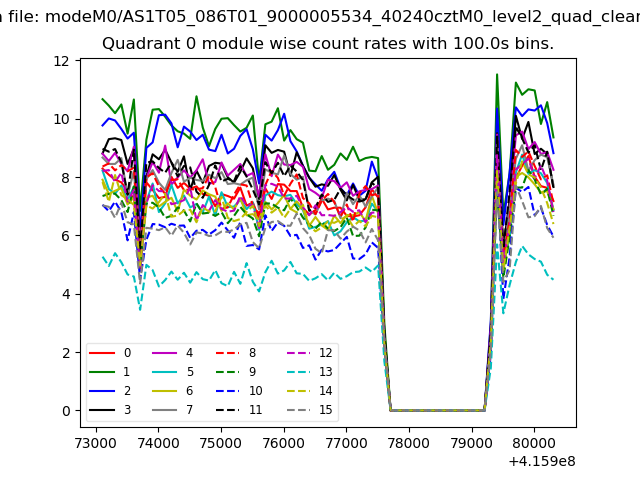 |
 |
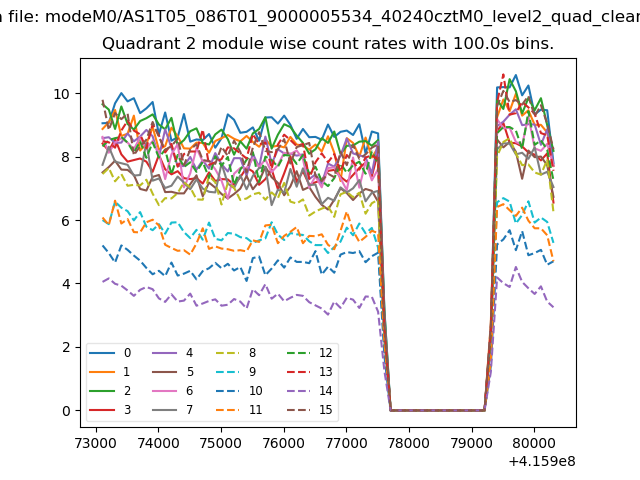
| Module-wise count rates for Quadrant B Data is divided into 100 sec bins |
 |
 |
| Module-wise count rates for Quadrant C Data is divided into 100 sec bins |
 |
 |
| Module-wise count rates for Quadrant D Data is divided into 100 sec bins |
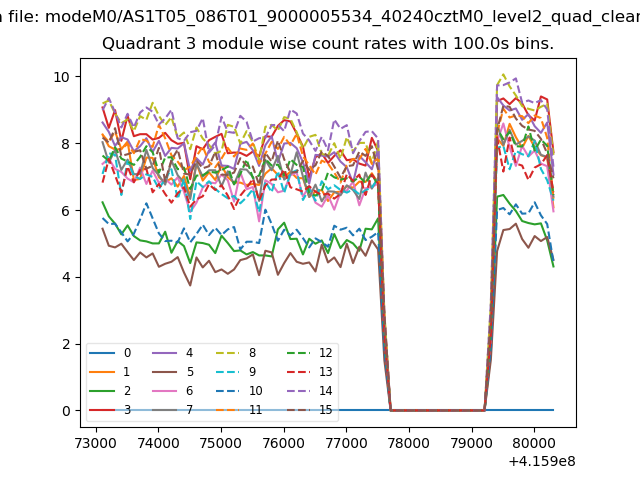 |
 |
| Parameter | Plot |
|---|---|
| CZT HV Monitor | 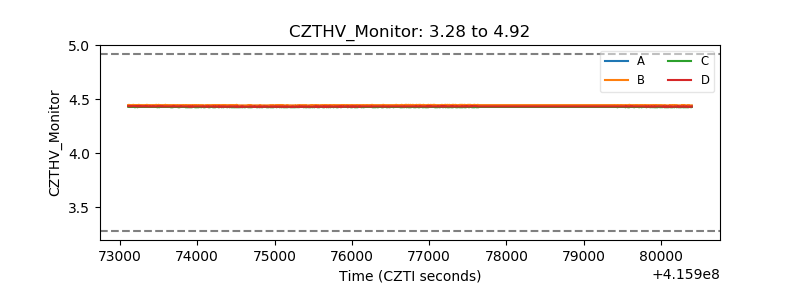 |
| D_VDD | 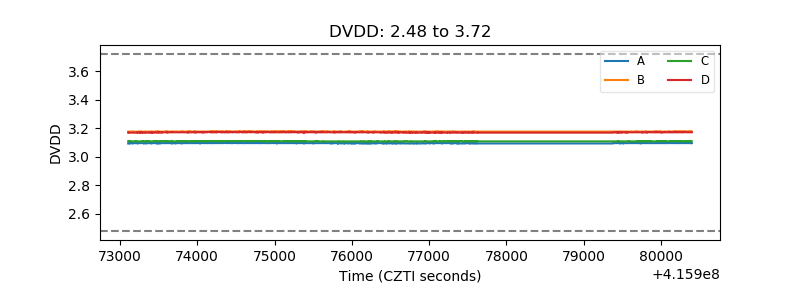 |
| Temperature 1 | 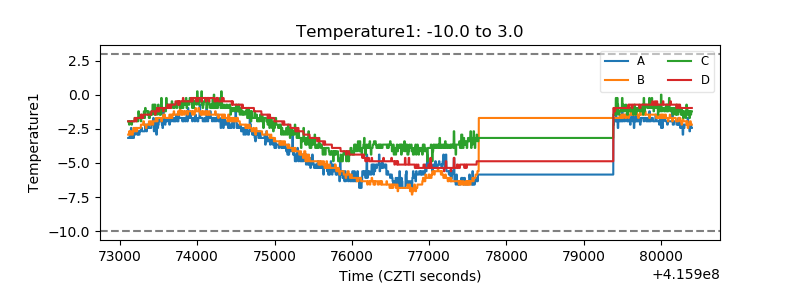 |
| Veto HV Monitor | 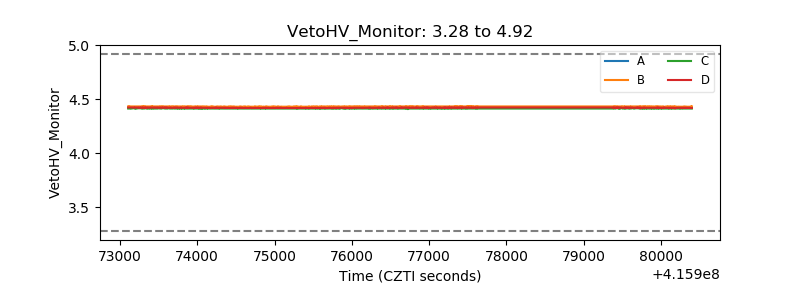 |
| Veto LLD | 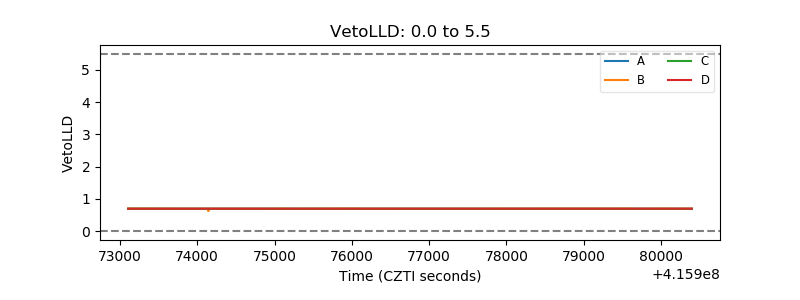 |
| Alpha Counter | 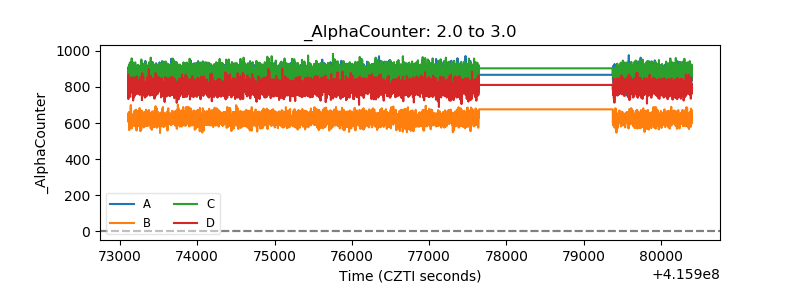 |
| _CPM_Rate | 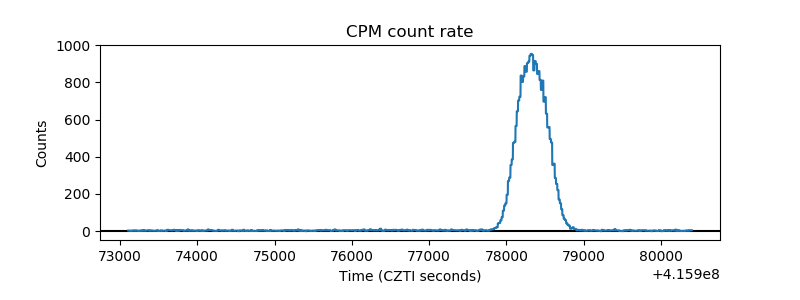 |
| CZT Counter | 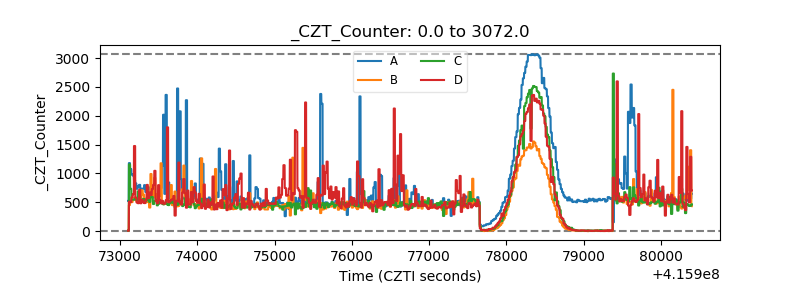 |
| +2.5 Volts monitor | 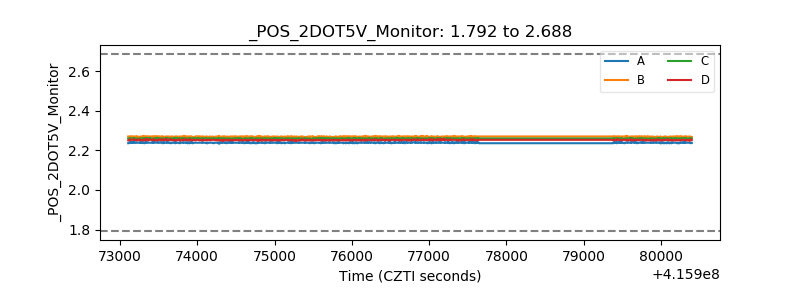 |
| +5 Volts monitor |  |
| _ROLL_ROT | 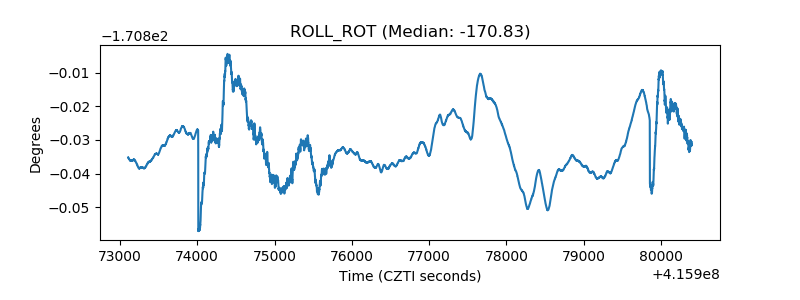 |
| _Roll_DEC | 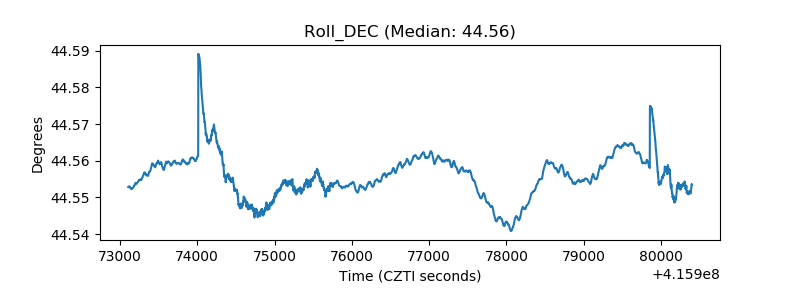 |
| _Roll_RA | 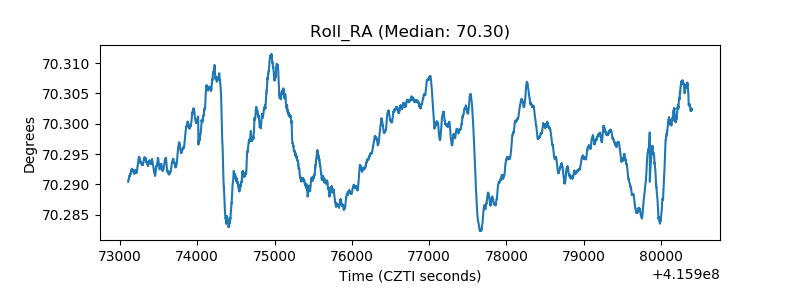 |
| Veto Counter | 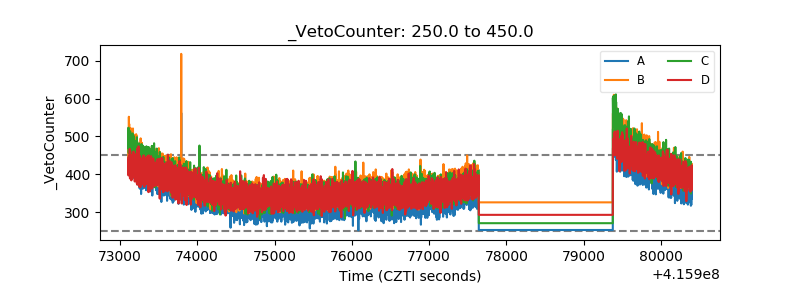 |