| Param | Original file | Final file |
|---|---|---|
| Filename | modeM0/AS1T05_086T01_9000005534_40241cztM0_level2.fits | modeM0/AS1T05_086T01_9000005534_40241cztM0_level2_quad_clean.evt |
| Size (bytes) | 348,750,720 | 96,292,800 |
| Size | 332.6 MB | 91.8 MB |
| Events in quadrant A | 3,543,919 | 645,525 |
| Events in quadrant B | 2,605,526 | 678,653 |
| Events in quadrant C | 2,639,226 | 639,024 |
| Events in quadrant D | 3,707,027 | 580,508 |
| Mode M0 | |||
|---|---|---|---|
| Quadrant | BADHDUFLAG | Total packets | Discarded packets |
| A | 0 | 13838 | 3 |
| B | 0 | 11137 | 2 |
| C | 0 | 11019 | 2 |
| D | 0 | 14656 | 2 |
| Mode M9 | |||
|---|---|---|---|
| Quadrant | BADHDUFLAG | Total packets | Discarded packets |
| A | 0 | 19 | 0 |
| B | 0 | 19 | 0 |
| C | 0 | 19 | 0 |
| D | 0 | 20 | 0 |
| Mode SS | |||
|---|---|---|---|
| Quadrant | BADHDUFLAG | Total packets | Discarded packets |
| A | 0 | 108 | 0 |
| B | 0 | 108 | 0 |
| C | 0 | 108 | 0 |
| D | 0 | 108 | 0 |
| Quadrant | Total seconds | Saturated seconds | Saturation percentage |
|---|---|---|---|
| A | 5316 | 186 | 3.498871% |
| B | 5316 | 25 | 0.470278% |
| C | 5316 | 17 | 0.319789% |
| D | 5316 | 137 | 2.577126% |
Noise dominated data is calculated using 1-second bins in cleaned event files. If a bin has >2000 counts, and if more than 50% of those come from <1% of pixels, then it is considered to be noise-dominated and hence unusable.
| Quadrant | # 1 sec bins | Bins with >0 counts | Bins with >2000 counts | High rate bins dominated by noise | Noise dominated (total time) | Noise dominated (detector-on time) | Marked lightcurve |
|---|---|---|---|---|---|---|---|
| A | 7200 | 5317 | 131 | 131 | 1.82% | 2.46% | 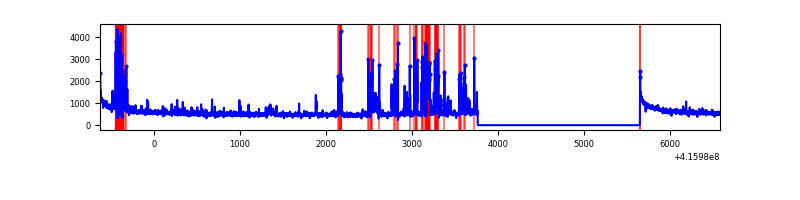 |
| B | 7200 | 5317 | 15 | 15 | 0.21% | 0.28% |  |
| C | 7200 | 5317 | 11 | 11 | 0.15% | 0.21% | 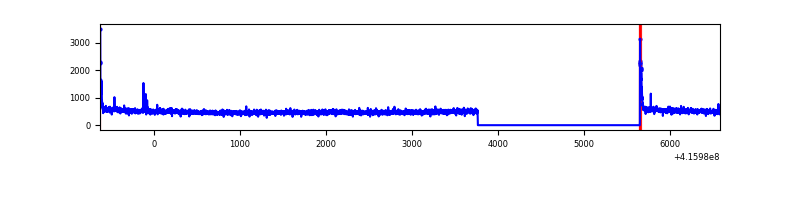 |
| D | 7200 | 5317 | 112 | 112 | 1.56% | 2.11% | 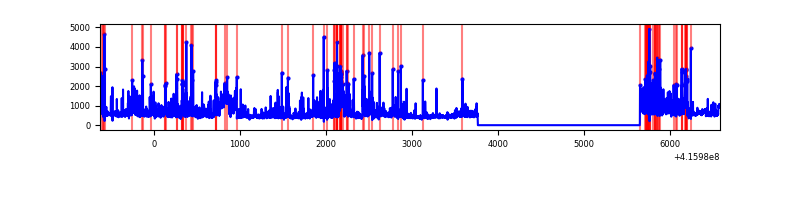 |
Top three noisy pixels from each quadrant. If the there are fewer than three noisy pixels in the level2.evt file, extra rows are filled as -1
| Pixel properties | Quadrant properties | ||||||
|---|---|---|---|---|---|---|---|
| Quadrant | DetID | PixID | Counts | Sigma | Mean | Median | Sigma |
| A | 13 | 248 | 590597 | 4819.89 | 597 | 587 | 122.4 |
| A | 10 | 83 | 502550 | 4100.62 | 597 | 587 | 122.4 |
| A | 2 | 79 | 84087 | 682.12 | 597 | 587 | 122.4 |
| B | 5 | 255 | 45248 | 379.06 | 605 | 589 | 117.8 |
| B | 15 | 85 | 36106 | 301.47 | 605 | 589 | 117.8 |
| B | 0 | 245 | 32493 | 270.8 | 605 | 589 | 117.8 |
| C | 15 | 214 | 227787 | 1641.36 | 596 | 602 | 138.4 |
| C | 0 | 10 | 62151 | 444.68 | 596 | 602 | 138.4 |
| C | 9 | 187 | 14856 | 102.98 | 596 | 602 | 138.4 |
| D | 12 | 227 | 822937 | 5728.9 | 588 | 574 | 143.5 |
| D | 13 | 249 | 254052 | 1765.83 | 588 | 574 | 143.5 |
| D | 9 | 19 | 92901 | 643.19 | 588 | 574 | 143.5 |
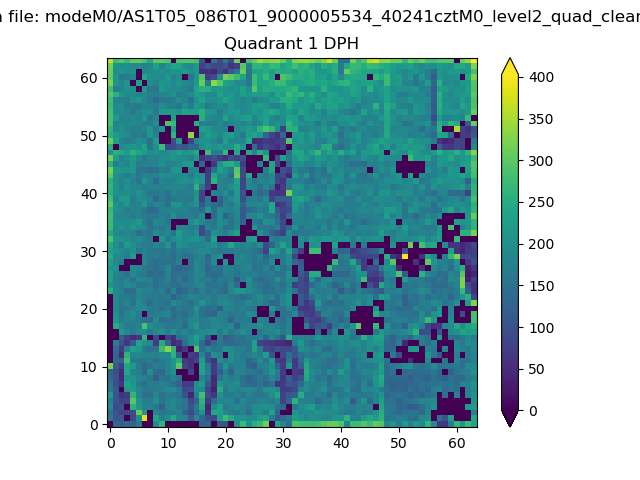
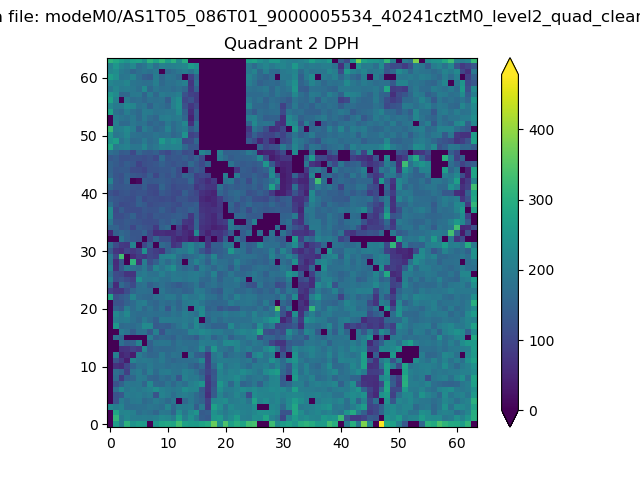
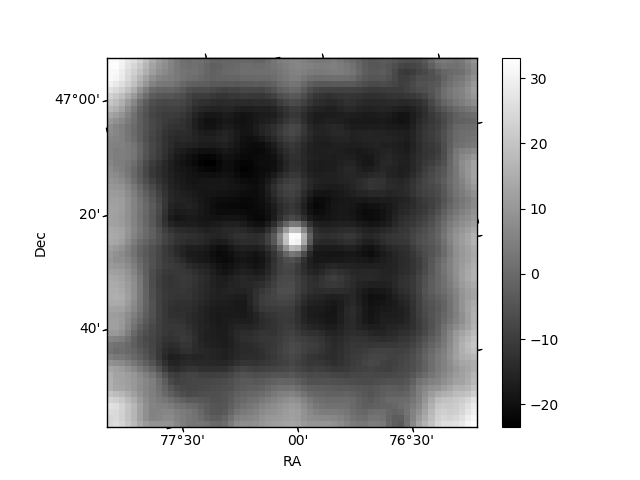
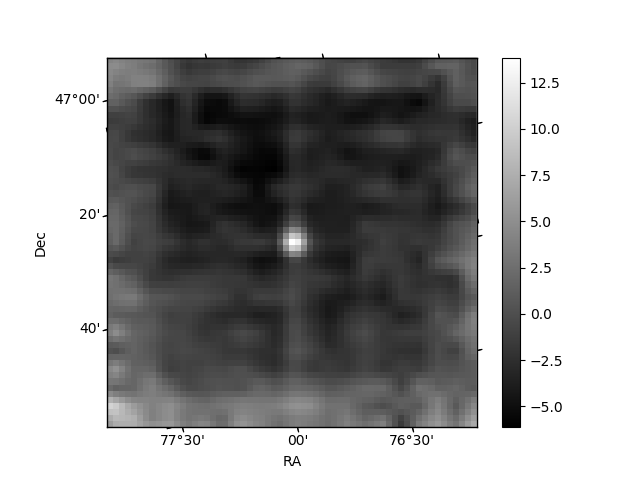
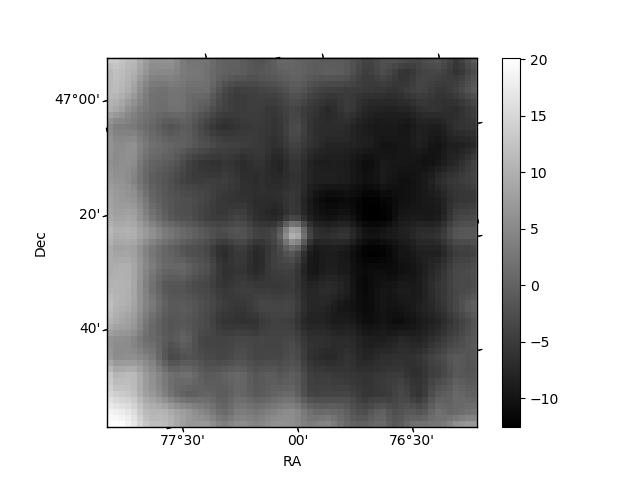
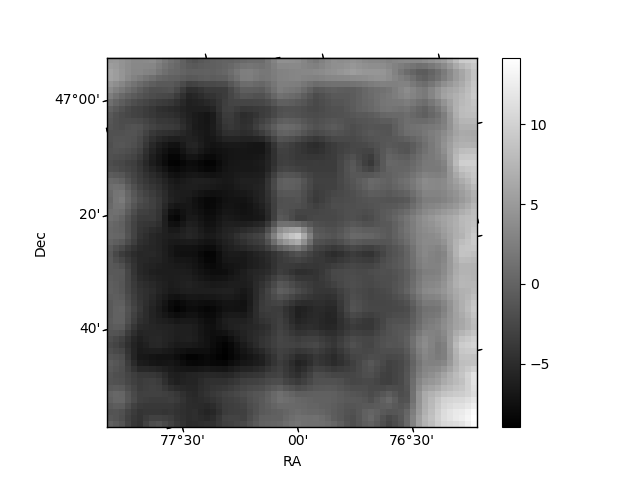
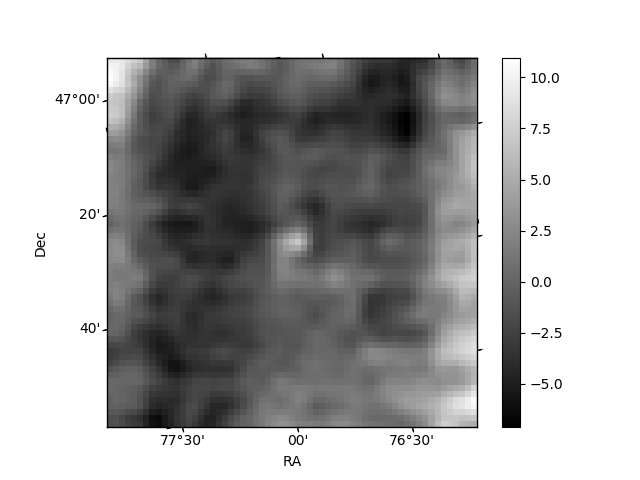
Histogram calculated using DETX and DETY for each event in the final _common_clean file
| Quadrant A | 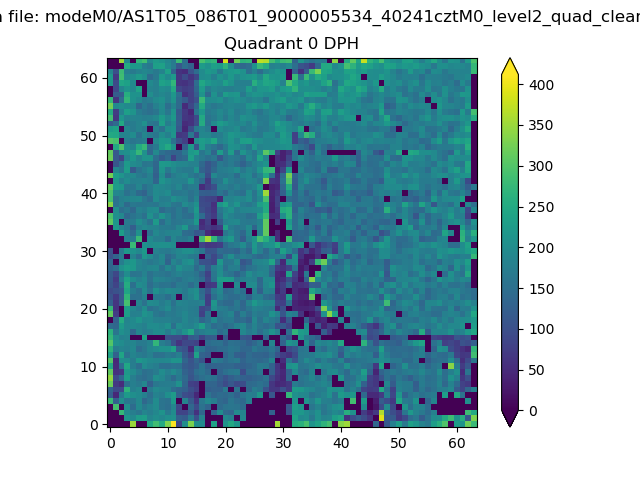 |
 |
Quadrant B |
|---|---|---|---|
| Quadrant D | 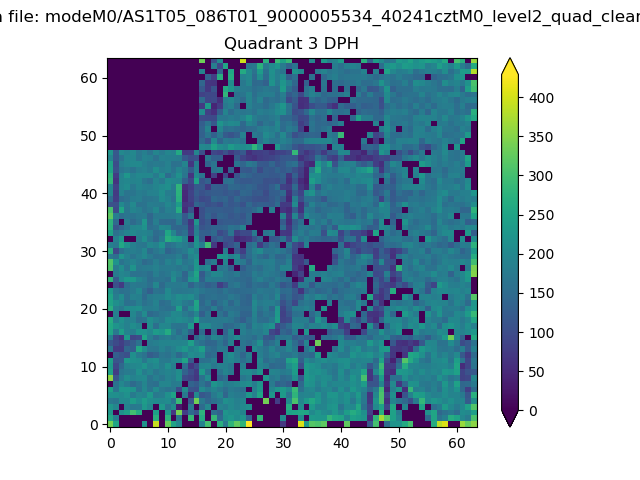 |
 |
Quadrant C |
| Plot type | Count rate plots | Images |
|---|---|---|
| Comparison with Poisson distribution Blue bars denote a histogram of data divided into 1 sec bins. Red curve is a Poisson curve with rate = median count rate of data. |
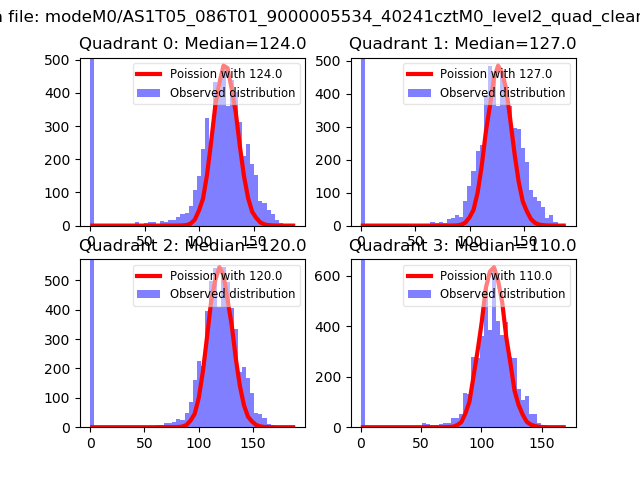 |
 |
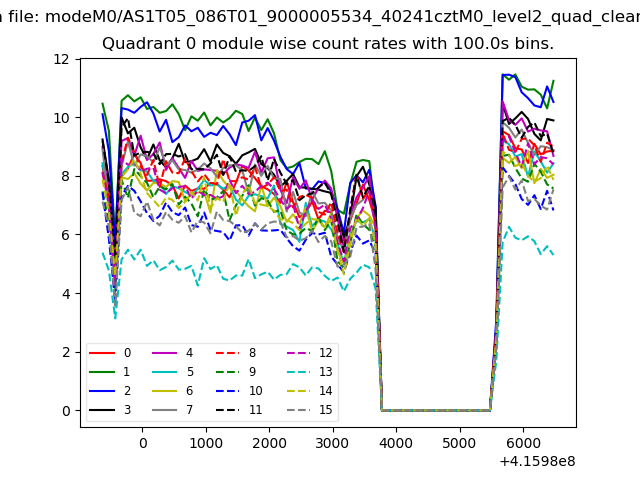
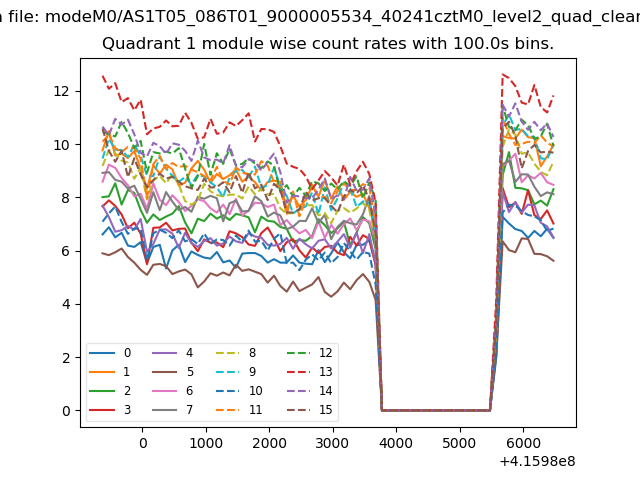
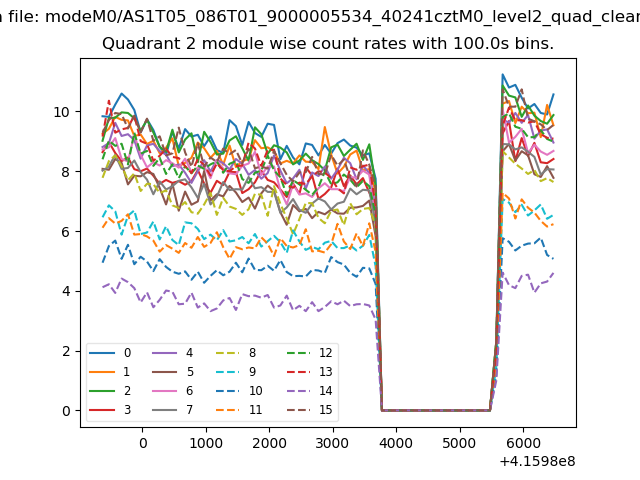
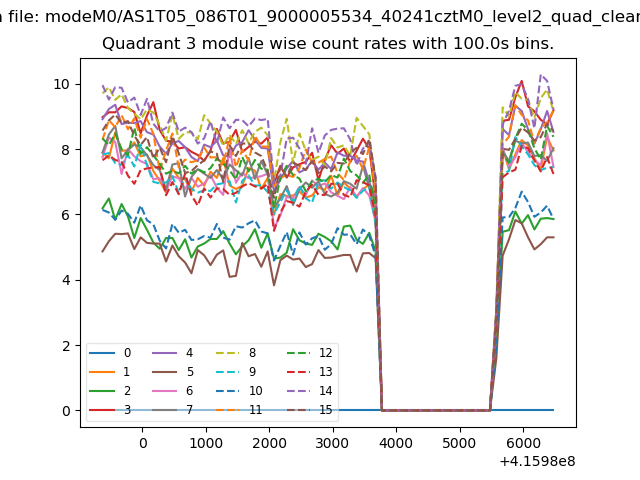
| Quadrant-wise count rates Data is divided into 100 sec bins |
 |
|
| Module-wise count rates for Quadrant A Data is divided into 100 sec bins |
 |
 |
| Module-wise count rates for Quadrant B Data is divided into 100 sec bins |
 |
 |
| Module-wise count rates for Quadrant C Data is divided into 100 sec bins |
 |
 |
| Module-wise count rates for Quadrant D Data is divided into 100 sec bins |
 |
 |
| Parameter | Plot |
|---|---|
| CZT HV Monitor | 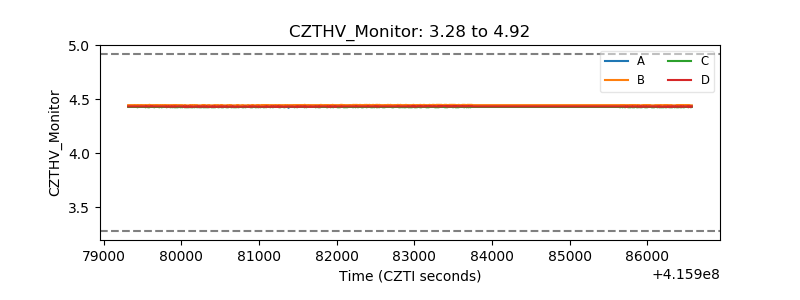 |
| D_VDD |  |
| Temperature 1 | 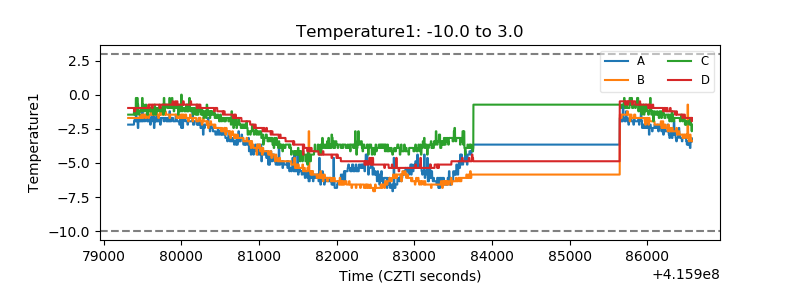 |
| Veto HV Monitor | 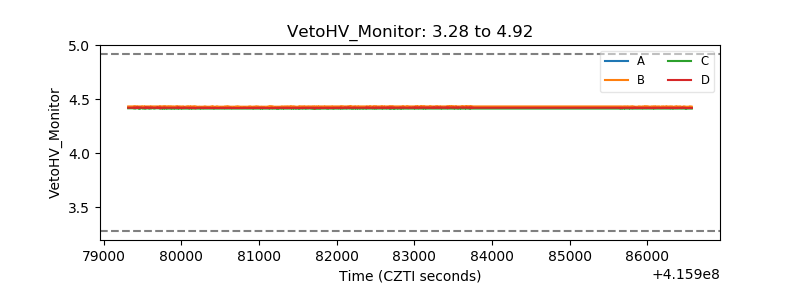 |
| Veto LLD | 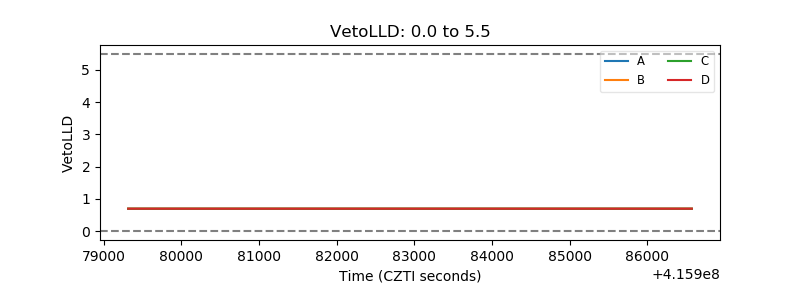 |
| Alpha Counter | 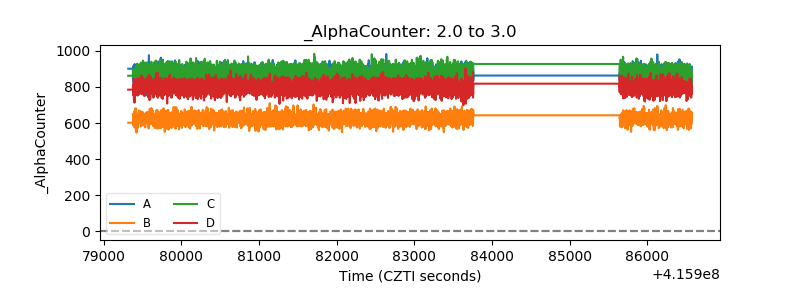 |
| _CPM_Rate | 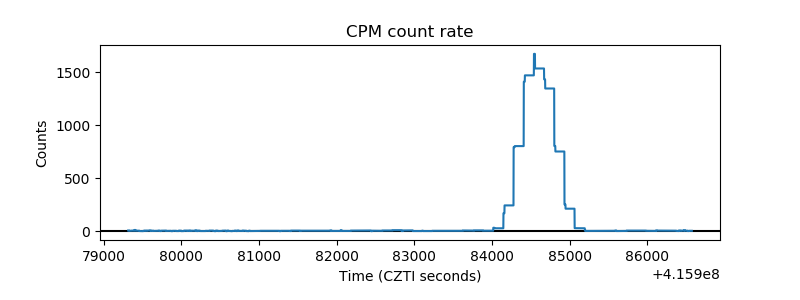 |
| CZT Counter | 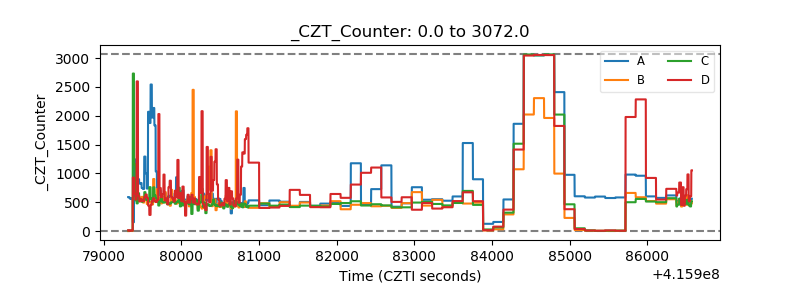 |
| +2.5 Volts monitor |  |
| +5 Volts monitor |  |
| _ROLL_ROT | 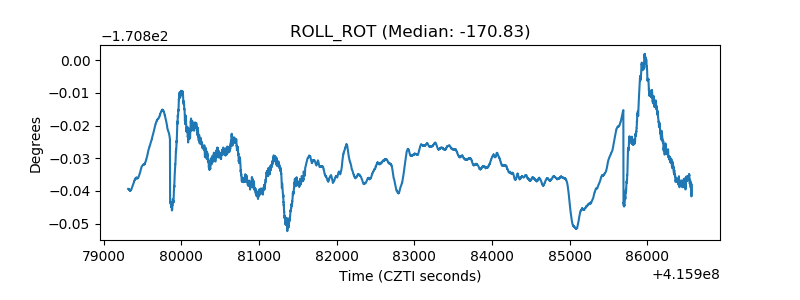 |
| _Roll_DEC | 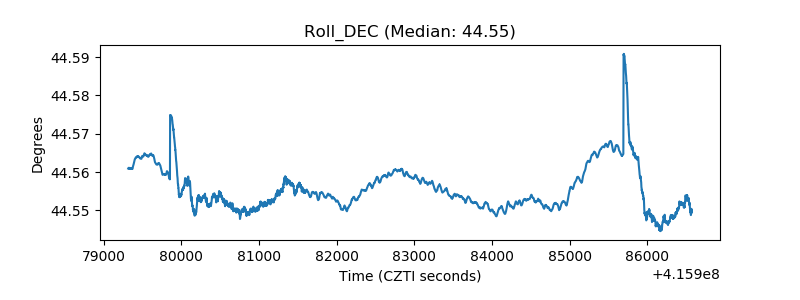 |
| _Roll_RA | 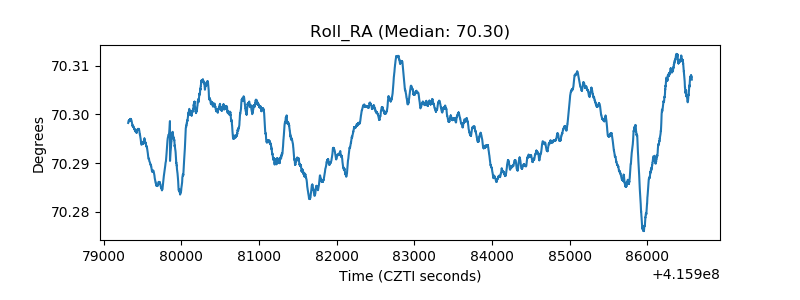 |
| Veto Counter | 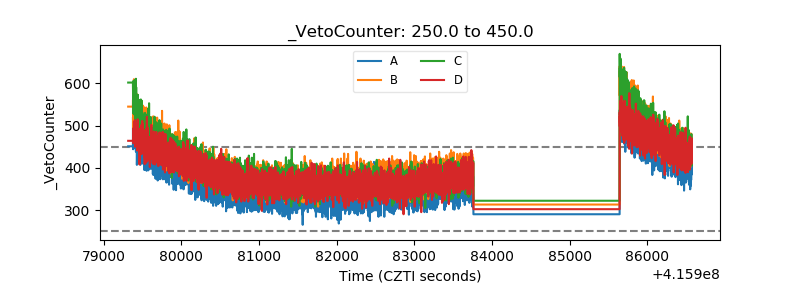 |