| Param | Original file | Final file |
|---|---|---|
| Filename | modeM0/AS1T05_086T01_9000005534_40242cztM0_level2.fits | modeM0/AS1T05_086T01_9000005534_40242cztM0_level2_quad_clean.evt |
| Size (bytes) | 329,359,680 | 96,004,800 |
| Size | 314.1 MB | 91.6 MB |
| Events in quadrant A | 3,314,807 | 650,868 |
| Events in quadrant B | 2,638,938 | 675,538 |
| Events in quadrant C | 2,621,102 | 639,251 |
| Events in quadrant D | 3,217,261 | 582,536 |
| Mode M0 | |||
|---|---|---|---|
| Quadrant | BADHDUFLAG | Total packets | Discarded packets |
| A | 0 | 13011 | 3 |
| B | 0 | 10915 | 2 |
| C | 0 | 10754 | 2 |
| D | 0 | 13011 | 2 |
| Mode M9 | |||
|---|---|---|---|
| Quadrant | BADHDUFLAG | Total packets | Discarded packets |
| A | 0 | 22 | 0 |
| B | 0 | 22 | 0 |
| C | 0 | 22 | 0 |
| D | 0 | 23 | 0 |
| Mode SS | |||
|---|---|---|---|
| Quadrant | BADHDUFLAG | Total packets | Discarded packets |
| A | 0 | 102 | 0 |
| B | 0 | 102 | 0 |
| C | 0 | 102 | 0 |
| D | 0 | 102 | 0 |
| Quadrant | Total seconds | Saturated seconds | Saturation percentage |
|---|---|---|---|
| A | 5133 | 105 | 2.045587% |
| B | 5133 | 12 | 0.233781% |
| C | 5133 | 16 | 0.311709% |
| D | 5133 | 92 | 1.792324% |
Noise dominated data is calculated using 1-second bins in cleaned event files. If a bin has >2000 counts, and if more than 50% of those come from <1% of pixels, then it is considered to be noise-dominated and hence unusable.
| Quadrant | # 1 sec bins | Bins with >0 counts | Bins with >2000 counts | High rate bins dominated by noise | Noise dominated (total time) | Noise dominated (detector-on time) | Marked lightcurve |
|---|---|---|---|---|---|---|---|
| A | 7135 | 5134 | 71 | 71 | 1.00% | 1.38% | 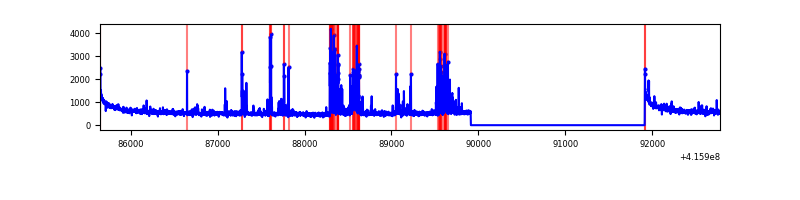 |
| B | 7135 | 5134 | 5 | 5 | 0.07% | 0.10% | 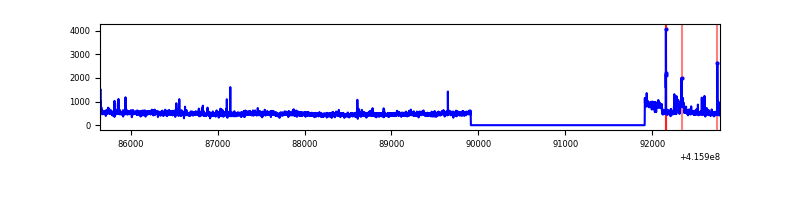 |
| C | 7135 | 5134 | 12 | 12 | 0.17% | 0.23% | 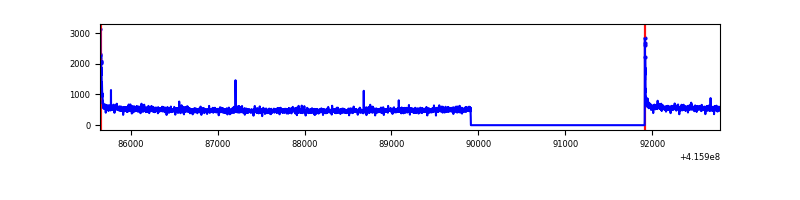 |
| D | 7135 | 5134 | 76 | 76 | 1.07% | 1.48% | 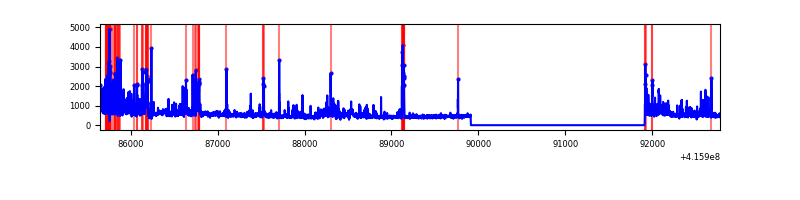 |
Top three noisy pixels from each quadrant. If the there are fewer than three noisy pixels in the level2.evt file, extra rows are filled as -1
| Pixel properties | Quadrant properties | ||||||
|---|---|---|---|---|---|---|---|
| Quadrant | DetID | PixID | Counts | Sigma | Mean | Median | Sigma |
| A | 10 | 83 | 496959 | 4145.28 | 589 | 580 | 119.7 |
| A | 13 | 248 | 388898 | 3242.86 | 589 | 580 | 119.7 |
| A | 2 | 79 | 58174 | 480.97 | 589 | 580 | 119.7 |
| B | 7 | 202 | 193067 | 1678.61 | 595 | 580 | 114.7 |
| B | 5 | 255 | 35920 | 308.19 | 595 | 580 | 114.7 |
| B | 0 | 245 | 23700 | 201.62 | 595 | 580 | 114.7 |
| C | 15 | 214 | 220689 | 1609.76 | 586 | 592 | 136.7 |
| C | 0 | 10 | 56924 | 412.0 | 586 | 592 | 136.7 |
| C | 10 | 22 | 33934 | 243.86 | 586 | 592 | 136.7 |
| D | 12 | 227 | 661173 | 4685.63 | 580 | 566 | 141.0 |
| D | 9 | 19 | 95624 | 674.24 | 580 | 566 | 141.0 |
| D | 12 | 79 | 67270 | 473.13 | 580 | 566 | 141.0 |
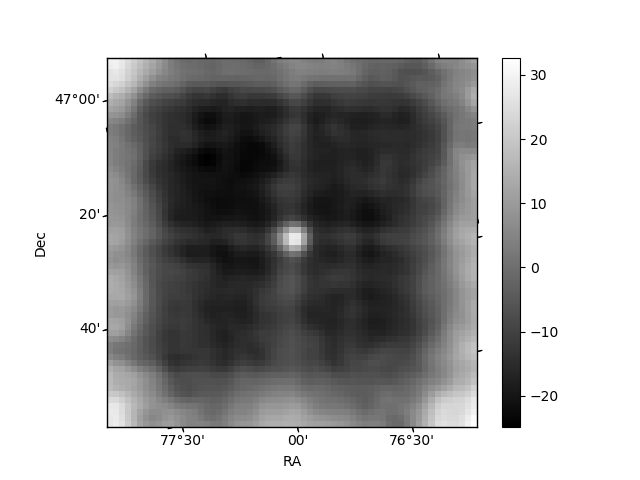
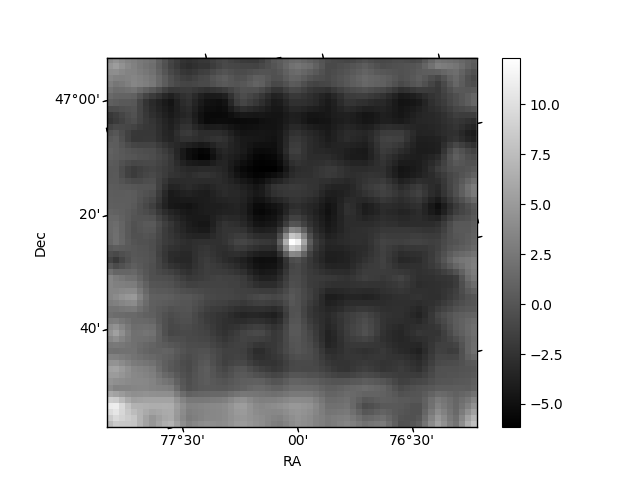
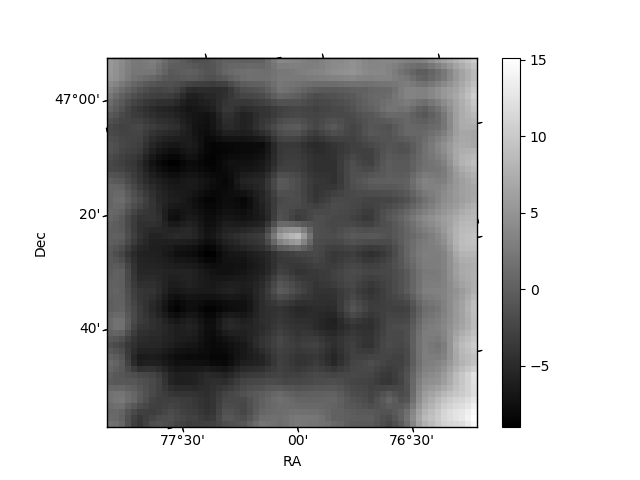
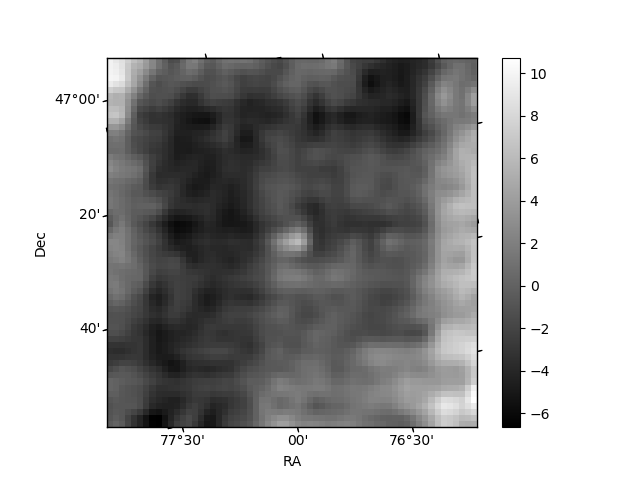
Histogram calculated using DETX and DETY for each event in the final _common_clean file
| Quadrant A | 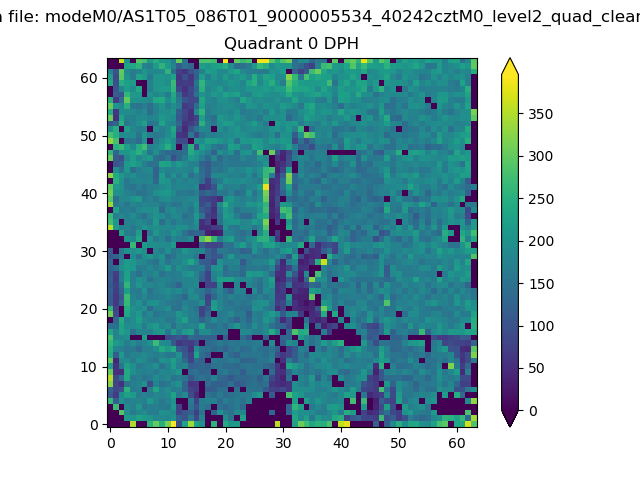 |
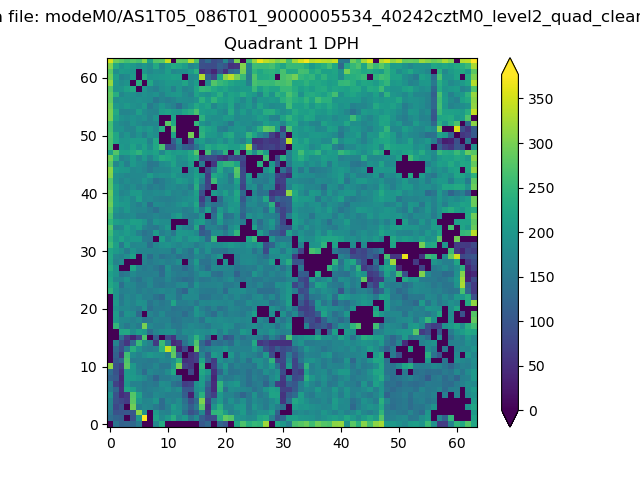 |
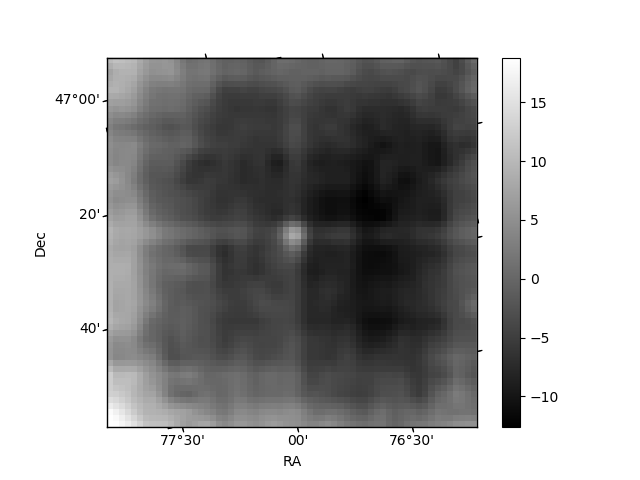
Quadrant B |
|---|---|---|---|
| Quadrant D | 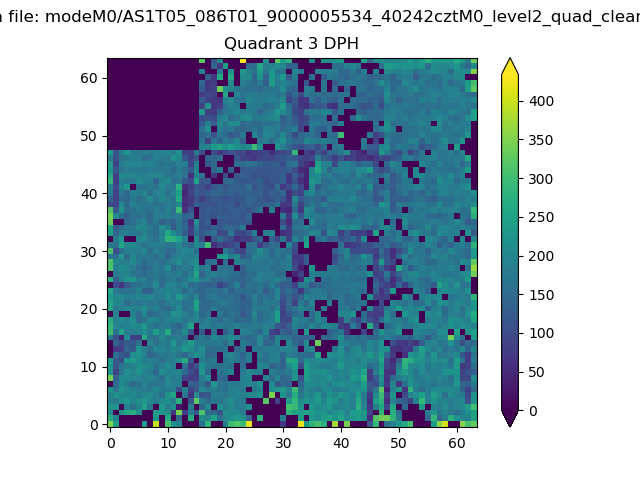 |
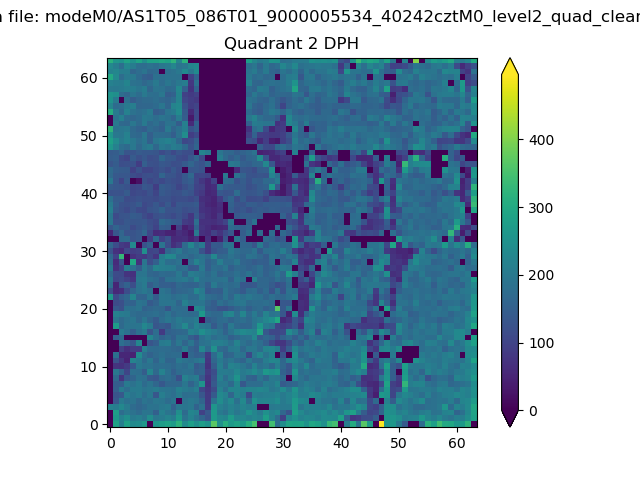 |
Quadrant C |
| Plot type | Count rate plots | Images |
|---|---|---|
| Comparison with Poisson distribution Blue bars denote a histogram of data divided into 1 sec bins. Red curve is a Poisson curve with rate = median count rate of data. |
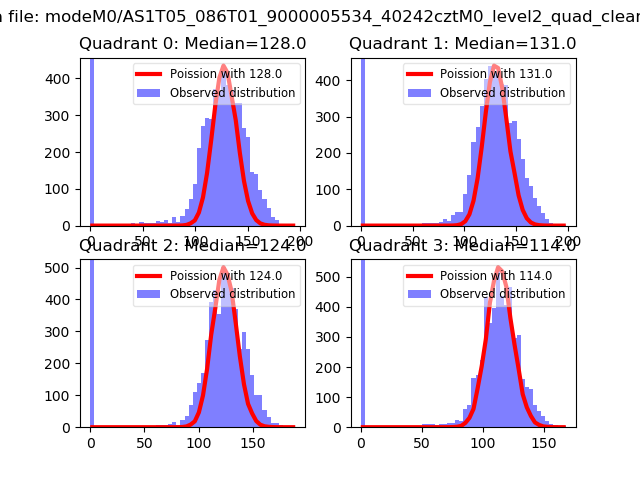 |
 |
| Quadrant-wise count rates Data is divided into 100 sec bins |
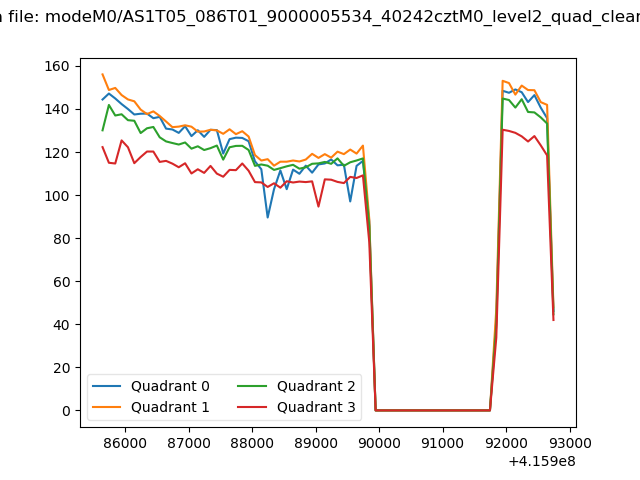 |
|
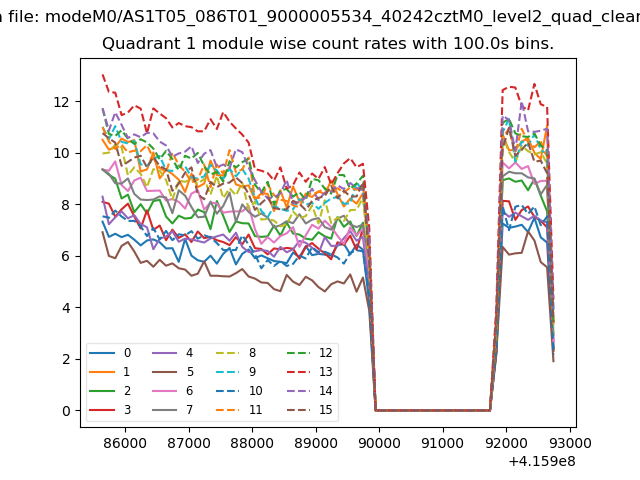
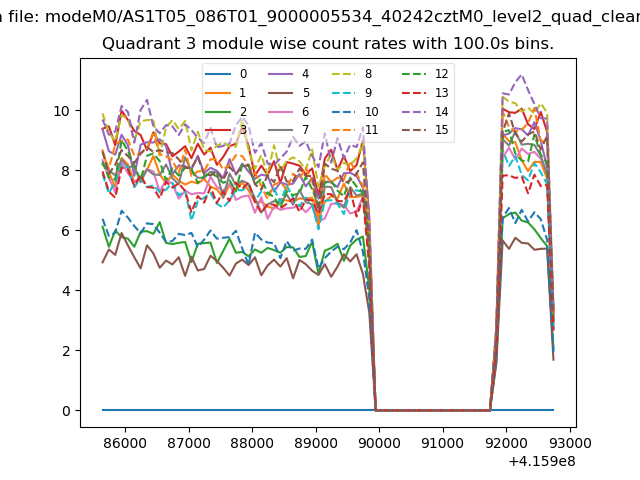
| Module-wise count rates for Quadrant A Data is divided into 100 sec bins |
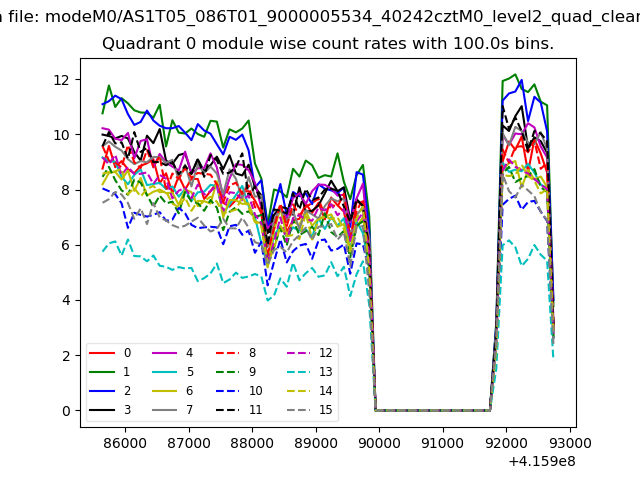 |
 |
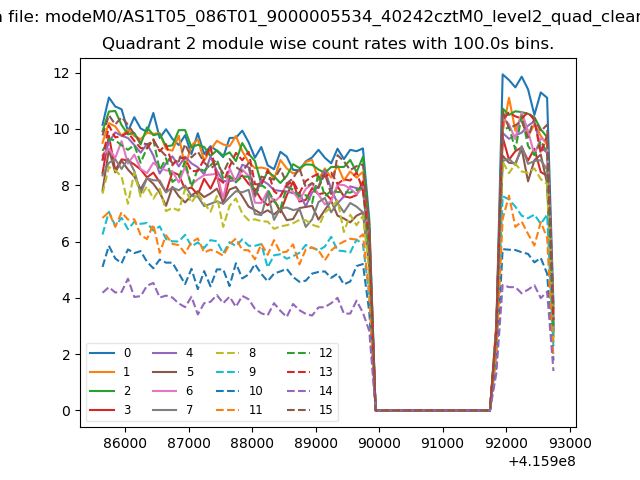
| Module-wise count rates for Quadrant B Data is divided into 100 sec bins |
 |
 |
| Module-wise count rates for Quadrant C Data is divided into 100 sec bins |
 |
 |
| Module-wise count rates for Quadrant D Data is divided into 100 sec bins |
 |
 |
| Parameter | Plot |
|---|---|
| CZT HV Monitor | 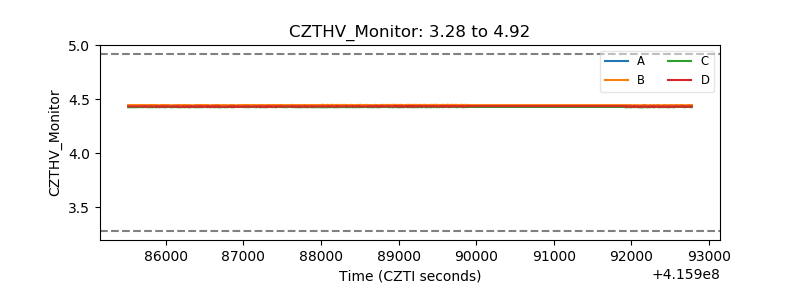 |
| D_VDD | 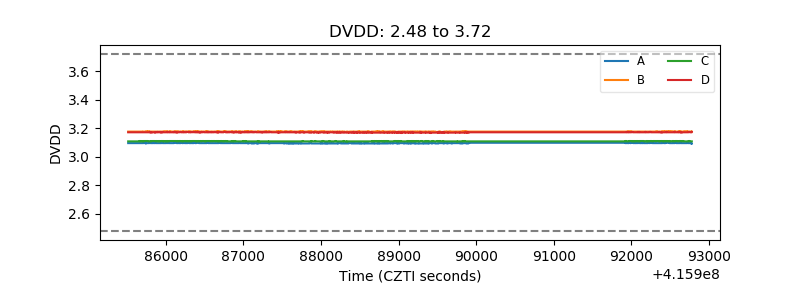 |
| Temperature 1 | 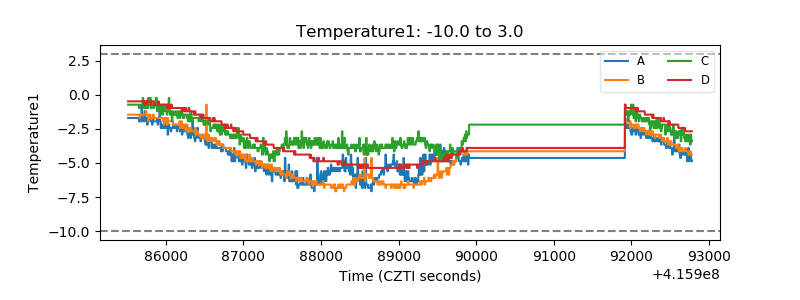 |
| Veto HV Monitor | 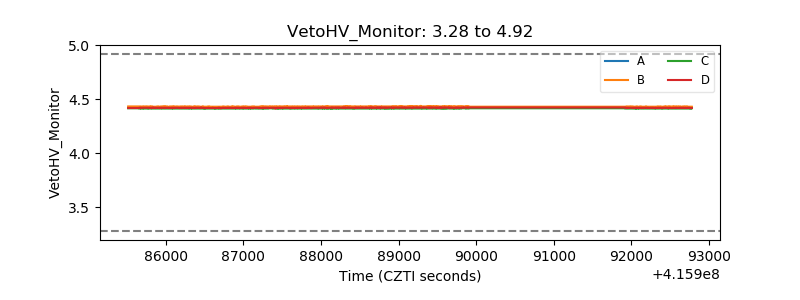 |
| Veto LLD | 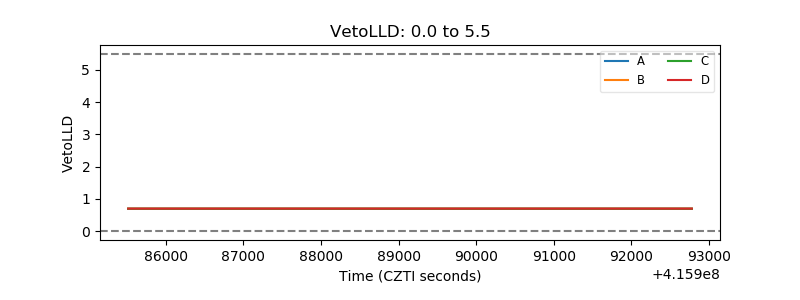 |
| Alpha Counter | 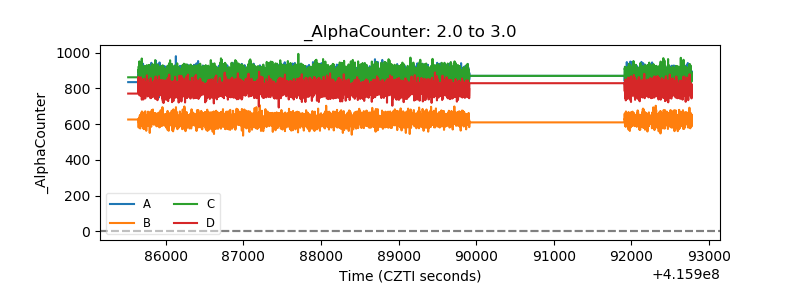 |
| _CPM_Rate | 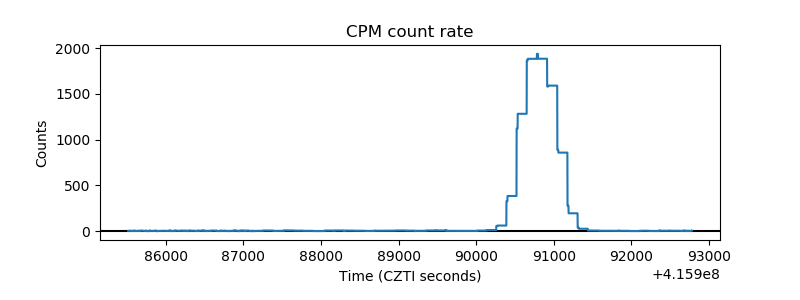 |
| CZT Counter | 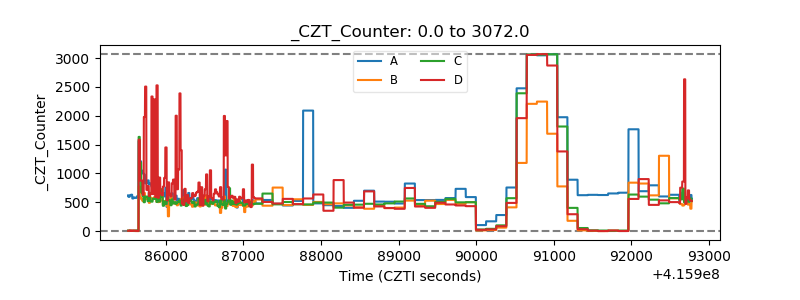 |
| +2.5 Volts monitor | 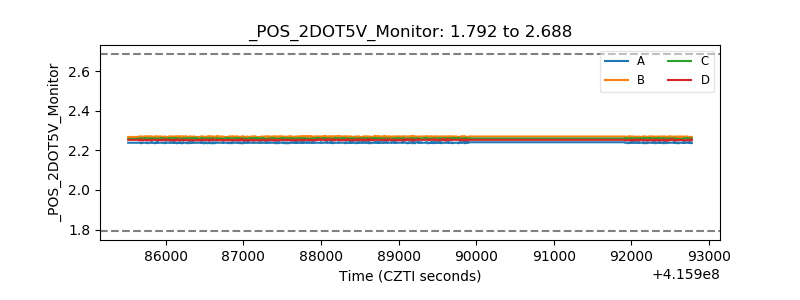 |
| +5 Volts monitor | 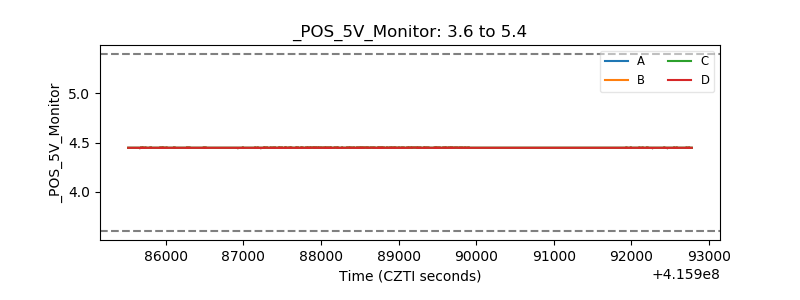 |
| _ROLL_ROT | 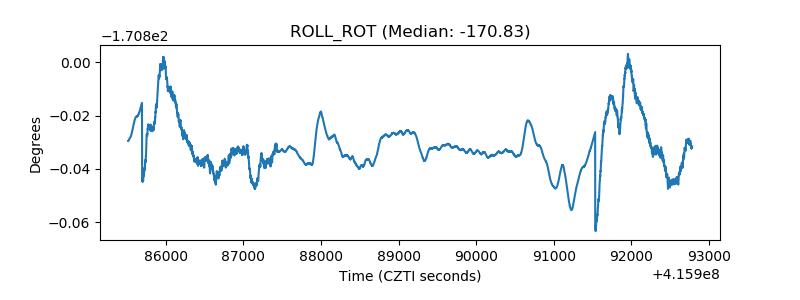 |
| _Roll_DEC | 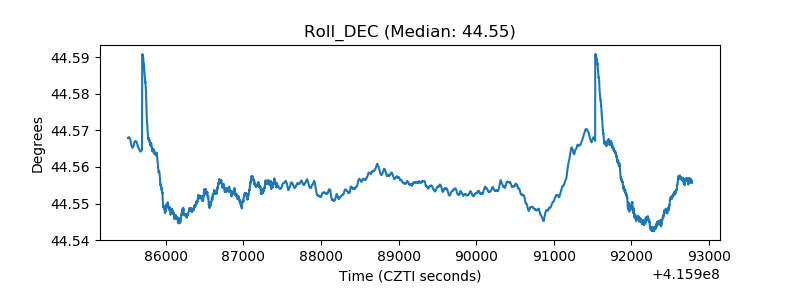 |
| _Roll_RA | 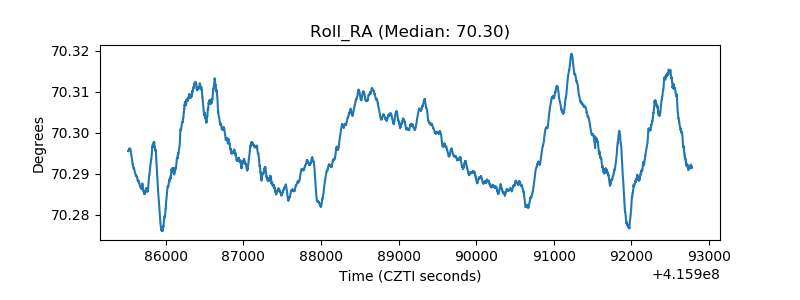 |
| Veto Counter | 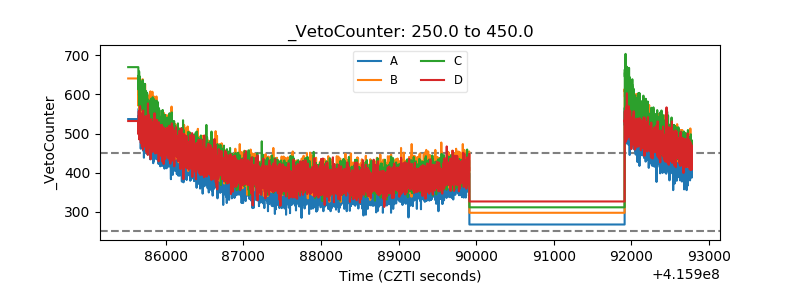 |