| Param | Original file | Final file |
|---|---|---|
| Filename | modeM0/AS1T05_086T01_9000005534_40243cztM0_level2.fits | modeM0/AS1T05_086T01_9000005534_40243cztM0_level2_quad_clean.evt |
| Size (bytes) | 340,488,000 | 92,171,520 |
| Size | 324.7 MB | 87.9 MB |
| Events in quadrant A | 3,378,849 | 617,451 |
| Events in quadrant B | 2,670,976 | 654,719 |
| Events in quadrant C | 2,619,290 | 627,286 |
| Events in quadrant D | 3,548,342 | 544,232 |
| Mode M0 | |||
|---|---|---|---|
| Quadrant | BADHDUFLAG | Total packets | Discarded packets |
| A | 0 | 13151 | 3 |
| B | 0 | 11013 | 2 |
| C | 0 | 10448 | 2 |
| D | 0 | 13836 | 2 |
| Mode M9 | |||
|---|---|---|---|
| Quadrant | BADHDUFLAG | Total packets | Discarded packets |
| A | 0 | 22 | 0 |
| B | 0 | 22 | 0 |
| C | 0 | 22 | 0 |
| D | 0 | 23 | 0 |
| Mode SS | |||
|---|---|---|---|
| Quadrant | BADHDUFLAG | Total packets | Discarded packets |
| A | 0 | 100 | 0 |
| B | 0 | 100 | 0 |
| C | 0 | 100 | 0 |
| D | 0 | 100 | 0 |
| Quadrant | Total seconds | Saturated seconds | Saturation percentage |
|---|---|---|---|
| A | 4961 | 220 | 4.434590% |
| B | 4961 | 52 | 1.048176% |
| C | 4961 | 13 | 0.262044% |
| D | 4961 | 282 | 5.684338% |
Noise dominated data is calculated using 1-second bins in cleaned event files. If a bin has >2000 counts, and if more than 50% of those come from <1% of pixels, then it is considered to be noise-dominated and hence unusable.
| Quadrant | # 1 sec bins | Bins with >0 counts | Bins with >2000 counts | High rate bins dominated by noise | Noise dominated (total time) | Noise dominated (detector-on time) | Marked lightcurve |
|---|---|---|---|---|---|---|---|
| A | 7054 | 4962 | 160 | 160 | 2.27% | 3.22% | 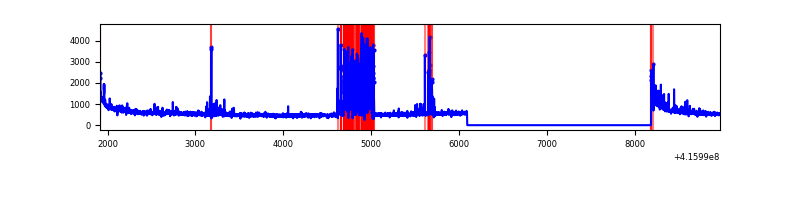 |
| B | 7054 | 4962 | 38 | 38 | 0.54% | 0.77% | 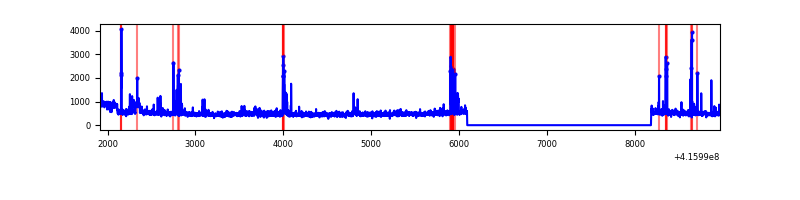 |
| C | 7054 | 4962 | 9 | 9 | 0.13% | 0.18% | 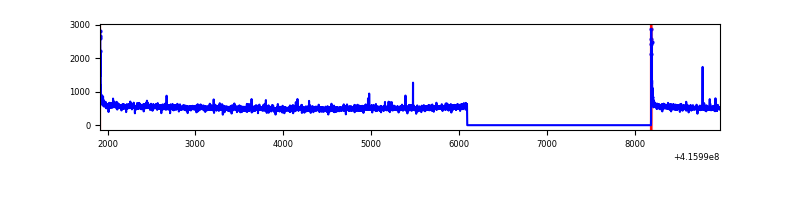 |
| D | 7054 | 4962 | 251 | 251 | 3.56% | 5.06% | 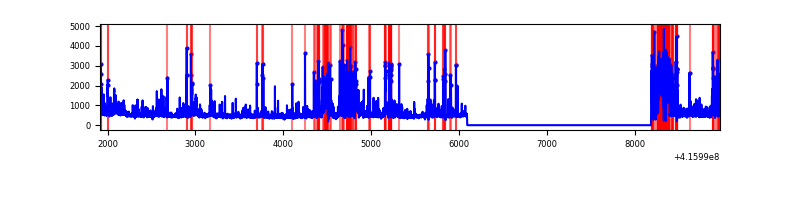 |
Top three noisy pixels from each quadrant. If the there are fewer than three noisy pixels in the level2.evt file, extra rows are filled as -1
| Pixel properties | Quadrant properties | ||||||
|---|---|---|---|---|---|---|---|
| Quadrant | DetID | PixID | Counts | Sigma | Mean | Median | Sigma |
| A | 13 | 248 | 664517 | 5774.51 | 564 | 555 | 115.0 |
| A | 10 | 83 | 474612 | 4122.89 | 564 | 555 | 115.0 |
| A | 2 | 79 | 27150 | 231.3 | 564 | 555 | 115.0 |
| B | 5 | 255 | 124305 | 1130.08 | 577 | 563 | 109.5 |
| B | 7 | 202 | 114249 | 1038.24 | 577 | 563 | 109.5 |
| B | 0 | 245 | 93470 | 848.47 | 577 | 563 | 109.5 |
| C | 15 | 214 | 212652 | 1577.55 | 572 | 578 | 134.4 |
| C | 10 | 22 | 102875 | 760.96 | 572 | 578 | 134.4 |
| C | 0 | 10 | 44744 | 328.54 | 572 | 578 | 134.4 |
| D | 12 | 227 | 981115 | 7257.01 | 550 | 537 | 135.1 |
| D | 9 | 19 | 119852 | 883.02 | 550 | 537 | 135.1 |
| D | 12 | 79 | 114845 | 845.96 | 550 | 537 | 135.1 |
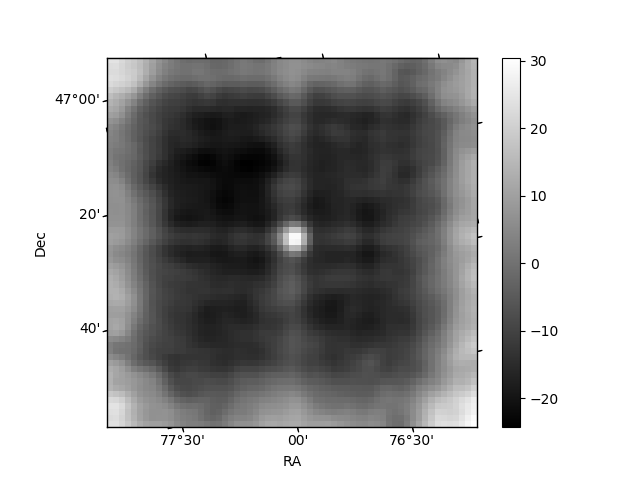
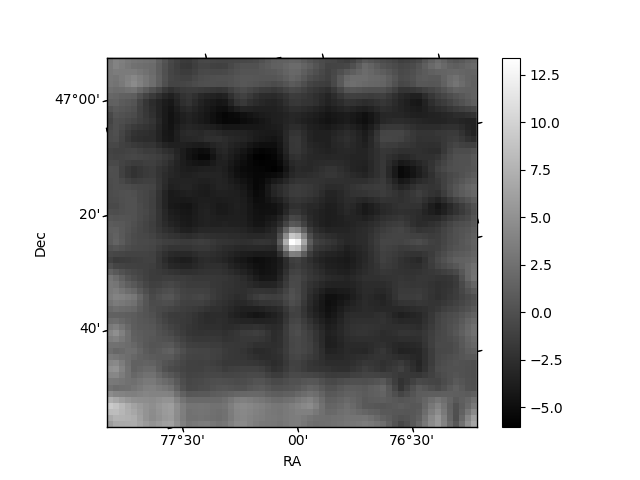
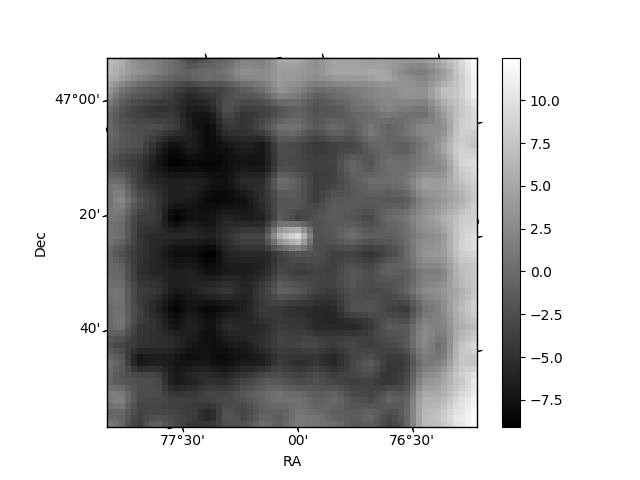
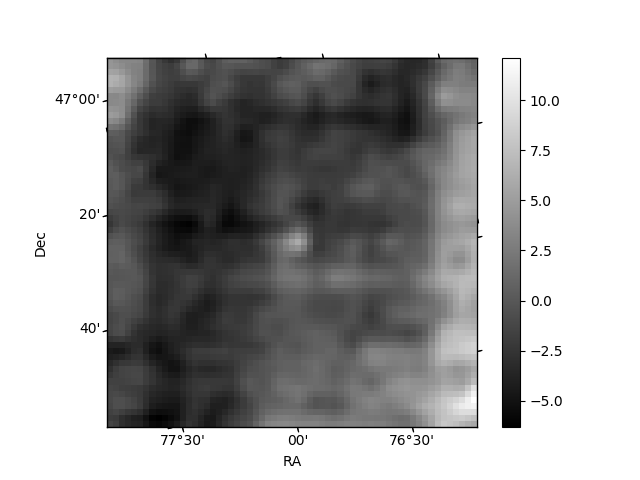
Histogram calculated using DETX and DETY for each event in the final _common_clean file
| Quadrant A | 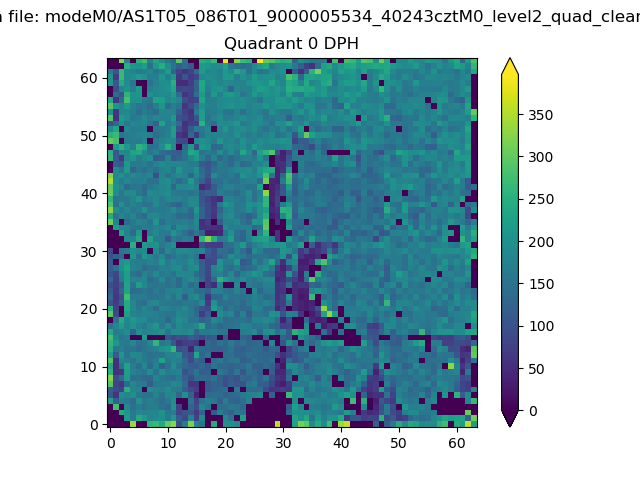 |
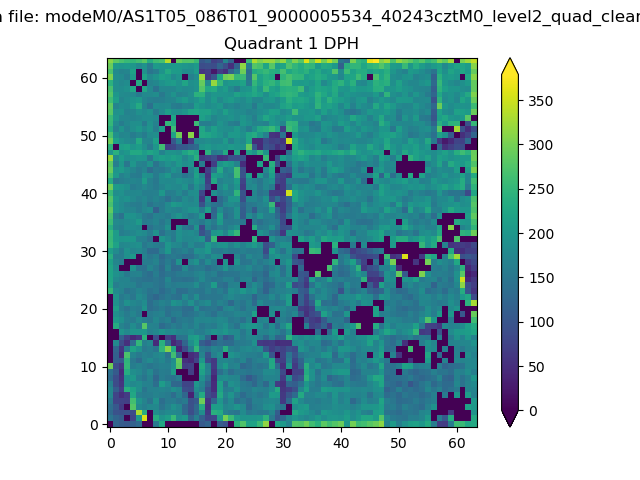 |
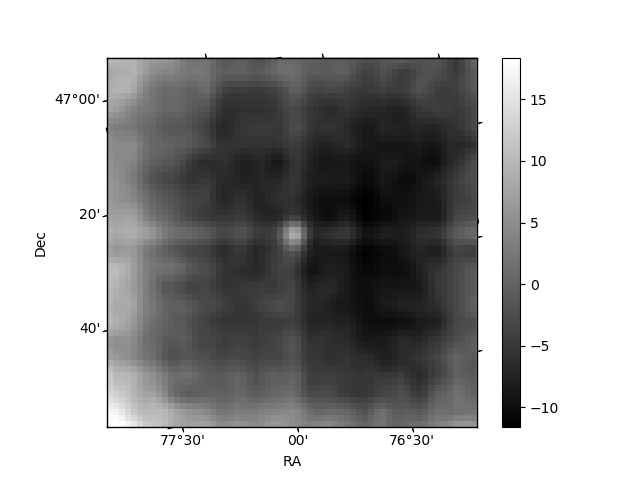
Quadrant B |
|---|---|---|---|
| Quadrant D | 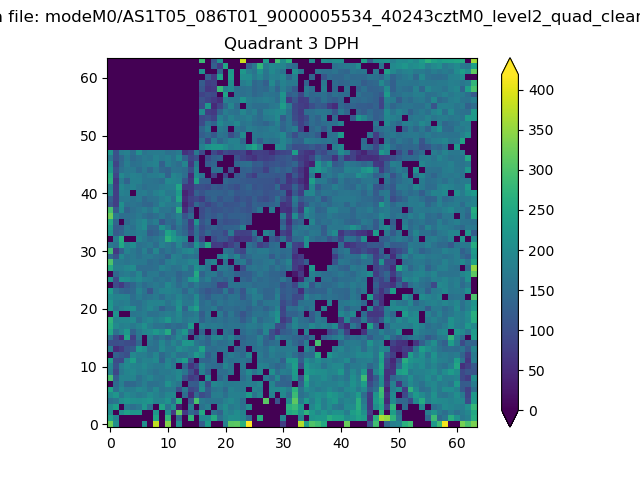 |
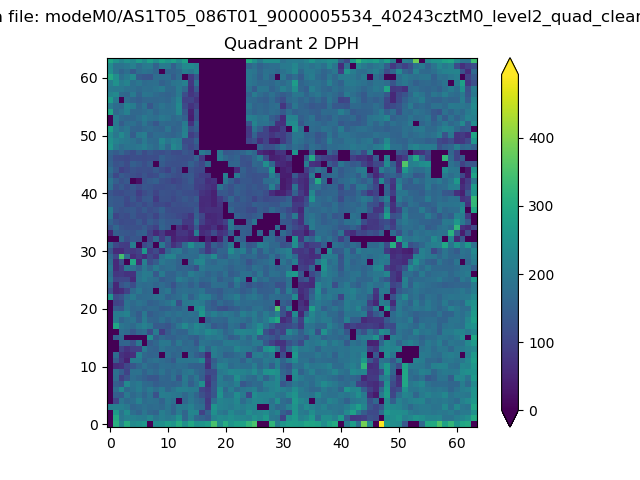 |
Quadrant C |
| Plot type | Count rate plots | Images |
|---|---|---|
| Comparison with Poisson distribution Blue bars denote a histogram of data divided into 1 sec bins. Red curve is a Poisson curve with rate = median count rate of data. |
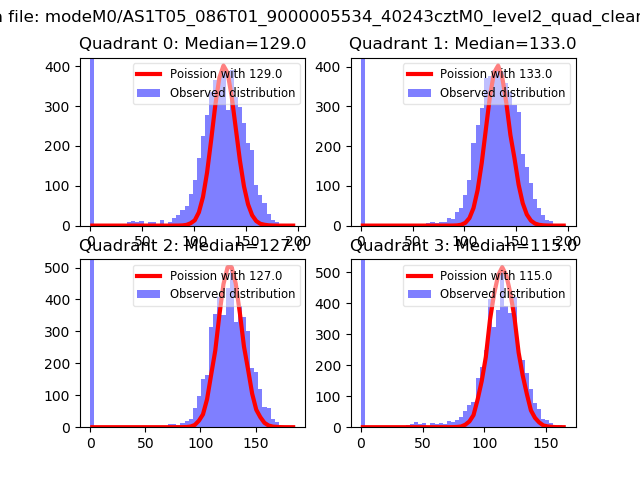 |
 |
| Quadrant-wise count rates Data is divided into 100 sec bins |
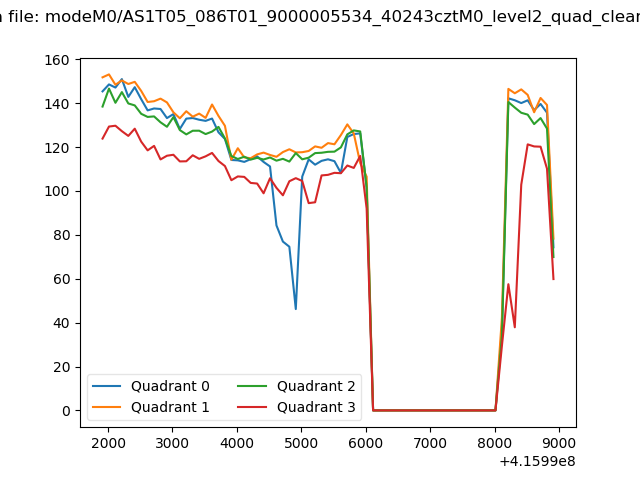 |
|
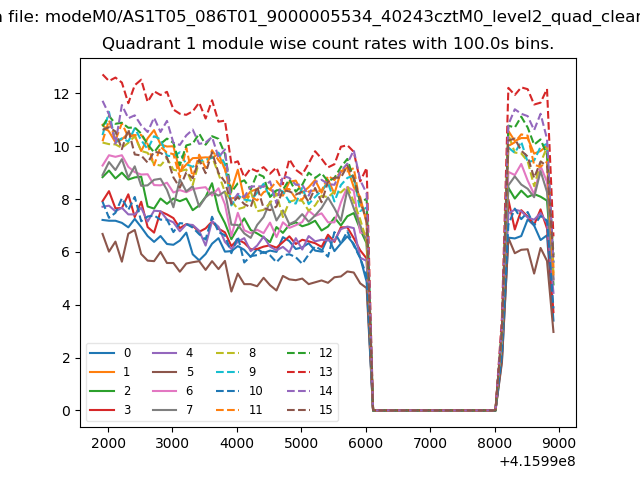
| Module-wise count rates for Quadrant A Data is divided into 100 sec bins |
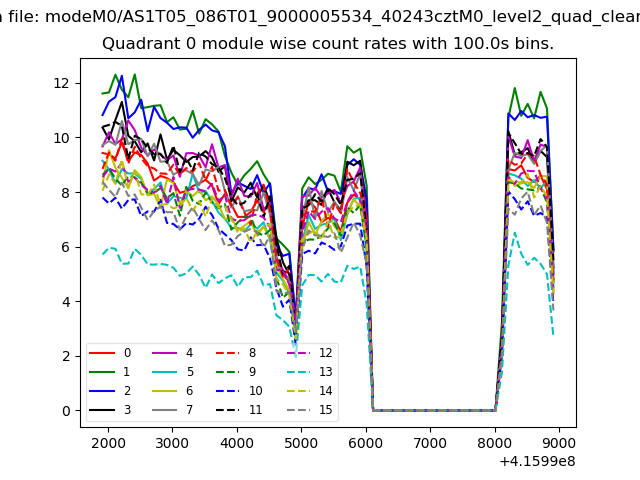 |
 |
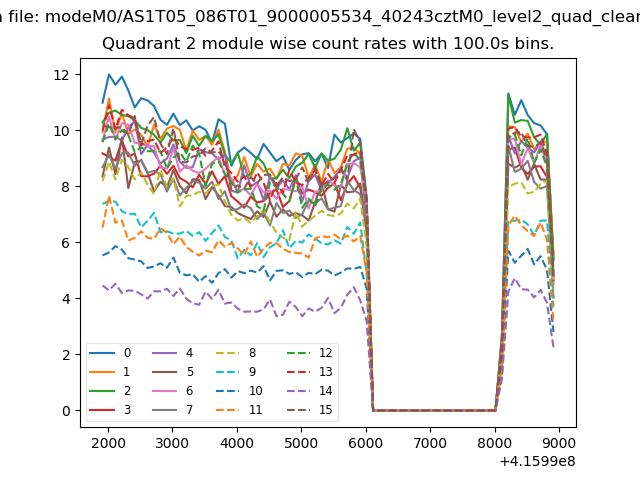
| Module-wise count rates for Quadrant B Data is divided into 100 sec bins |
 |
 |
| Module-wise count rates for Quadrant C Data is divided into 100 sec bins |
 |
 |
| Module-wise count rates for Quadrant D Data is divided into 100 sec bins |
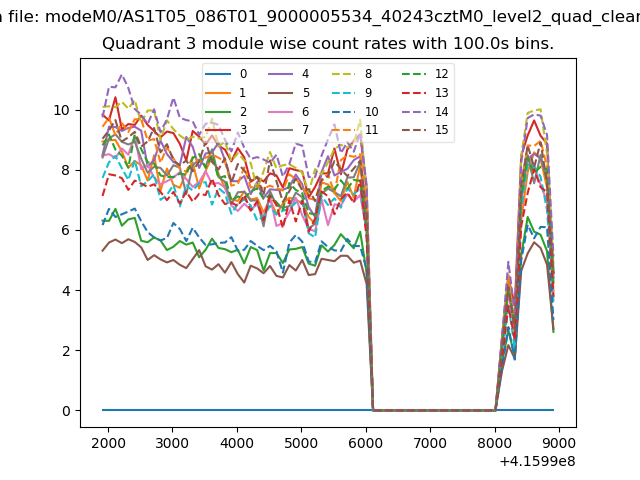 |
 |
| Parameter | Plot |
|---|---|
| CZT HV Monitor | 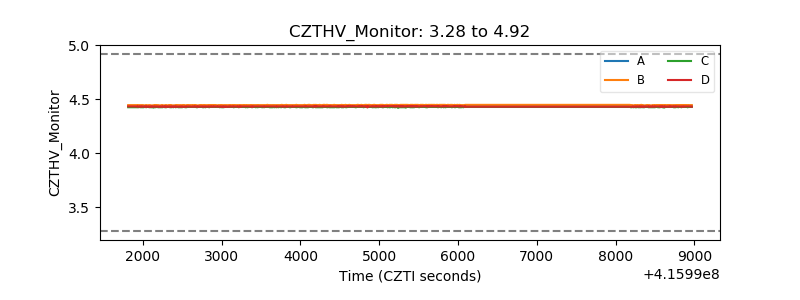 |
| D_VDD | 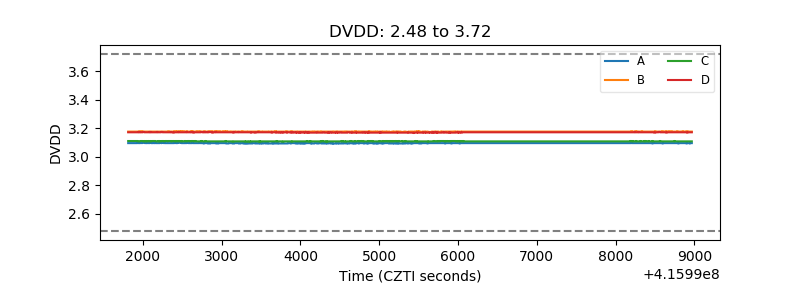 |
| Temperature 1 | 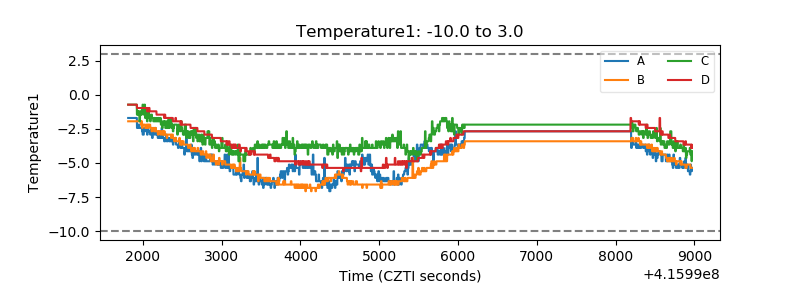 |
| Veto HV Monitor | 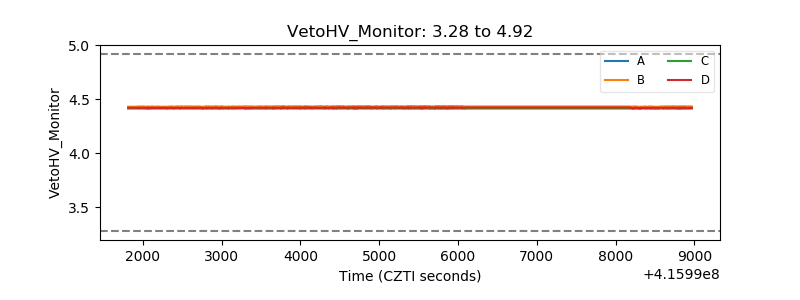 |
| Veto LLD | 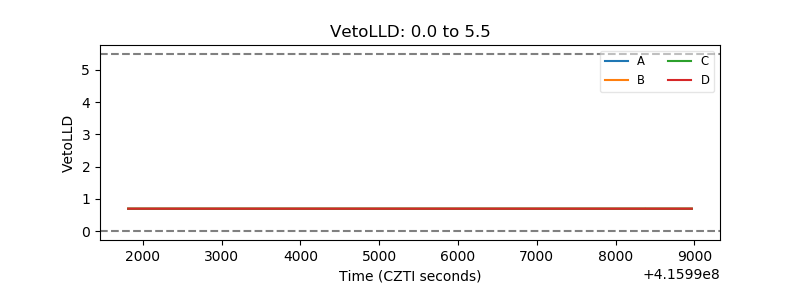 |
| Alpha Counter | 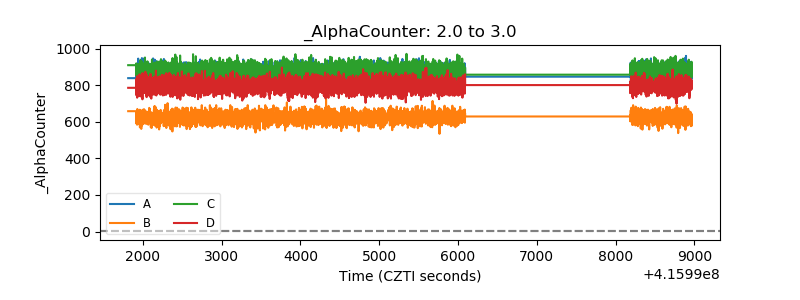 |
| _CPM_Rate |  |
| CZT Counter | 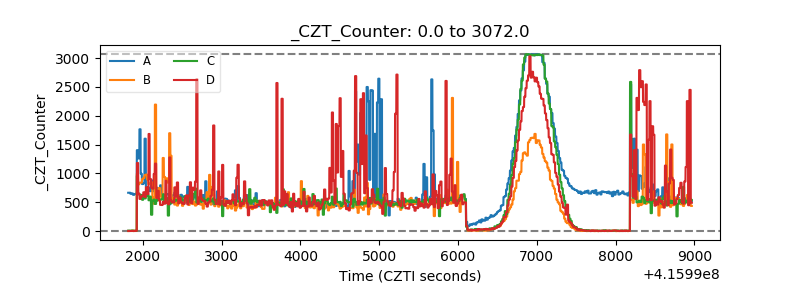 |
| +2.5 Volts monitor | 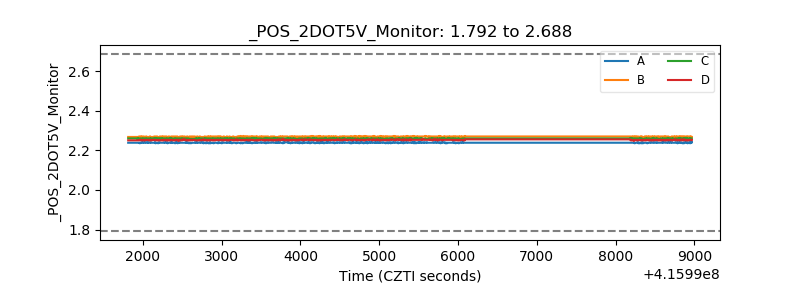 |
| +5 Volts monitor | 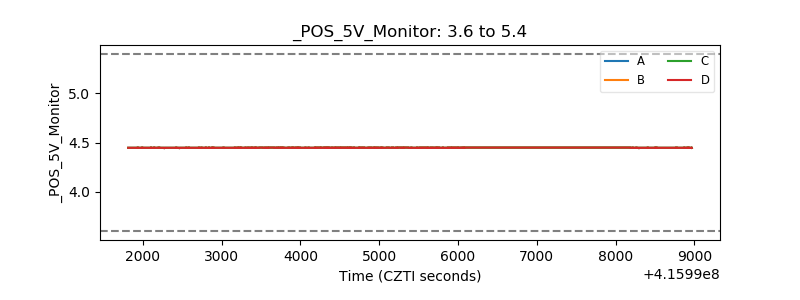 |
| _ROLL_ROT | 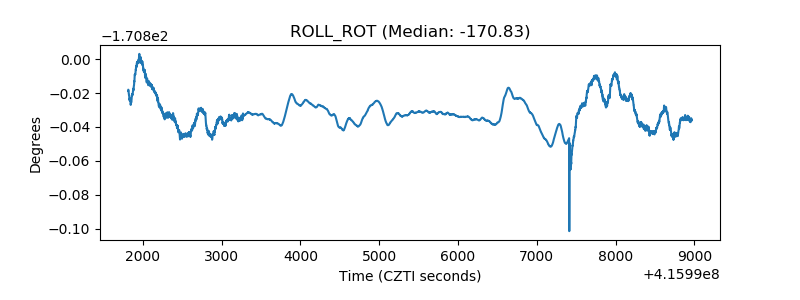 |
| _Roll_DEC | 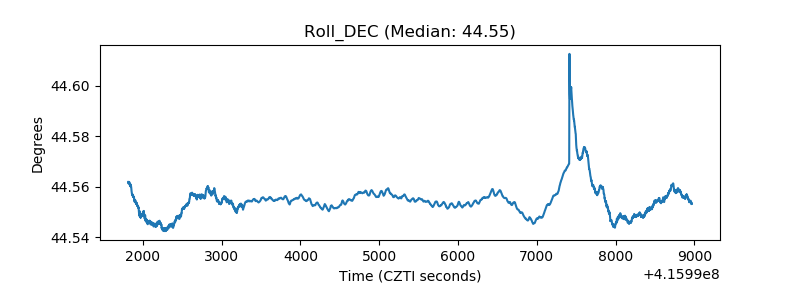 |
| _Roll_RA | 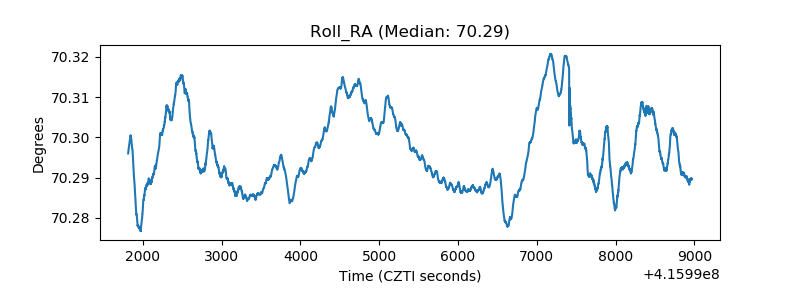 |
| Veto Counter | 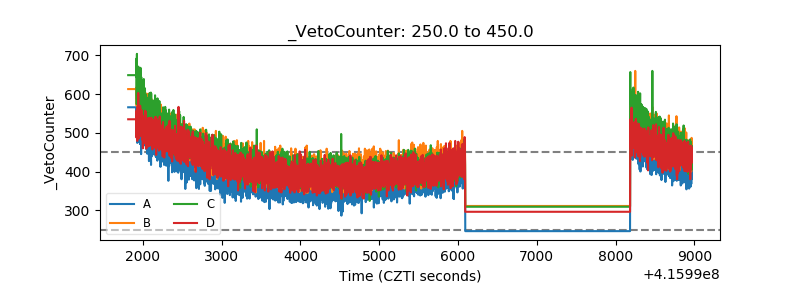 |