| Param | Original file | Final file |
|---|---|---|
| Filename | modeM0/AS1T05_086T01_9000005534_40245cztM0_level2.fits | modeM0/AS1T05_086T01_9000005534_40245cztM0_level2_quad_clean.evt |
| Size (bytes) | 316,736,640 | 86,690,880 |
| Size | 302.1 MB | 82.7 MB |
| Events in quadrant A | 3,006,231 | 579,824 |
| Events in quadrant B | 2,706,900 | 609,070 |
| Events in quadrant C | 2,436,301 | 582,528 |
| Events in quadrant D | 3,190,447 | 507,891 |
| Mode M0 | |||
|---|---|---|---|
| Quadrant | BADHDUFLAG | Total packets | Discarded packets |
| A | 0 | 11994 | 3 |
| B | 0 | 11064 | 2 |
| C | 0 | 10230 | 2 |
| D | 0 | 12997 | 2 |
| Mode M9 | |||
|---|---|---|---|
| Quadrant | BADHDUFLAG | Total packets | Discarded packets |
| A | 0 | 31 | 0 |
| B | 0 | 31 | 0 |
| C | 0 | 31 | 0 |
| D | 0 | 32 | 0 |
| Mode SS | |||
|---|---|---|---|
| Quadrant | BADHDUFLAG | Total packets | Discarded packets |
| A | 0 | 100 | 0 |
| B | 0 | 100 | 0 |
| C | 0 | 100 | 0 |
| D | 0 | 100 | 0 |
| Quadrant | Total seconds | Saturated seconds | Saturation percentage |
|---|---|---|---|
| A | 4934 | 97 | 1.965951% |
| B | 4934 | 40 | 0.810701% |
| C | 4934 | 26 | 0.526956% |
| D | 4934 | 277 | 5.614106% |
Noise dominated data is calculated using 1-second bins in cleaned event files. If a bin has >2000 counts, and if more than 50% of those come from <1% of pixels, then it is considered to be noise-dominated and hence unusable.
| Quadrant | # 1 sec bins | Bins with >0 counts | Bins with >2000 counts | High rate bins dominated by noise | Noise dominated (total time) | Noise dominated (detector-on time) | Marked lightcurve |
|---|---|---|---|---|---|---|---|
| A | 7027 | 4935 | 70 | 70 | 1.00% | 1.42% | 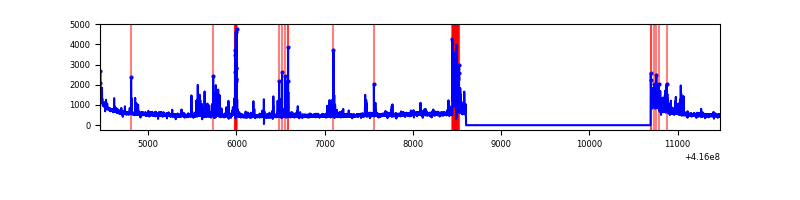 |
| B | 7027 | 4935 | 26 | 26 | 0.37% | 0.53% | 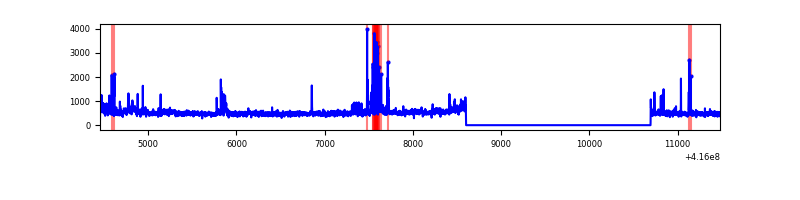 |
| C | 7027 | 4935 | 20 | 20 | 0.28% | 0.41% | 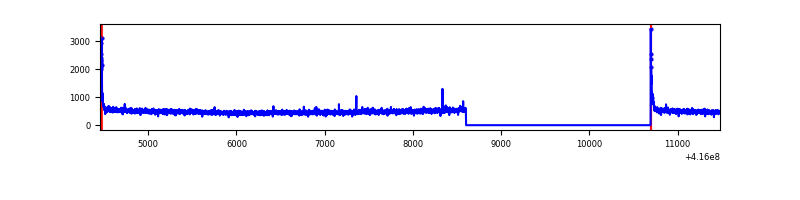 |
| D | 7027 | 4935 | 223 | 223 | 3.17% | 4.52% | 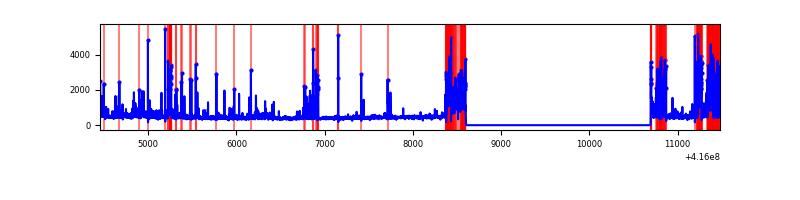 |
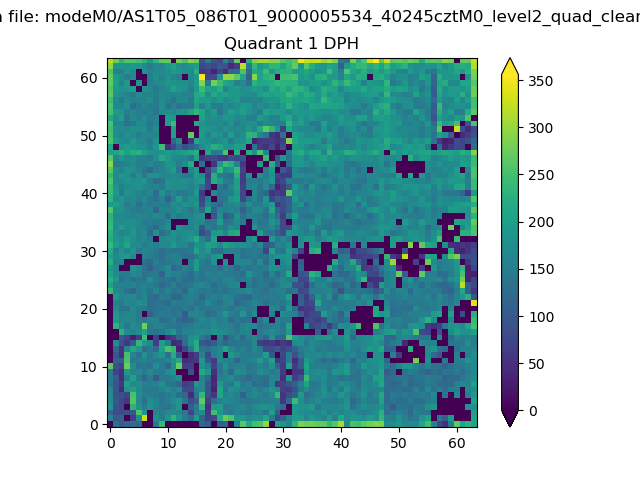
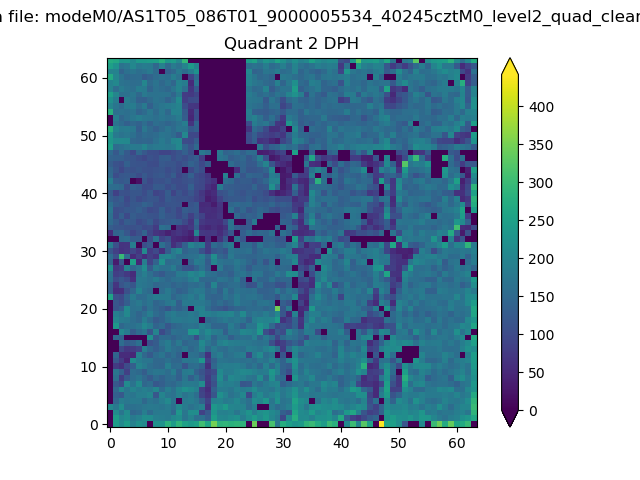
Top three noisy pixels from each quadrant. If the there are fewer than three noisy pixels in the level2.evt file, extra rows are filled as -1
| Pixel properties | Quadrant properties | ||||||
|---|---|---|---|---|---|---|---|
| Quadrant | DetID | PixID | Counts | Sigma | Mean | Median | Sigma |
| A | 10 | 83 | 443857 | 3955.64 | 545 | 534 | 112.1 |
| A | 13 | 248 | 407192 | 3628.49 | 545 | 534 | 112.1 |
| A | 13 | 6 | 13605 | 116.62 | 545 | 534 | 112.1 |
| B | 7 | 202 | 277526 | 2592.85 | 551 | 537 | 106.8 |
| B | 5 | 255 | 196164 | 1831.23 | 551 | 537 | 106.8 |
| B | 0 | 221 | 20095 | 183.08 | 551 | 537 | 106.8 |
| C | 15 | 214 | 213280 | 1673.98 | 543 | 547 | 127.1 |
| C | 0 | 10 | 81521 | 637.18 | 543 | 547 | 127.1 |
| C | 1 | 16 | 12412 | 93.36 | 543 | 547 | 127.1 |
| D | 12 | 227 | 920016 | 7117.67 | 524 | 510 | 129.2 |
| D | 13 | 249 | 63685 | 489.02 | 524 | 510 | 129.2 |
| D | 9 | 19 | 37674 | 287.68 | 524 | 510 | 129.2 |
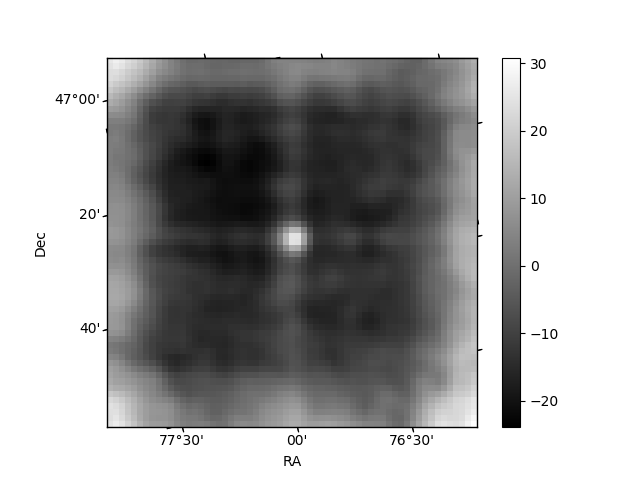
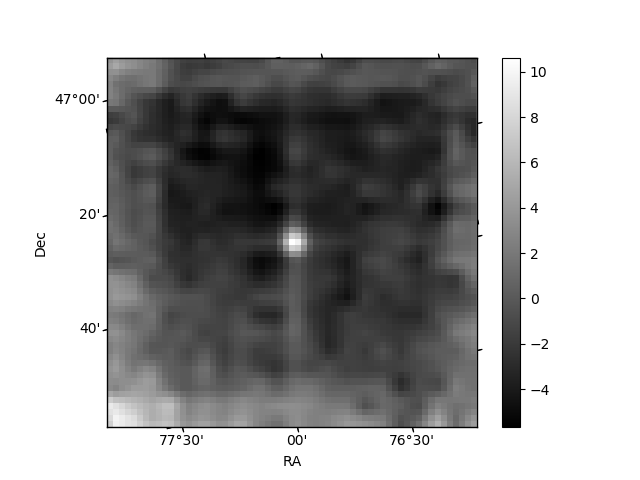
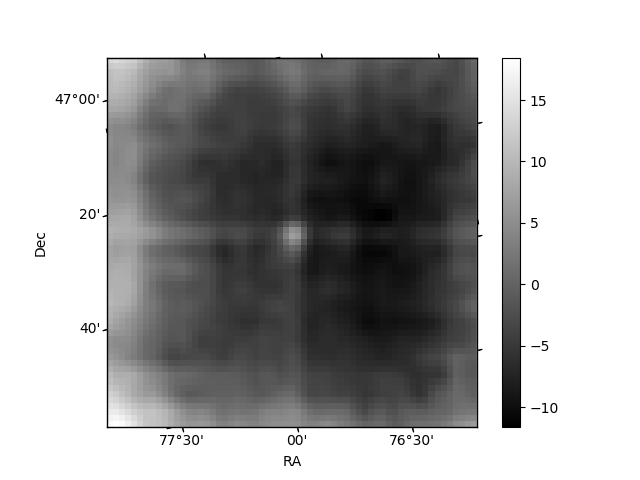
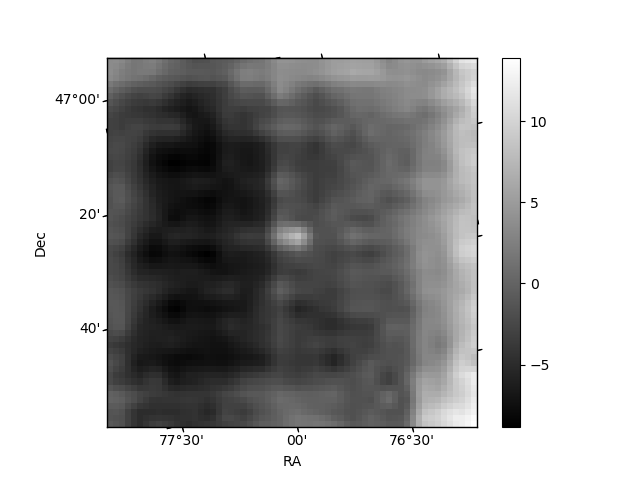
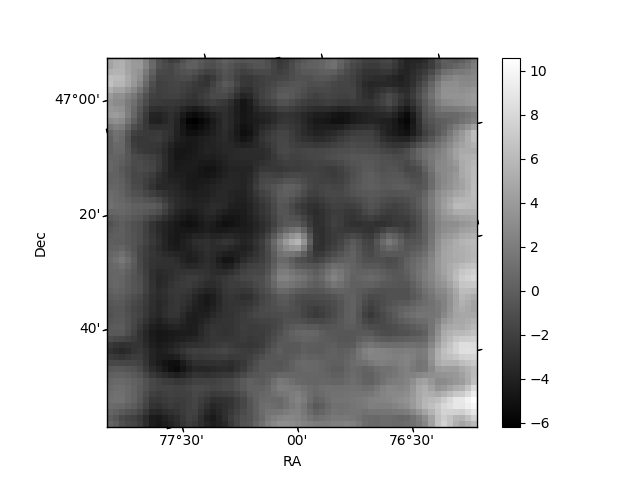
Histogram calculated using DETX and DETY for each event in the final _common_clean file
| Quadrant A | 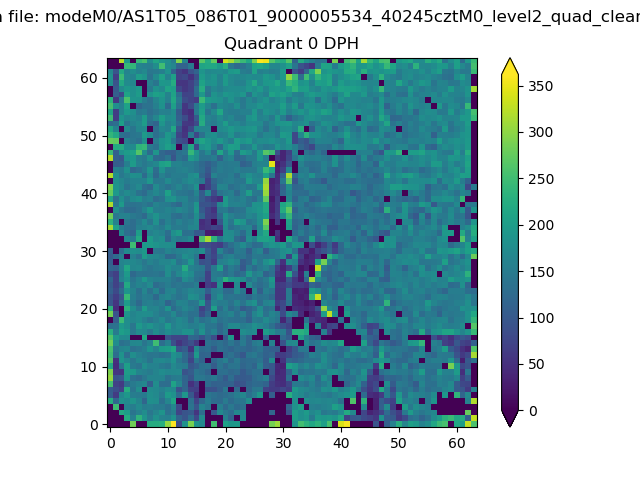 |
 |
Quadrant B |
|---|---|---|---|
| Quadrant D | 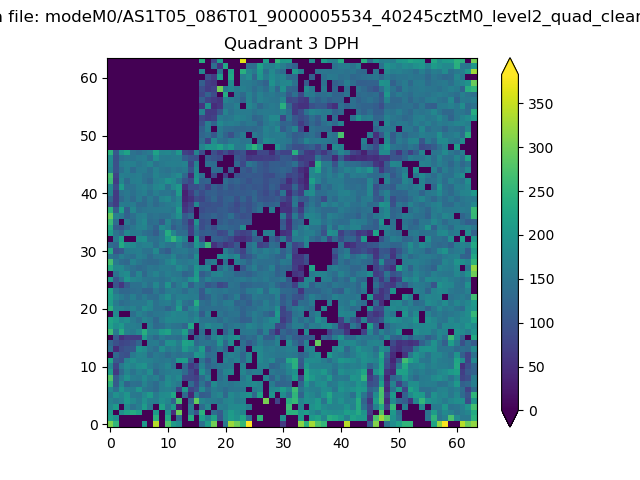 |
 |
Quadrant C |
| Plot type | Count rate plots | Images |
|---|---|---|
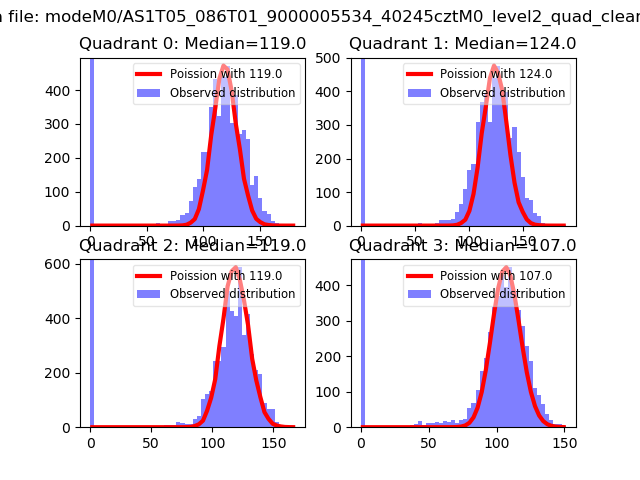
| Comparison with Poisson distribution Blue bars denote a histogram of data divided into 1 sec bins. Red curve is a Poisson curve with rate = median count rate of data. |
 |
 |
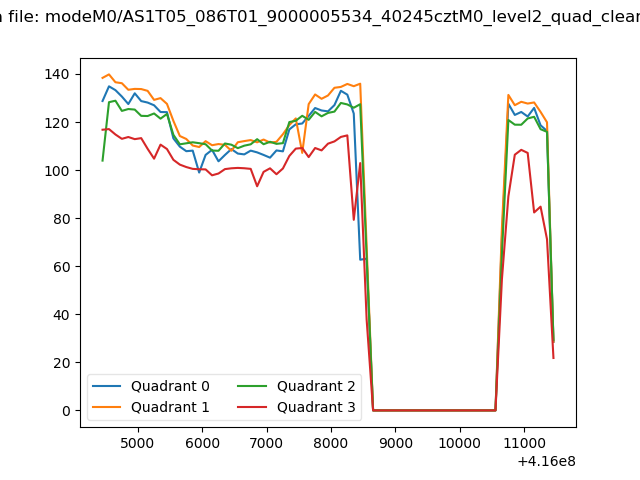
| Quadrant-wise count rates Data is divided into 100 sec bins |
 |
|
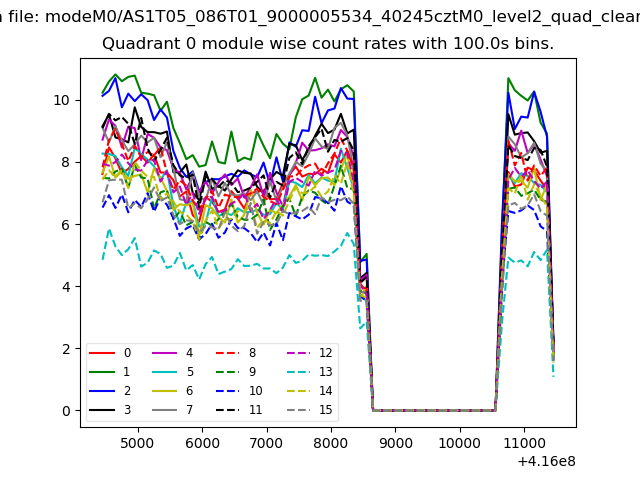
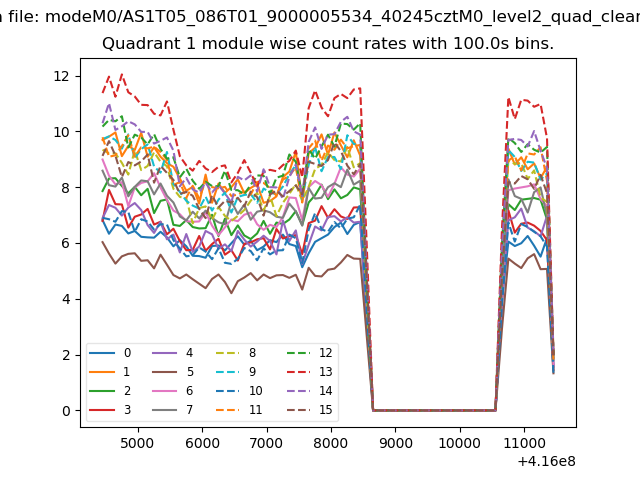
| Module-wise count rates for Quadrant A Data is divided into 100 sec bins |
 |
 |
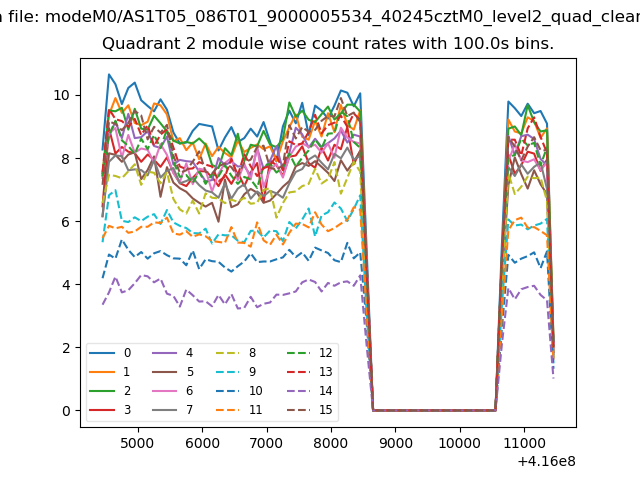
| Module-wise count rates for Quadrant B Data is divided into 100 sec bins |
 |
 |
| Module-wise count rates for Quadrant C Data is divided into 100 sec bins |
 |
 |
| Module-wise count rates for Quadrant D Data is divided into 100 sec bins |
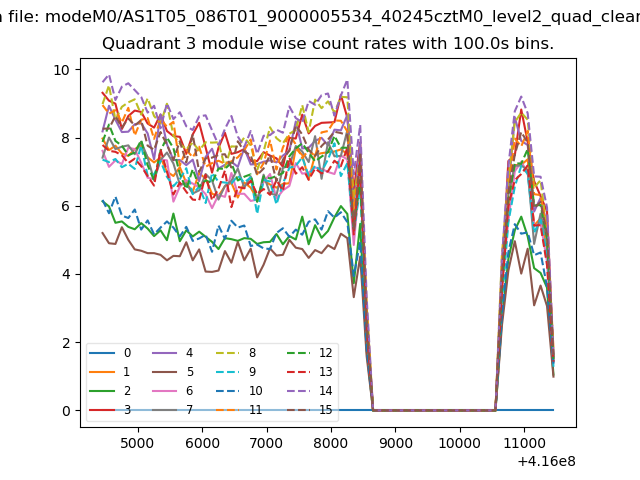 |
 |
| Parameter | Plot |
|---|---|
| CZT HV Monitor | 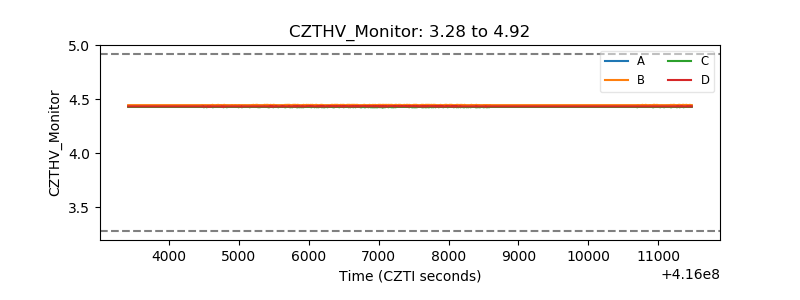 |
| D_VDD | 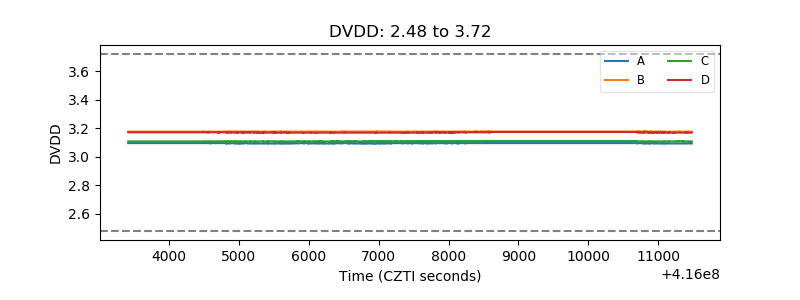 |
| Temperature 1 | 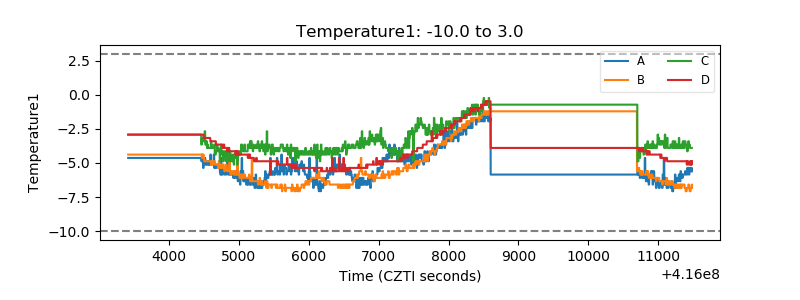 |
| Veto HV Monitor | 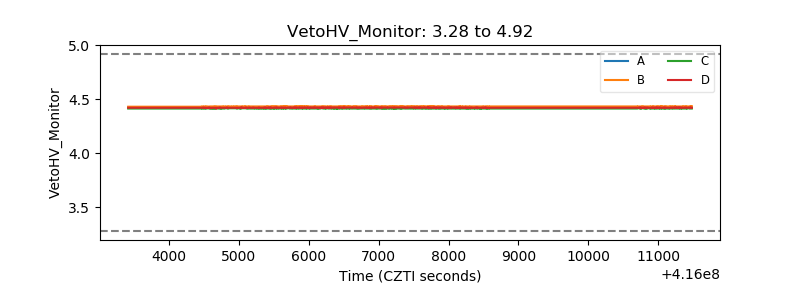 |
| Veto LLD | 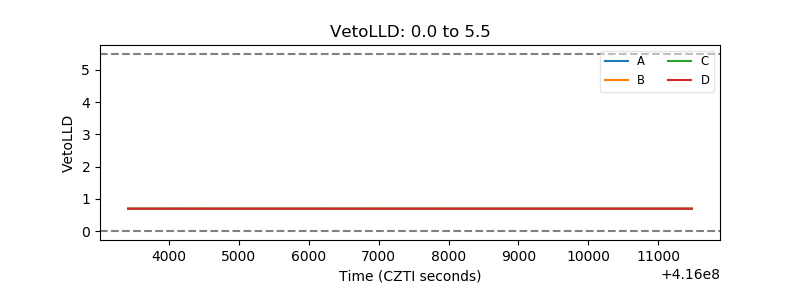 |
| Alpha Counter | 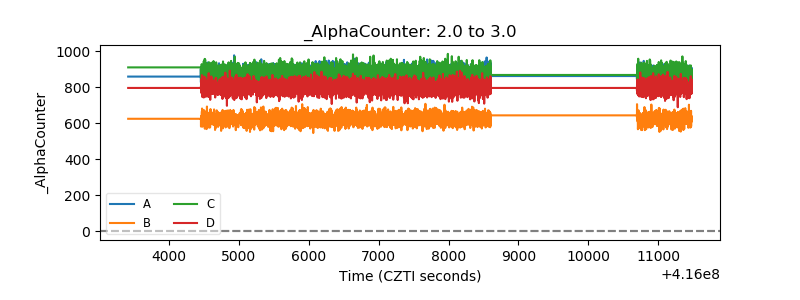 |
| _CPM_Rate | 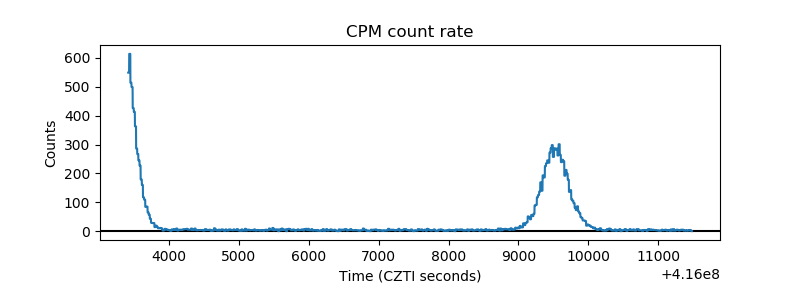 |
| CZT Counter | 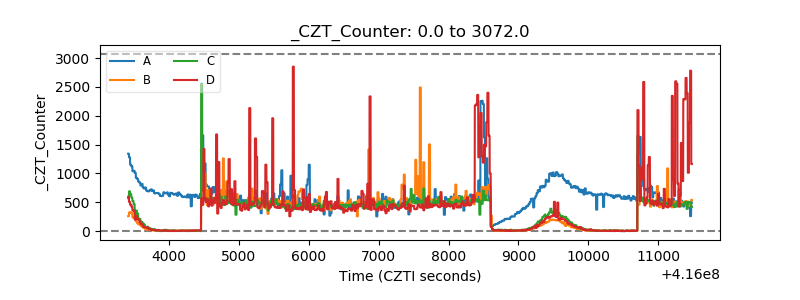 |
| +2.5 Volts monitor | 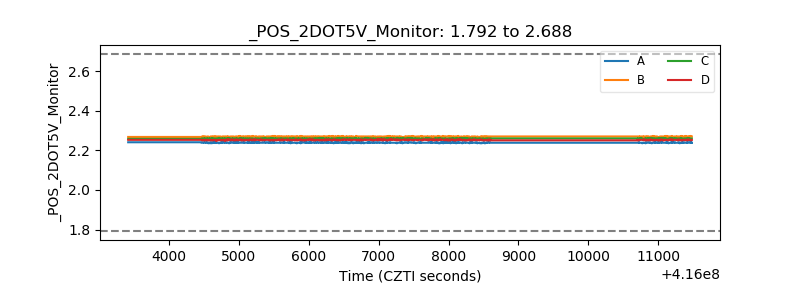 |
| +5 Volts monitor | 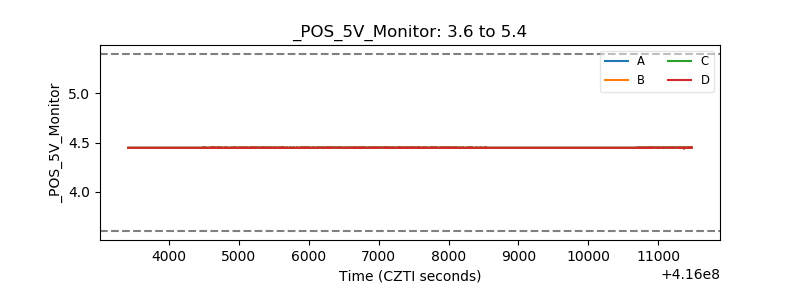 |
| _ROLL_ROT | 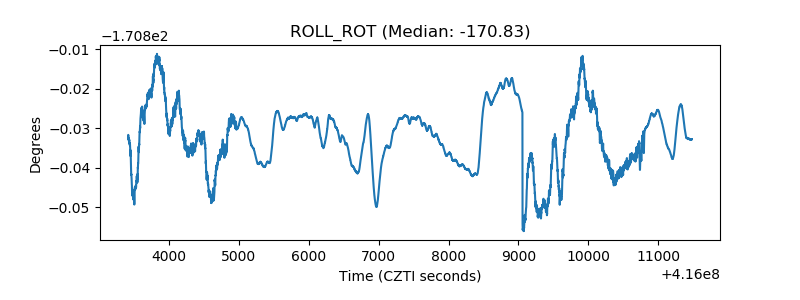 |
| _Roll_DEC | 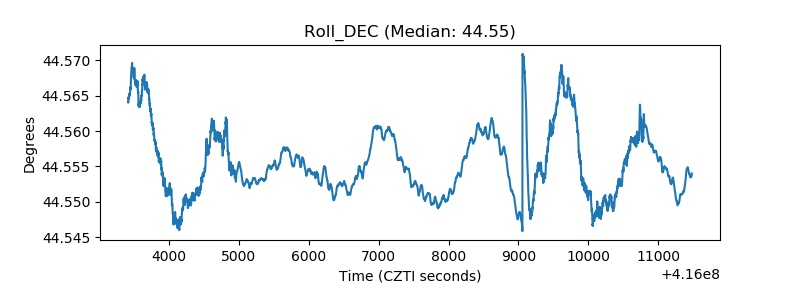 |
| _Roll_RA | 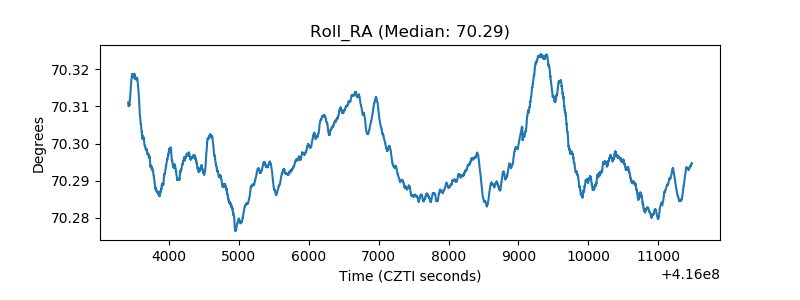 |
| Veto Counter | 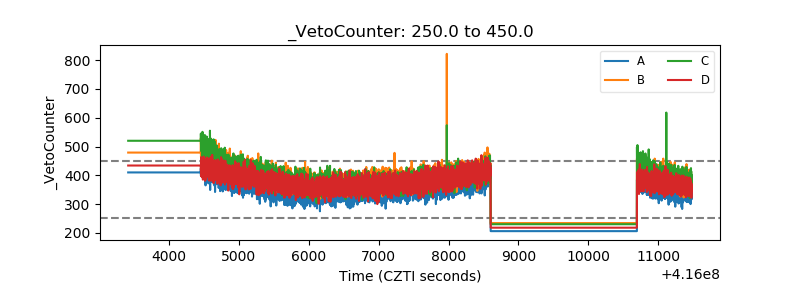 |