| Param | Original file | Final file |
|---|---|---|
| Filename | modeM0/AS1T05_086T01_9000005534_40246cztM0_level2.fits | modeM0/AS1T05_086T01_9000005534_40246cztM0_level2_quad_clean.evt |
| Size (bytes) | 333,506,880 | 87,894,720 |
| Size | 318.1 MB | 83.8 MB |
| Events in quadrant A | 3,013,324 | 587,480 |
| Events in quadrant B | 2,491,707 | 612,170 |
| Events in quadrant C | 2,538,047 | 588,330 |
| Events in quadrant D | 3,898,999 | 510,635 |
| Mode M0 | |||
|---|---|---|---|
| Quadrant | BADHDUFLAG | Total packets | Discarded packets |
| A | 0 | 12208 | 3 |
| B | 0 | 10871 | 2 |
| C | 0 | 10778 | 2 |
| D | 0 | 15218 | 2 |
| Mode M9 | |||
|---|---|---|---|
| Quadrant | BADHDUFLAG | Total packets | Discarded packets |
| A | 0 | 37 | 0 |
| B | 0 | 37 | 0 |
| C | 0 | 37 | 0 |
| D | 0 | 38 | 0 |
| Mode SS | |||
|---|---|---|---|
| Quadrant | BADHDUFLAG | Total packets | Discarded packets |
| A | 0 | 106 | 0 |
| B | 0 | 106 | 0 |
| C | 0 | 106 | 0 |
| D | 0 | 106 | 0 |
| Quadrant | Total seconds | Saturated seconds | Saturation percentage |
|---|---|---|---|
| A | 5175 | 75 | 1.449275% |
| B | 5175 | 18 | 0.347826% |
| C | 5175 | 16 | 0.309179% |
| D | 5175 | 374 | 7.227053% |
Noise dominated data is calculated using 1-second bins in cleaned event files. If a bin has >2000 counts, and if more than 50% of those come from <1% of pixels, then it is considered to be noise-dominated and hence unusable.
| Quadrant | # 1 sec bins | Bins with >0 counts | Bins with >2000 counts | High rate bins dominated by noise | Noise dominated (total time) | Noise dominated (detector-on time) | Marked lightcurve |
|---|---|---|---|---|---|---|---|
| A | 7088 | 5176 | 45 | 45 | 0.63% | 0.87% | 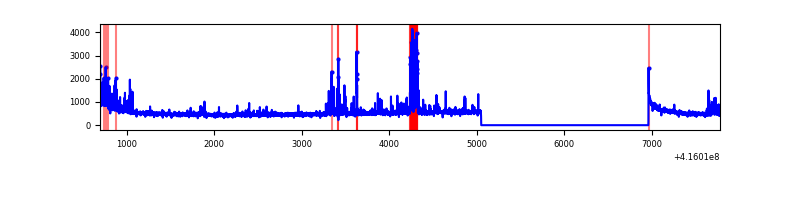 |
| B | 7088 | 5176 | 14 | 14 | 0.20% | 0.27% | 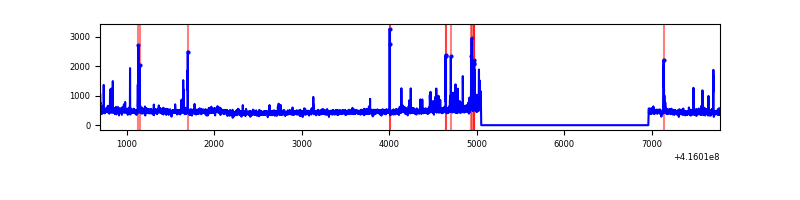 |
| C | 7088 | 5176 | 9 | 9 | 0.13% | 0.17% | 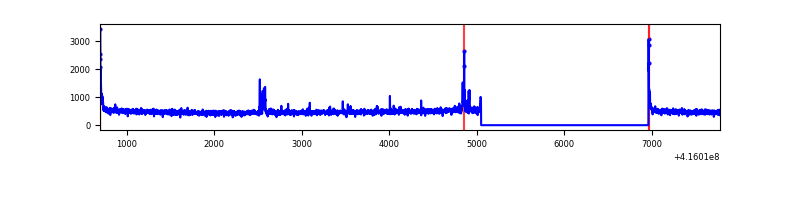 |
| D | 7088 | 5176 | 324 | 324 | 4.57% | 6.26% | 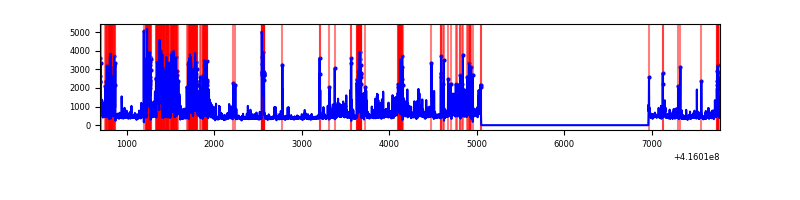 |
Top three noisy pixels from each quadrant. If the there are fewer than three noisy pixels in the level2.evt file, extra rows are filled as -1
| Pixel properties | Quadrant properties | ||||||
|---|---|---|---|---|---|---|---|
| Quadrant | DetID | PixID | Counts | Sigma | Mean | Median | Sigma |
| A | 10 | 83 | 450945 | 3860.97 | 564 | 553 | 116.7 |
| A | 13 | 248 | 322335 | 2758.47 | 564 | 553 | 116.7 |
| A | 7 | 3 | 30061 | 252.96 | 564 | 553 | 116.7 |
| B | 5 | 255 | 94544 | 850.26 | 569 | 556 | 110.5 |
| B | 7 | 202 | 56569 | 506.72 | 569 | 556 | 110.5 |
| B | 4 | 171 | 48442 | 433.2 | 569 | 556 | 110.5 |
| C | 15 | 214 | 220516 | 1673.2 | 560 | 565 | 131.5 |
| C | 14 | 254 | 73778 | 556.94 | 560 | 565 | 131.5 |
| C | 0 | 10 | 52901 | 398.13 | 560 | 565 | 131.5 |
| D | 12 | 227 | 1514928 | 11411.48 | 538 | 526 | 132.7 |
| D | 13 | 249 | 91353 | 684.41 | 538 | 526 | 132.7 |
| D | 6 | 239 | 88946 | 666.27 | 538 | 526 | 132.7 |
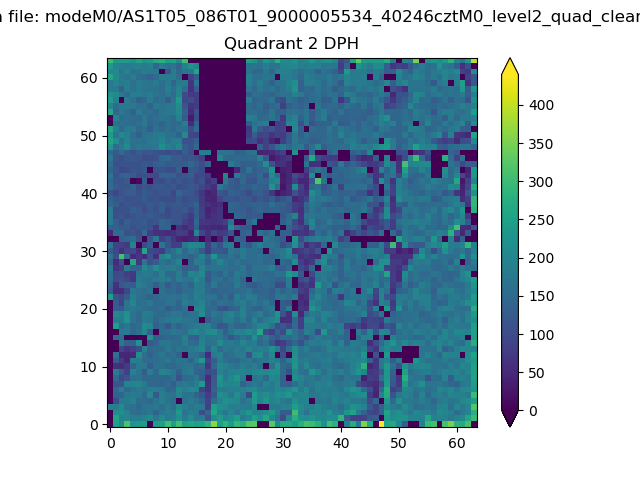
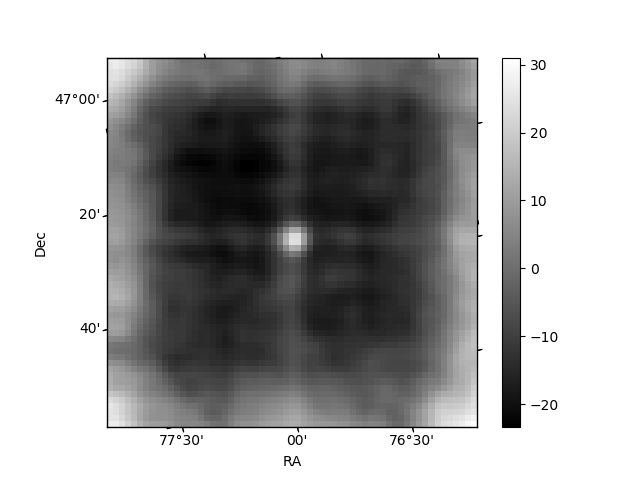
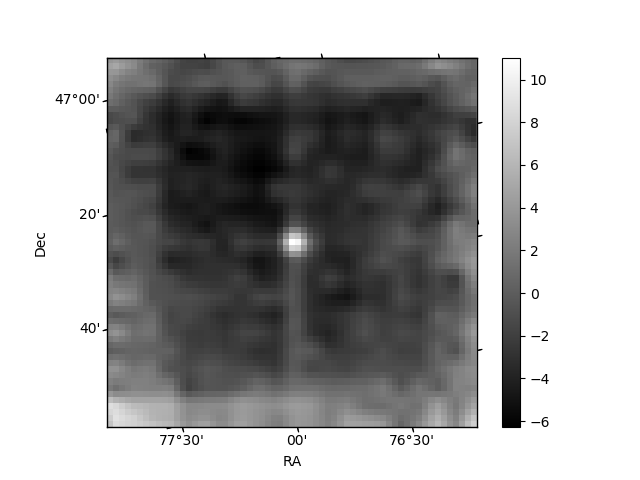
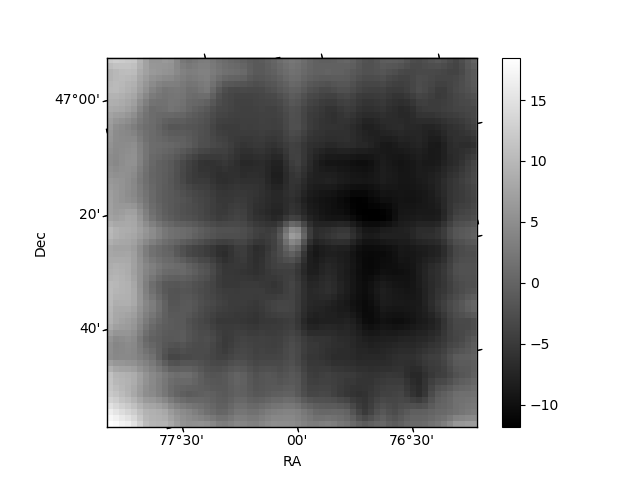
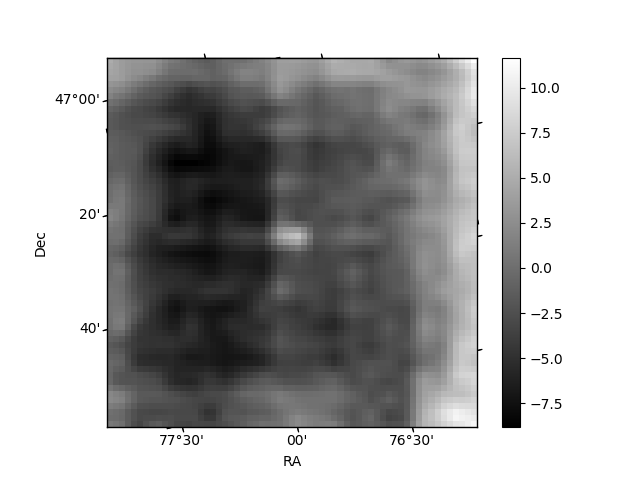
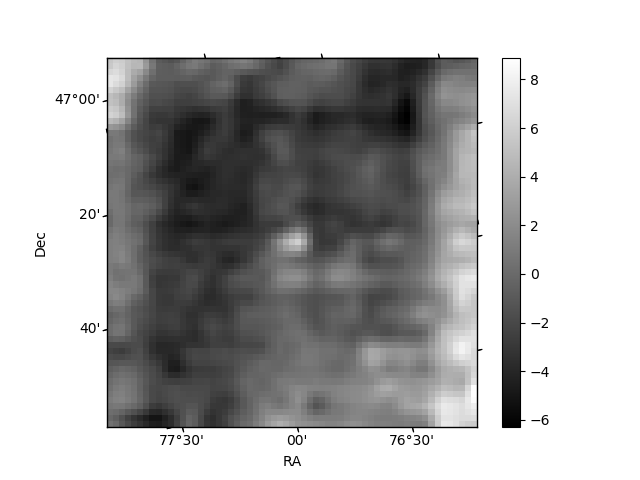
Histogram calculated using DETX and DETY for each event in the final _common_clean file
| Quadrant A | 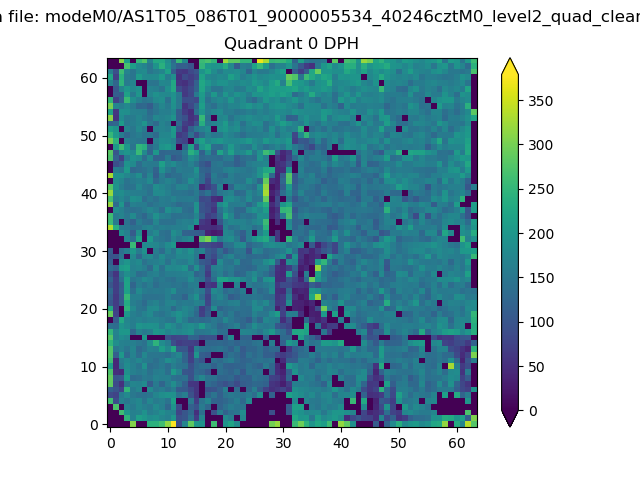 |
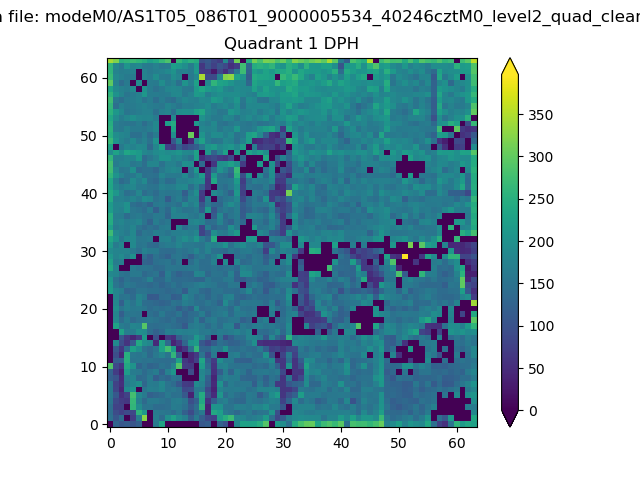 |
Quadrant B |
|---|---|---|---|
| Quadrant D | 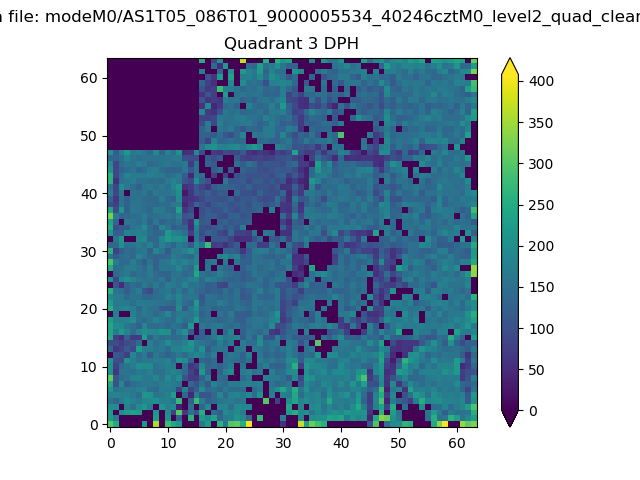 |
 |
Quadrant C |
| Plot type | Count rate plots | Images |
|---|---|---|
| Comparison with Poisson distribution Blue bars denote a histogram of data divided into 1 sec bins. Red curve is a Poisson curve with rate = median count rate of data. |
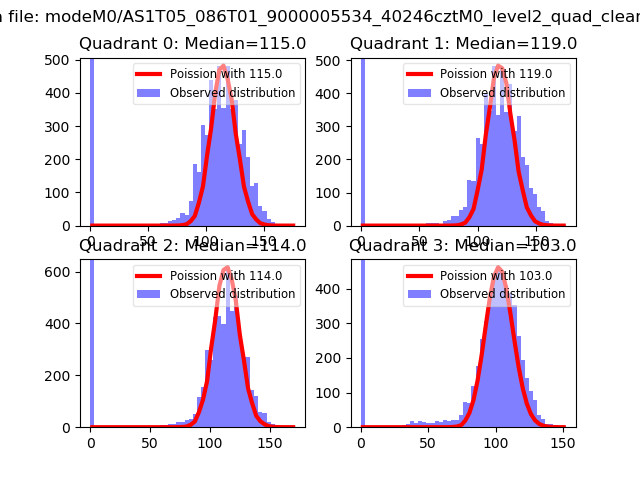 |
 |
| Quadrant-wise count rates Data is divided into 100 sec bins |
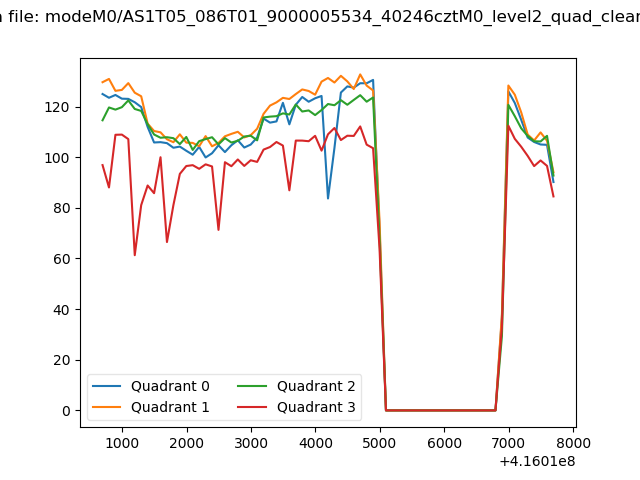 |
|
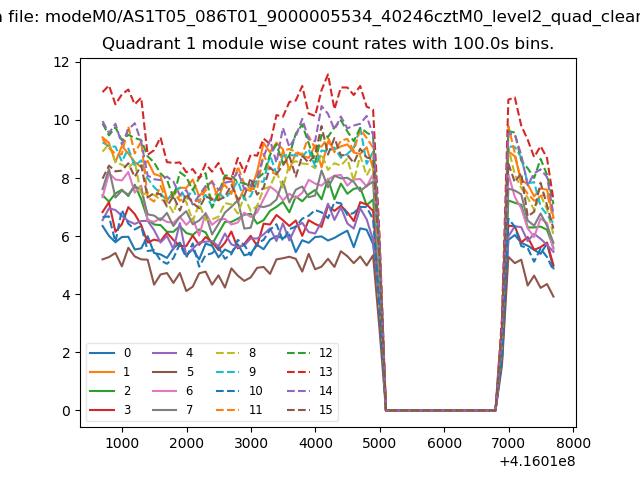
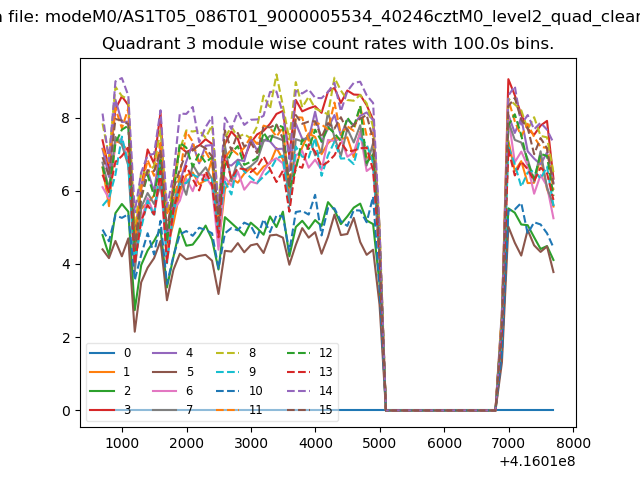
| Module-wise count rates for Quadrant A Data is divided into 100 sec bins |
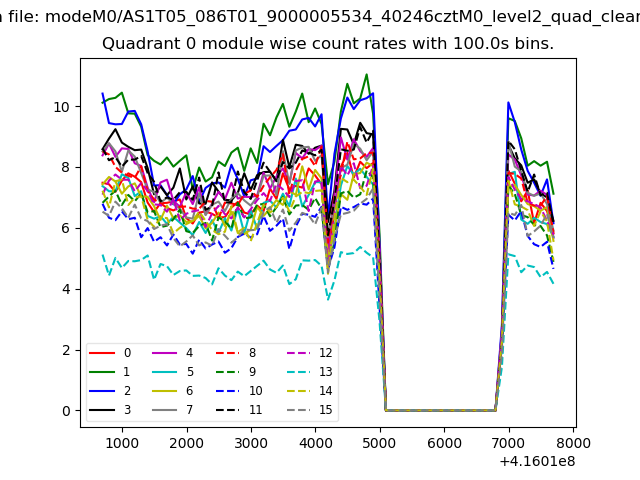 |
 |
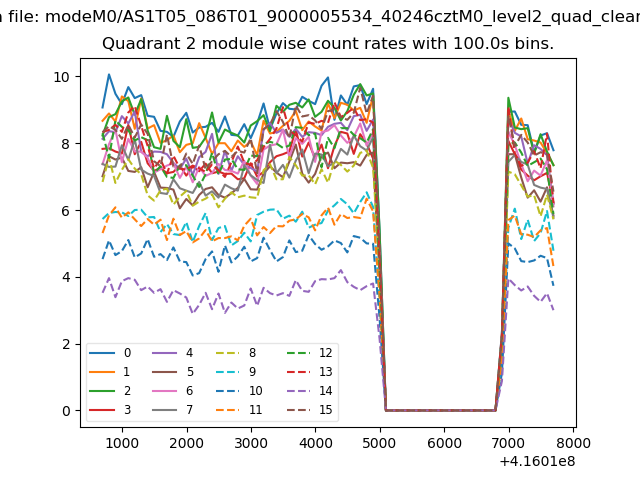
| Module-wise count rates for Quadrant B Data is divided into 100 sec bins |
 |
 |
| Module-wise count rates for Quadrant C Data is divided into 100 sec bins |
 |
 |
| Module-wise count rates for Quadrant D Data is divided into 100 sec bins |
 |
 |
| Parameter | Plot |
|---|---|
| CZT HV Monitor | 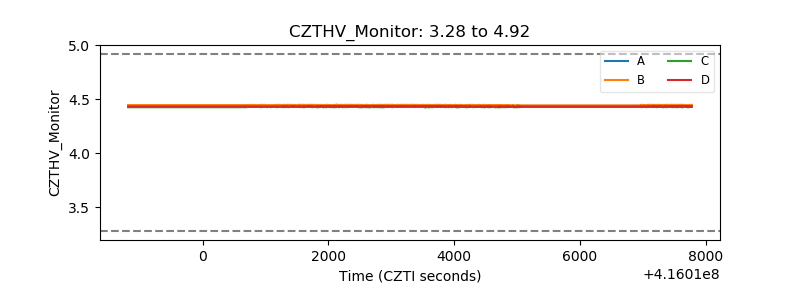 |
| D_VDD | 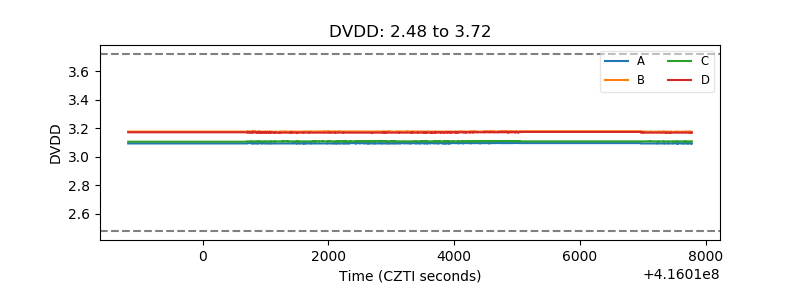 |
| Temperature 1 | 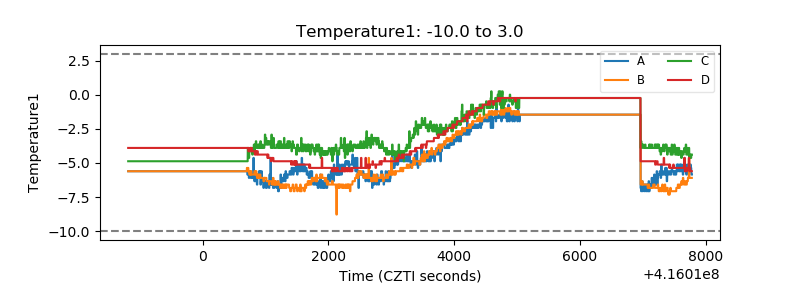 |
| Veto HV Monitor | 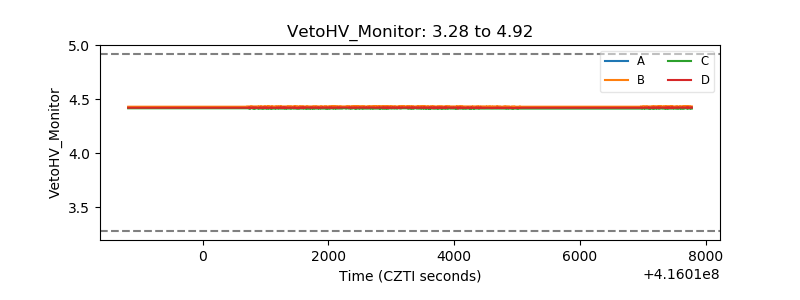 |
| Veto LLD | 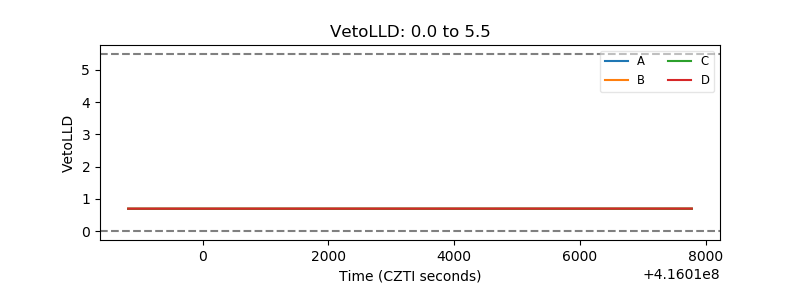 |
| Alpha Counter | 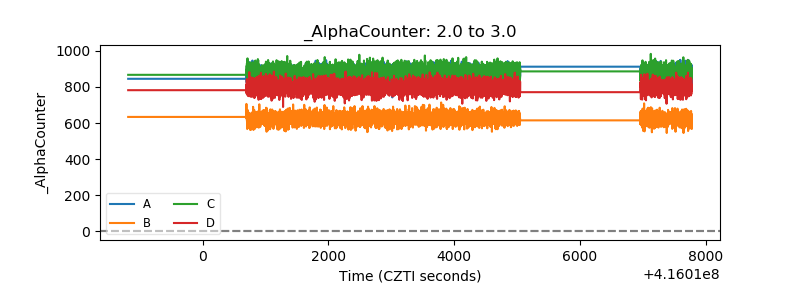 |
| _CPM_Rate | 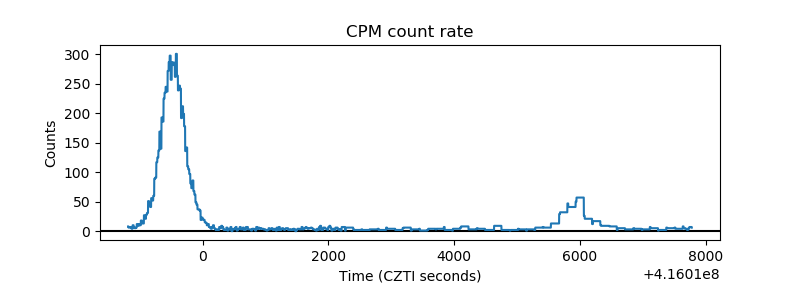 |
| CZT Counter | 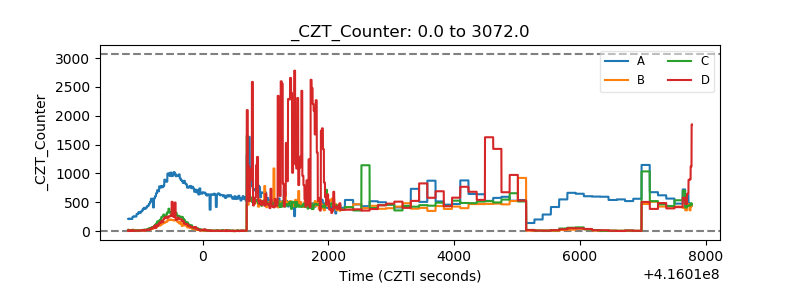 |
| +2.5 Volts monitor | 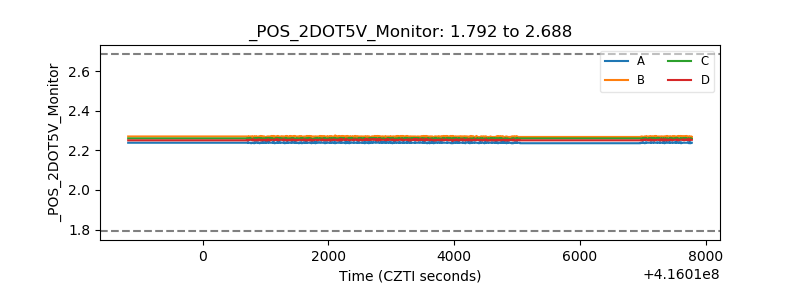 |
| +5 Volts monitor | 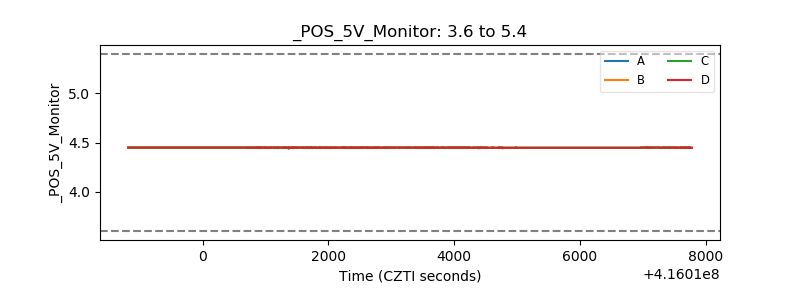 |
| _ROLL_ROT | 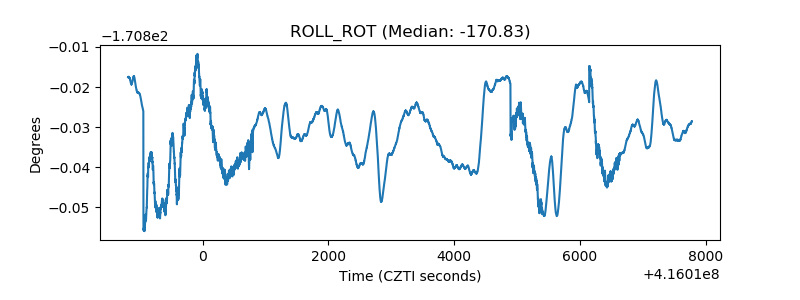 |
| _Roll_DEC | 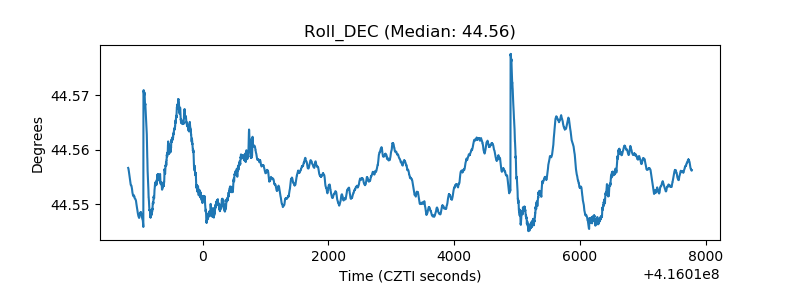 |
| _Roll_RA | 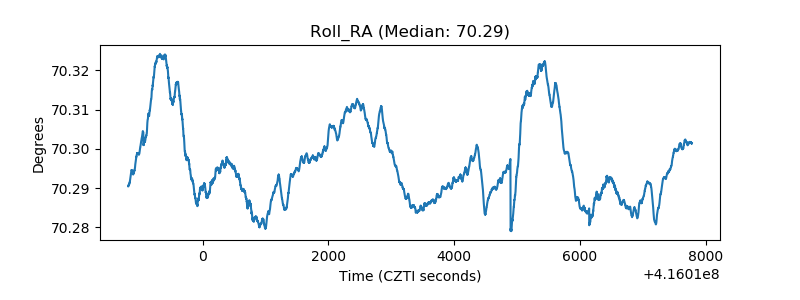 |
| Veto Counter | 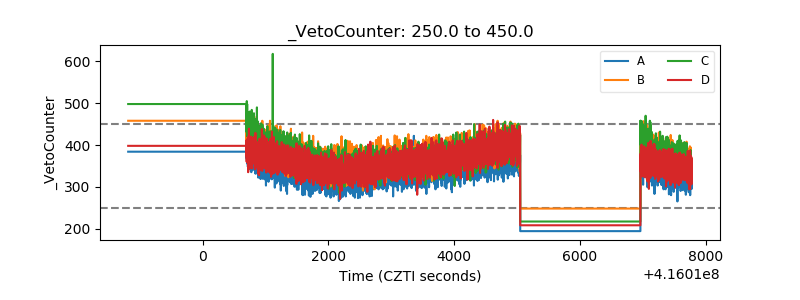 |