| Param | Original file | Final file |
|---|---|---|
| Filename | modeM0/AS1T05_086T01_9000005534_40247cztM0_level2.fits | modeM0/AS1T05_086T01_9000005534_40247cztM0_level2_quad_clean.evt |
| Size (bytes) | 351,936,000 | 96,825,600 |
| Size | 335.6 MB | 92.3 MB |
| Events in quadrant A | 3,537,349 | 638,385 |
| Events in quadrant B | 2,887,408 | 667,040 |
| Events in quadrant C | 2,725,001 | 645,142 |
| Events in quadrant D | 3,428,838 | 578,635 |
| Mode M0 | |||
|---|---|---|---|
| Quadrant | BADHDUFLAG | Total packets | Discarded packets |
| A | 0 | 14115 | 3 |
| B | 0 | 12649 | 2 |
| C | 0 | 11704 | 2 |
| D | 0 | 14268 | 2 |
| Mode M9 | |||
|---|---|---|---|
| Quadrant | BADHDUFLAG | Total packets | Discarded packets |
| A | 0 | 35 | 0 |
| B | 0 | 35 | 0 |
| C | 0 | 35 | 0 |
| D | 0 | 35 | 0 |
| Mode SS | |||
|---|---|---|---|
| Quadrant | BADHDUFLAG | Total packets | Discarded packets |
| A | 0 | 118 | 0 |
| B | 0 | 118 | 0 |
| C | 0 | 118 | 0 |
| D | 0 | 118 | 0 |
| Quadrant | Total seconds | Saturated seconds | Saturation percentage |
|---|---|---|---|
| A | 5764 | 138 | 2.394171% |
| B | 5764 | 55 | 0.954198% |
| C | 5764 | 13 | 0.225538% |
| D | 5764 | 154 | 2.671756% |
Noise dominated data is calculated using 1-second bins in cleaned event files. If a bin has >2000 counts, and if more than 50% of those come from <1% of pixels, then it is considered to be noise-dominated and hence unusable.
| Quadrant | # 1 sec bins | Bins with >0 counts | Bins with >2000 counts | High rate bins dominated by noise | Noise dominated (total time) | Noise dominated (detector-on time) | Marked lightcurve |
|---|---|---|---|---|---|---|---|
| A | 9230 | 5766 | 105 | 105 | 1.14% | 1.82% | 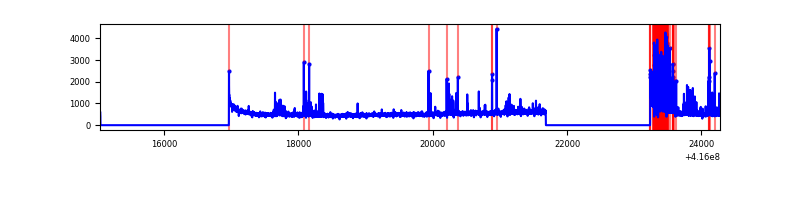 |
| B | 9230 | 5766 | 34 | 34 | 0.37% | 0.59% | 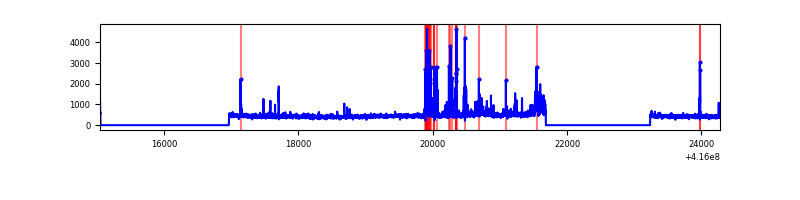 |
| C | 9230 | 5766 | 8 | 8 | 0.09% | 0.14% | 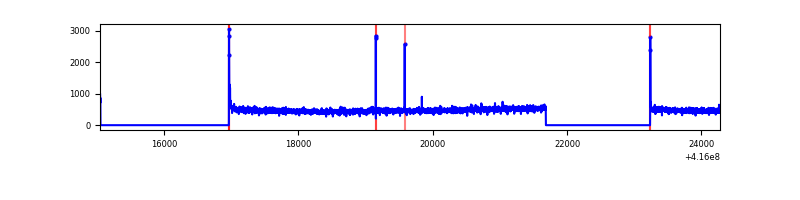 |
| D | 9230 | 5766 | 131 | 131 | 1.42% | 2.27% | 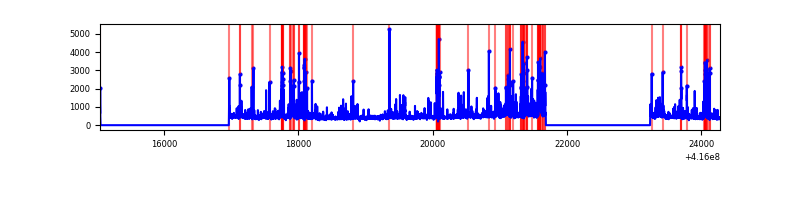 |
Top three noisy pixels from each quadrant. If the there are fewer than three noisy pixels in the level2.evt file, extra rows are filled as -1
| Pixel properties | Quadrant properties | ||||||
|---|---|---|---|---|---|---|---|
| Quadrant | DetID | PixID | Counts | Sigma | Mean | Median | Sigma |
| A | 13 | 248 | 504514 | 3894.8 | 629 | 618 | 129.4 |
| A | 10 | 83 | 499941 | 3859.45 | 629 | 618 | 129.4 |
| A | 6 | 10 | 42370 | 322.72 | 629 | 618 | 129.4 |
| B | 5 | 255 | 239852 | 1924.82 | 633 | 616 | 124.3 |
| B | 0 | 221 | 72665 | 579.68 | 633 | 616 | 124.3 |
| B | 4 | 171 | 47641 | 378.35 | 633 | 616 | 124.3 |
| C | 15 | 214 | 247683 | 1683.08 | 623 | 628 | 146.8 |
| C | 0 | 10 | 30101 | 200.79 | 623 | 628 | 146.8 |
| C | 12 | 249 | 7608 | 47.55 | 623 | 628 | 146.8 |
| D | 12 | 227 | 571537 | 3775.59 | 611 | 594 | 151.2 |
| D | 13 | 249 | 184656 | 1217.19 | 611 | 594 | 151.2 |
| D | 6 | 239 | 86015 | 564.88 | 611 | 594 | 151.2 |
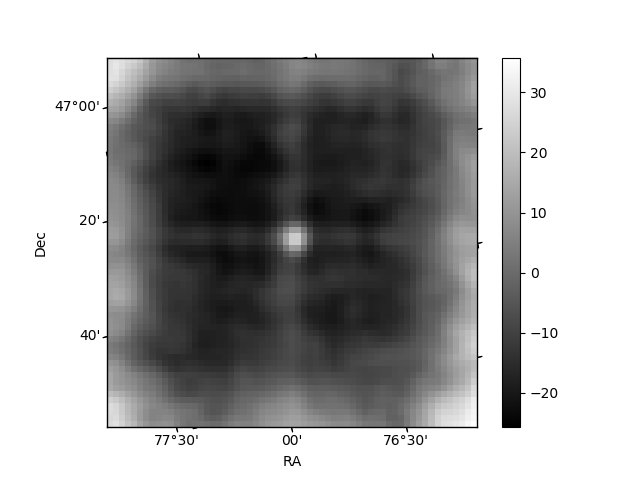
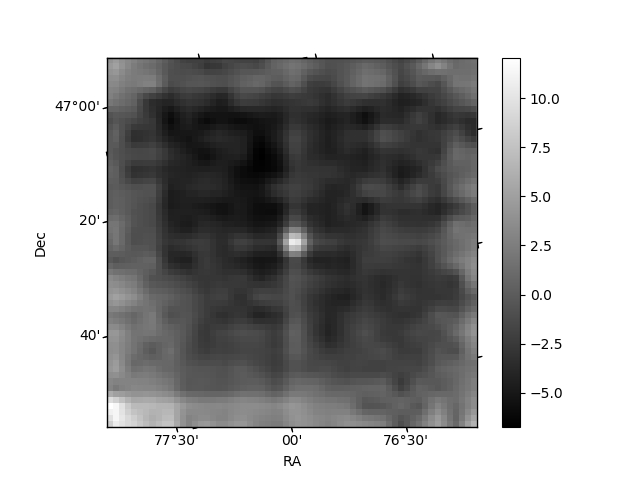
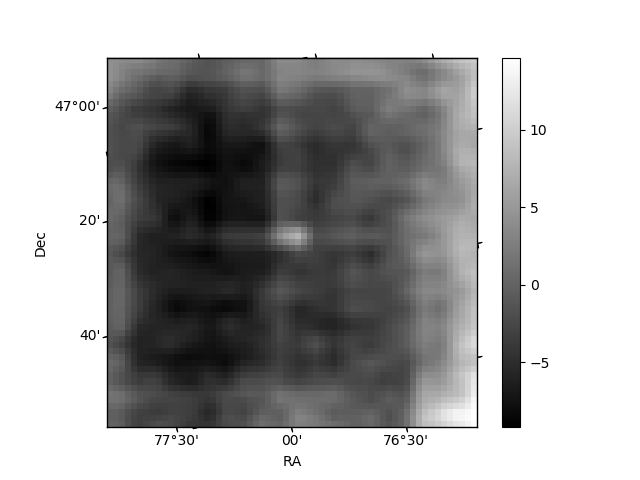
Histogram calculated using DETX and DETY for each event in the final _common_clean file
| Quadrant A | 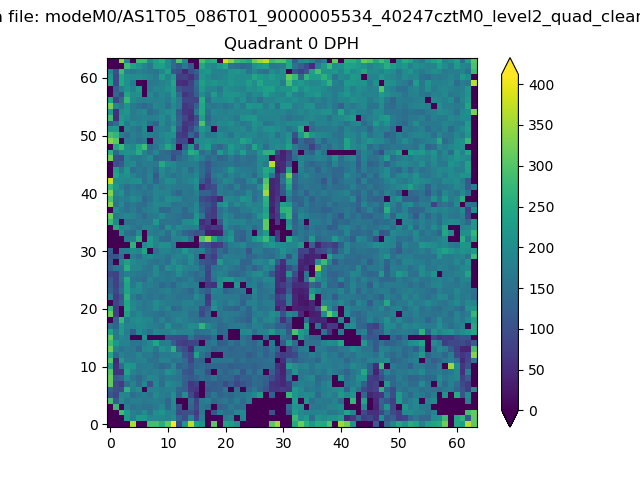 |
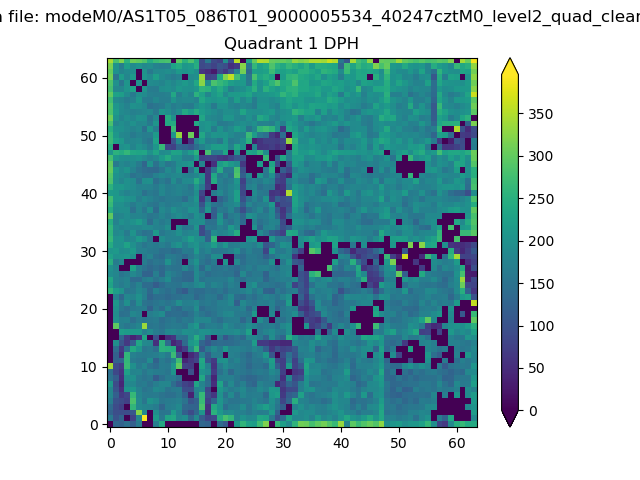 |
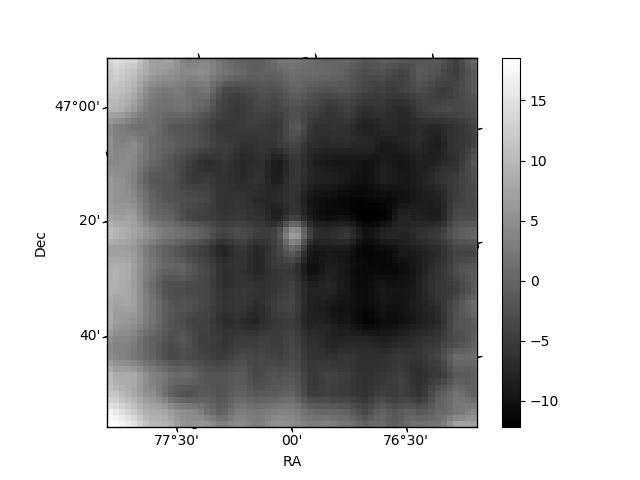
Quadrant B |
|---|---|---|---|
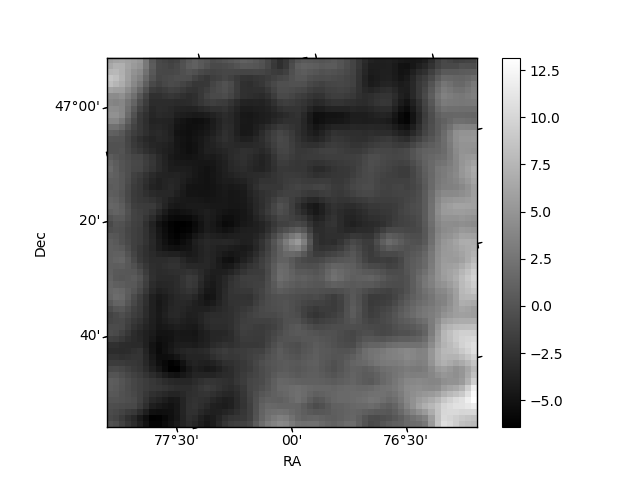
| Quadrant D | 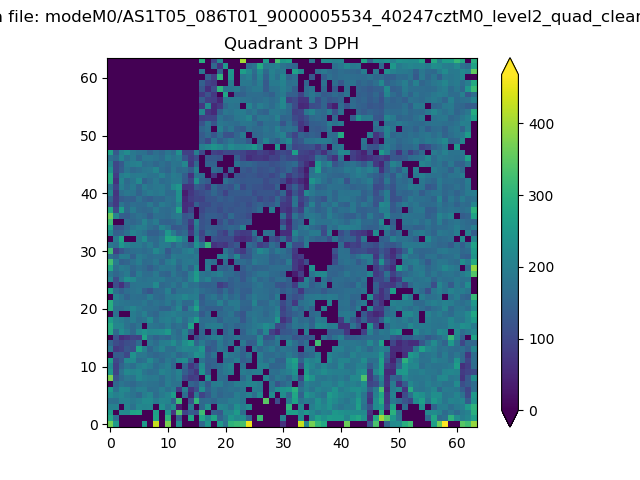 |
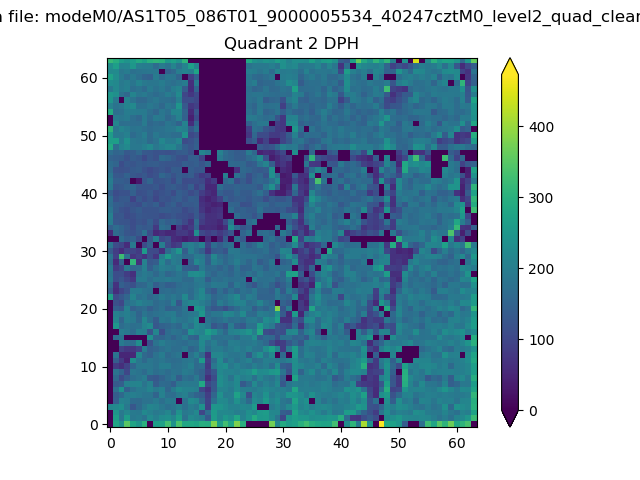 |
Quadrant C |
| Plot type | Count rate plots | Images |
|---|---|---|
| Comparison with Poisson distribution Blue bars denote a histogram of data divided into 1 sec bins. Red curve is a Poisson curve with rate = median count rate of data. |
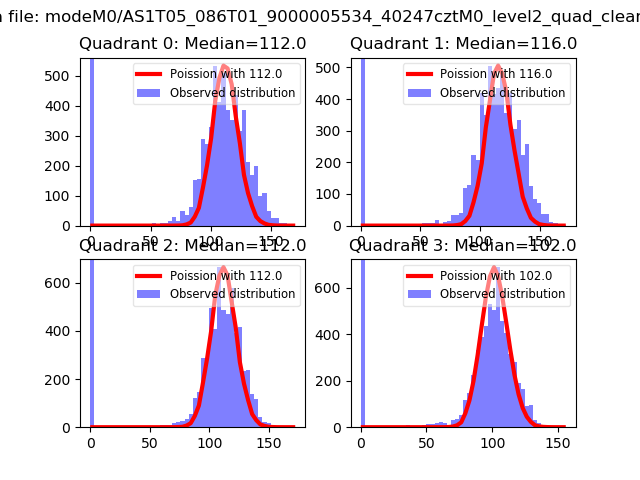 |
 |
| Quadrant-wise count rates Data is divided into 100 sec bins |
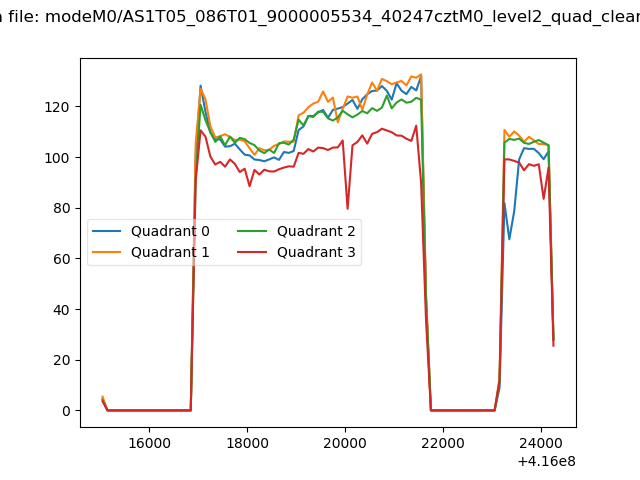 |
|
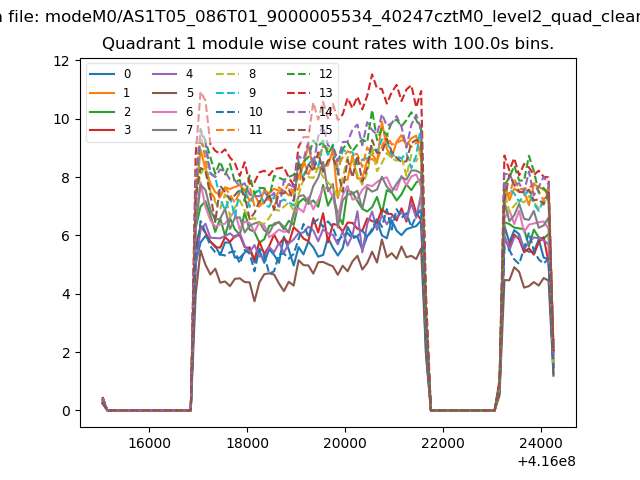
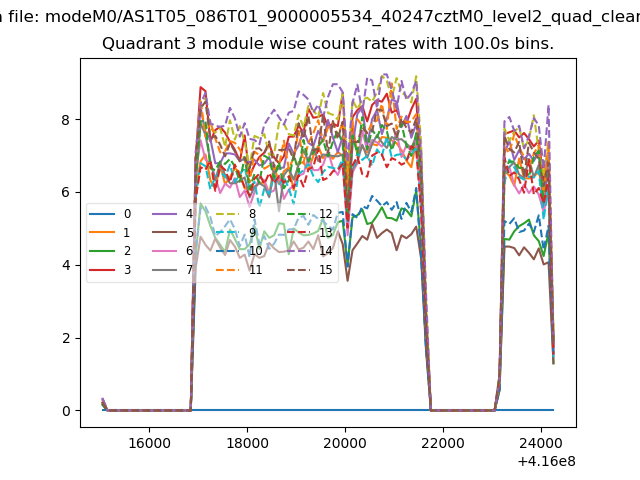
| Module-wise count rates for Quadrant A Data is divided into 100 sec bins |
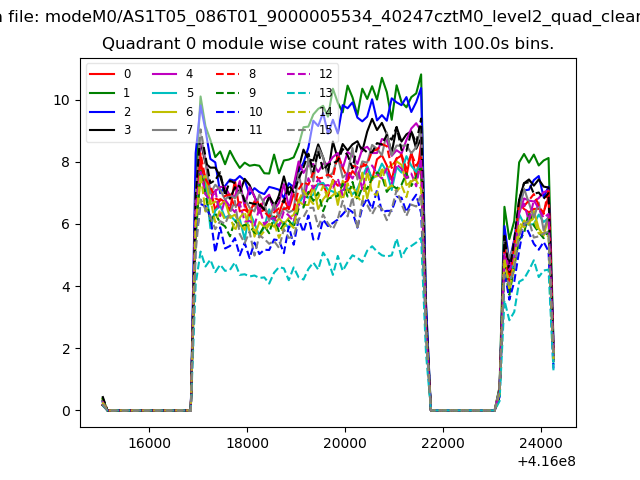 |
 |
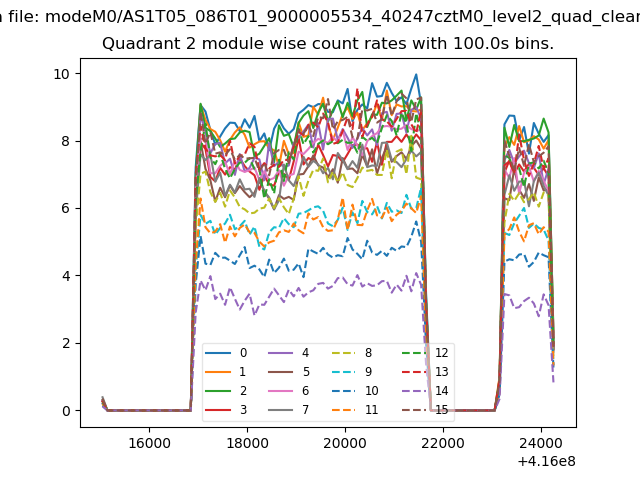
| Module-wise count rates for Quadrant B Data is divided into 100 sec bins |
 |
 |
| Module-wise count rates for Quadrant C Data is divided into 100 sec bins |
 |
 |
| Module-wise count rates for Quadrant D Data is divided into 100 sec bins |
 |
 |
| Parameter | Plot |
|---|---|
| CZT HV Monitor | 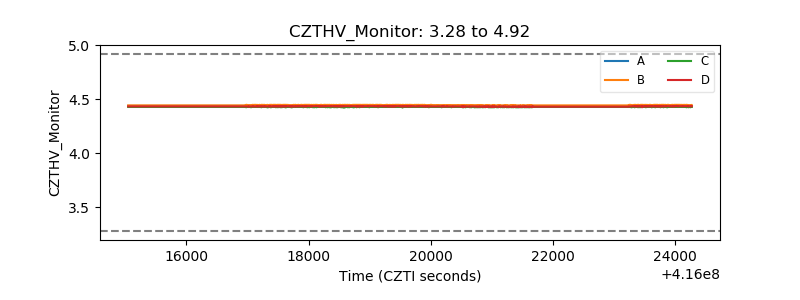 |
| D_VDD | 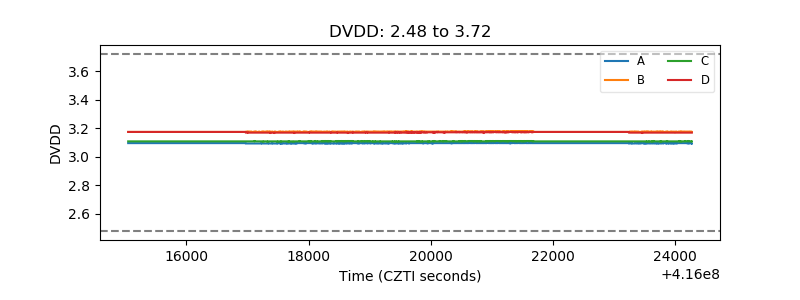 |
| Temperature 1 | 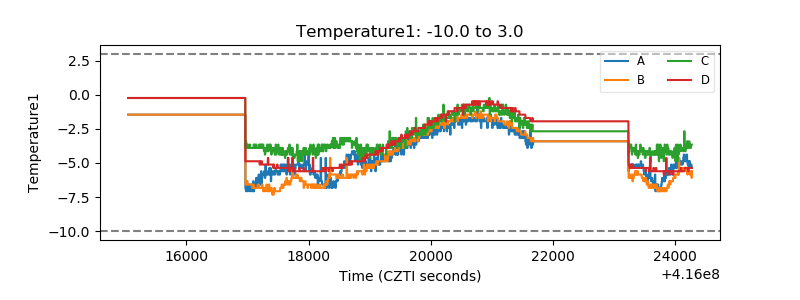 |
| Veto HV Monitor | 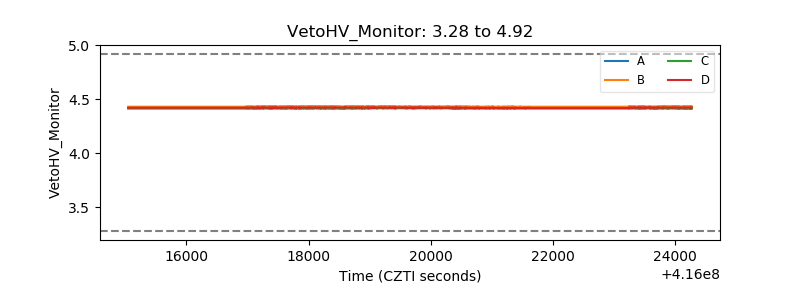 |
| Veto LLD | 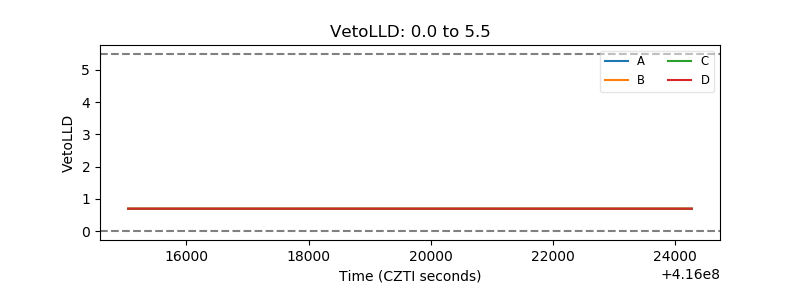 |
| Alpha Counter | 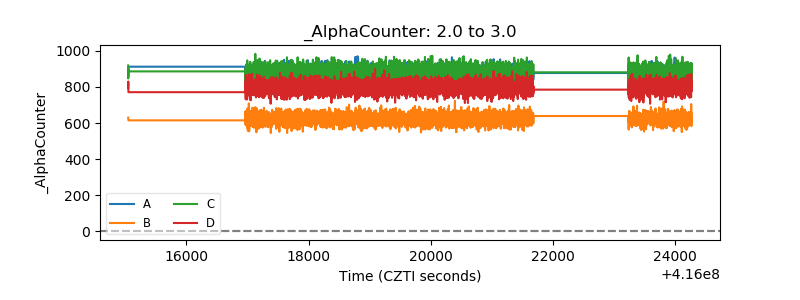 |
| _CPM_Rate | 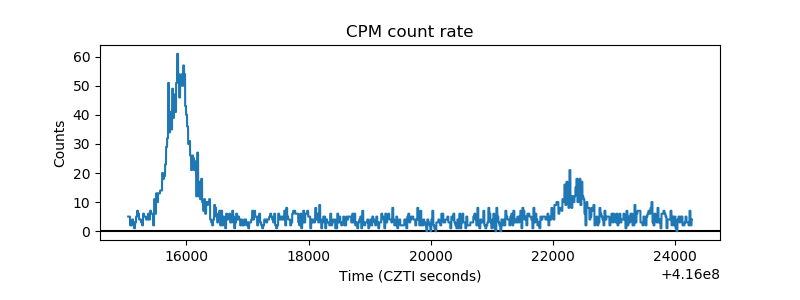 |
| CZT Counter | 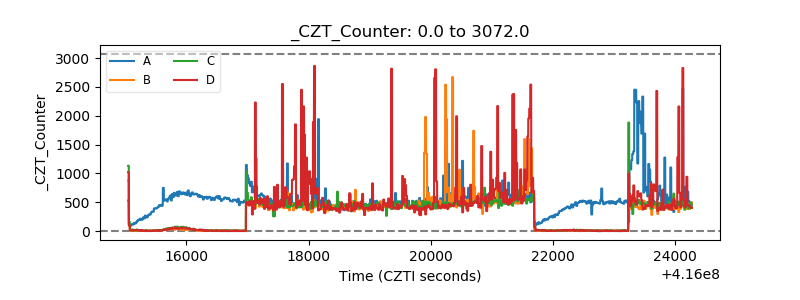 |
| +2.5 Volts monitor | 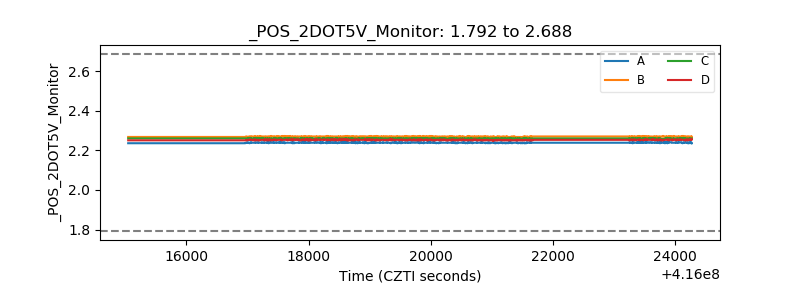 |
| +5 Volts monitor | 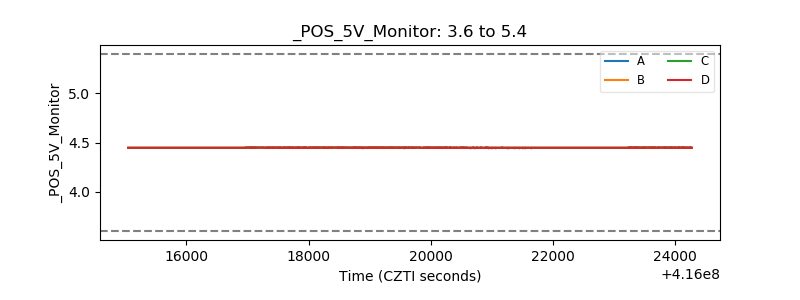 |
| _ROLL_ROT | 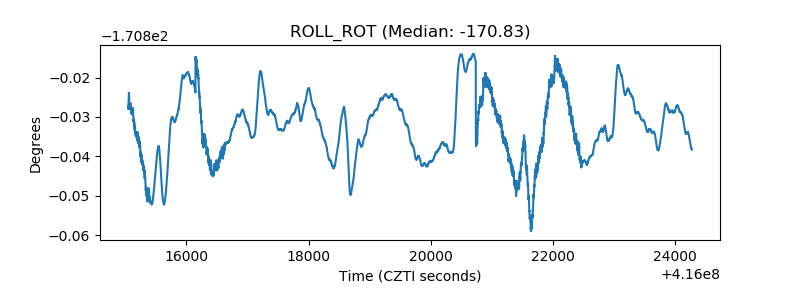 |
| _Roll_DEC | 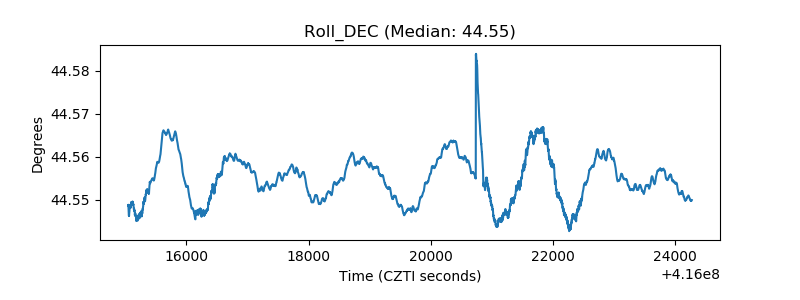 |
| _Roll_RA | 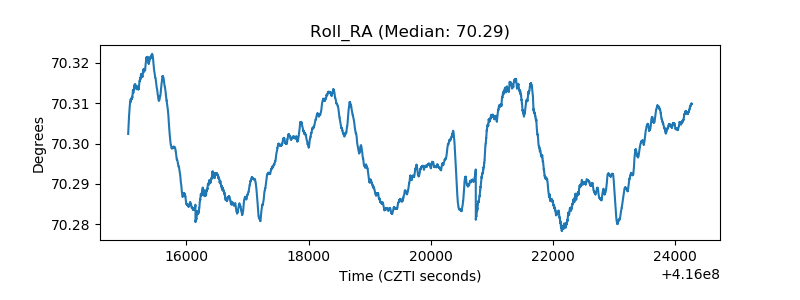 |
| Veto Counter | 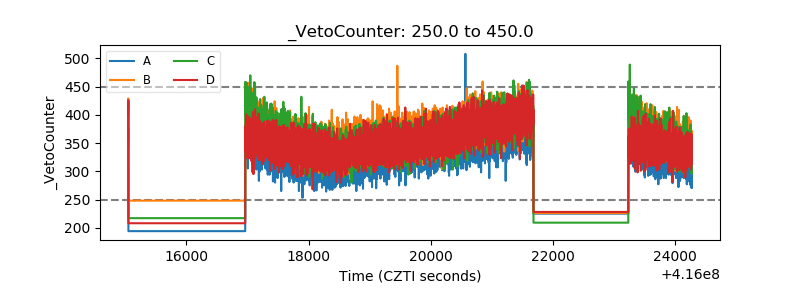 |