| Param | Original file | Final file |
|---|---|---|
| Filename | modeM0/AS1T05_086T01_9000005534_40249cztM0_level2.fits | modeM0/AS1T05_086T01_9000005534_40249cztM0_level2_quad_clean.evt |
| Size (bytes) | 133,416,000 | 39,542,400 |
| Size | 127.2 MB | 37.7 MB |
| Events in quadrant A | 1,299,793 | 258,673 |
| Events in quadrant B | 1,054,952 | 271,443 |
| Events in quadrant C | 1,111,373 | 260,463 |
| Events in quadrant D | 1,282,816 | 234,139 |
| Mode M0 | |||
|---|---|---|---|
| Quadrant | BADHDUFLAG | Total packets | Discarded packets |
| A | 0 | 5345 | 1 |
| B | 0 | 4855 | 1 |
| C | 0 | 4860 | 1 |
| D | 0 | 5606 | 1 |
| Mode M9 | |||
|---|---|---|---|
| Quadrant | BADHDUFLAG | Total packets | Discarded packets |
| A | 0 | 2 | 0 |
| B | 0 | 2 | 0 |
| C | 0 | 2 | 0 |
| D | 0 | 3 | 0 |
| Mode SS | |||
|---|---|---|---|
| Quadrant | BADHDUFLAG | Total packets | Discarded packets |
| A | 0 | 48 | 0 |
| B | 0 | 48 | 0 |
| C | 0 | 48 | 0 |
| D | 0 | 48 | 0 |
| Quadrant | Total seconds | Saturated seconds | Saturation percentage |
|---|---|---|---|
| A | 2403 | 11 | 0.457761% |
| B | 2403 | 3 | 0.124844% |
| C | 2403 | 4 | 0.166459% |
| D | 2403 | 56 | 2.330420% |
Noise dominated data is calculated using 1-second bins in cleaned event files. If a bin has >2000 counts, and if more than 50% of those come from <1% of pixels, then it is considered to be noise-dominated and hence unusable.
| Quadrant | # 1 sec bins | Bins with >0 counts | Bins with >2000 counts | High rate bins dominated by noise | Noise dominated (total time) | Noise dominated (detector-on time) | Marked lightcurve |
|---|---|---|---|---|---|---|---|
| A | 2403 | 2403 | 3 | 3 | 0.12% | 0.12% | 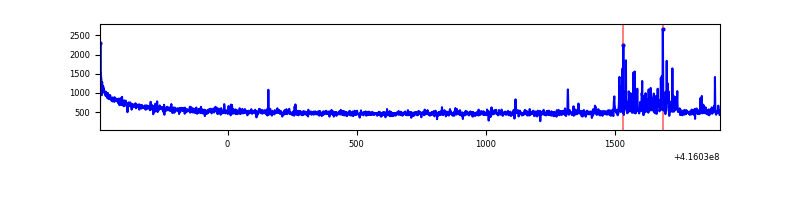 |
| B | 2403 | 2403 | 0 | 0 | 0.00% | 0.00% | 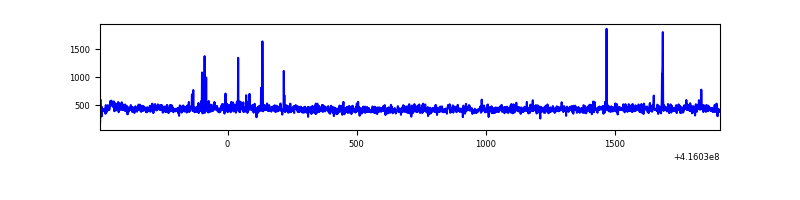 |
| C | 2403 | 2403 | 2 | 2 | 0.08% | 0.08% | 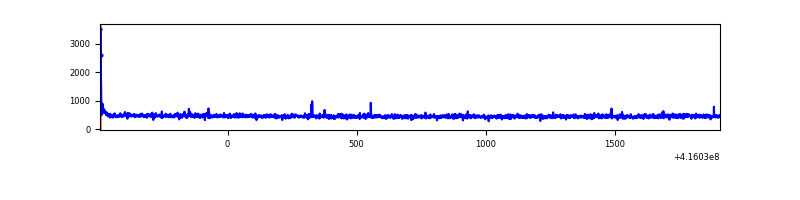 |
| D | 2403 | 2403 | 50 | 50 | 2.08% | 2.08% | 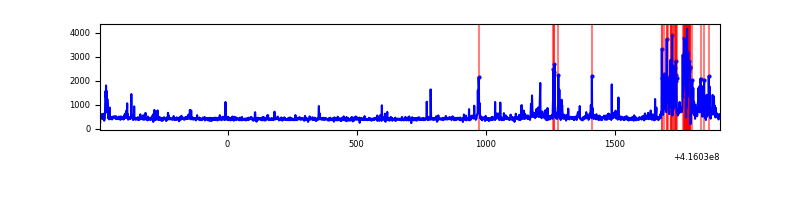 |
Top three noisy pixels from each quadrant. If the there are fewer than three noisy pixels in the level2.evt file, extra rows are filled as -1
| Pixel properties | Quadrant properties | ||||||
|---|---|---|---|---|---|---|---|
| Quadrant | DetID | PixID | Counts | Sigma | Mean | Median | Sigma |
| A | 10 | 83 | 212334 | 3868.83 | 259 | 254 | 54.8 |
| A | 13 | 248 | 69026 | 1254.56 | 259 | 254 | 54.8 |
| A | 6 | 10 | 6477 | 113.52 | 259 | 254 | 54.8 |
| B | 5 | 255 | 21610 | 406.42 | 260 | 253 | 52.5 |
| B | 12 | 111 | 6408 | 117.13 | 260 | 253 | 52.5 |
| B | 11 | 111 | 6206 | 113.28 | 260 | 253 | 52.5 |
| C | 15 | 214 | 104903 | 1722.77 | 252 | 253 | 60.7 |
| C | 0 | 10 | 12110 | 195.19 | 252 | 253 | 60.7 |
| C | 14 | 254 | 6640 | 105.14 | 252 | 253 | 60.7 |
| D | 12 | 227 | 267924 | 4247.93 | 248 | 240 | 63.0 |
| D | 9 | 19 | 15309 | 239.13 | 248 | 240 | 63.0 |
| D | 2 | 233 | 11387 | 176.89 | 248 | 240 | 63.0 |
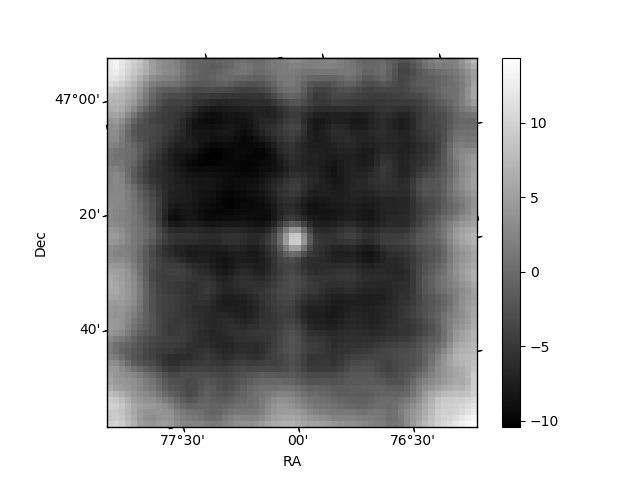
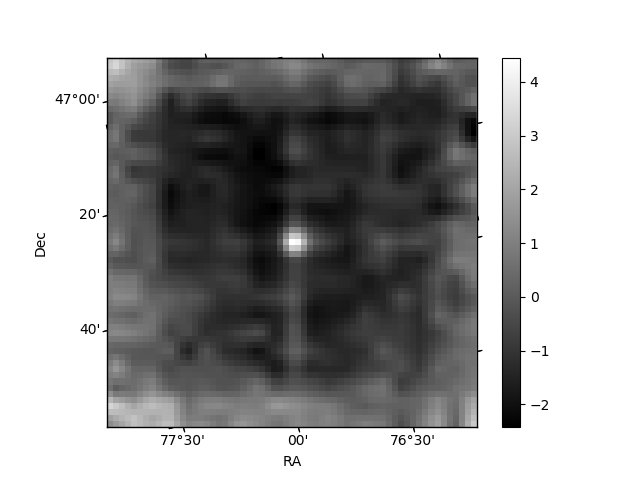
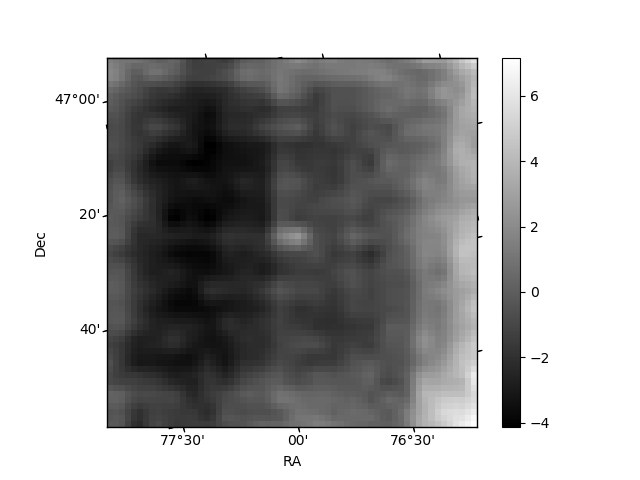
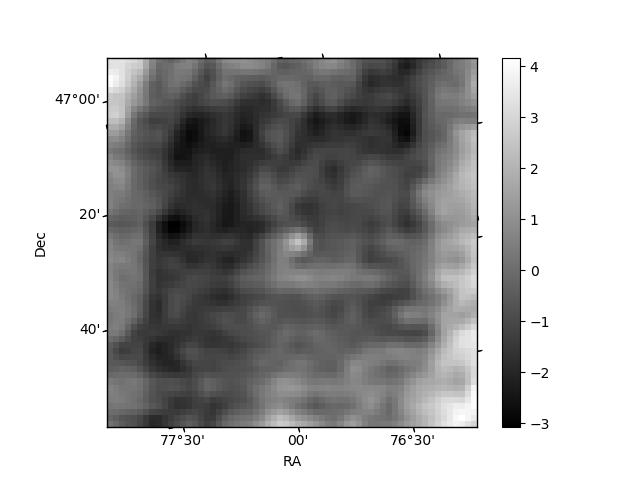
Histogram calculated using DETX and DETY for each event in the final _common_clean file
| Quadrant A | 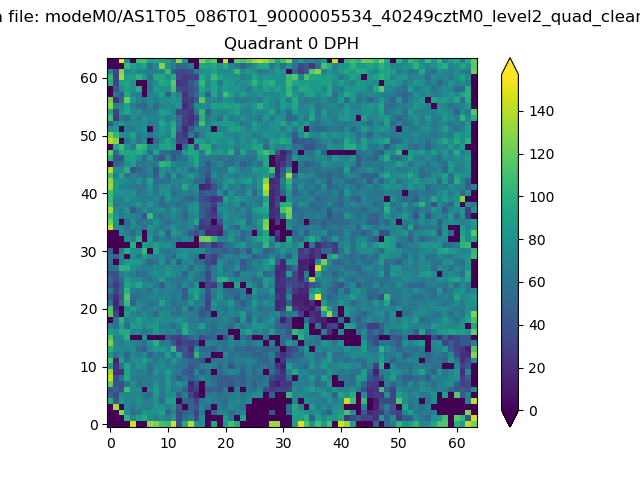 |
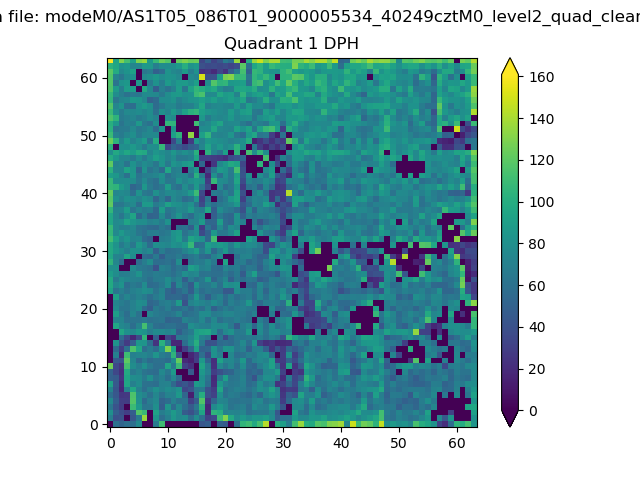 |
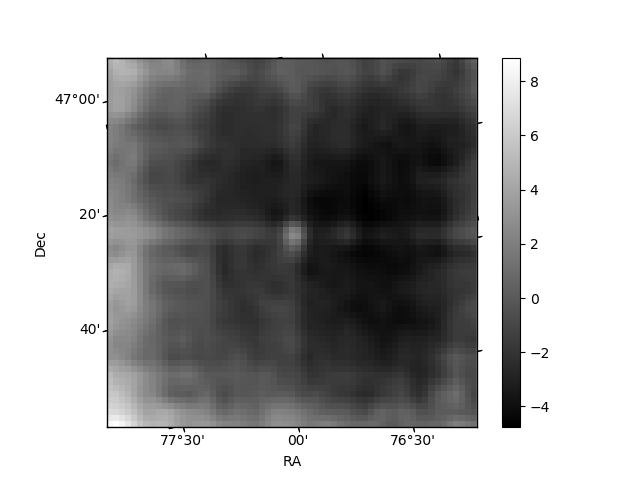
Quadrant B |
|---|---|---|---|
| Quadrant D | 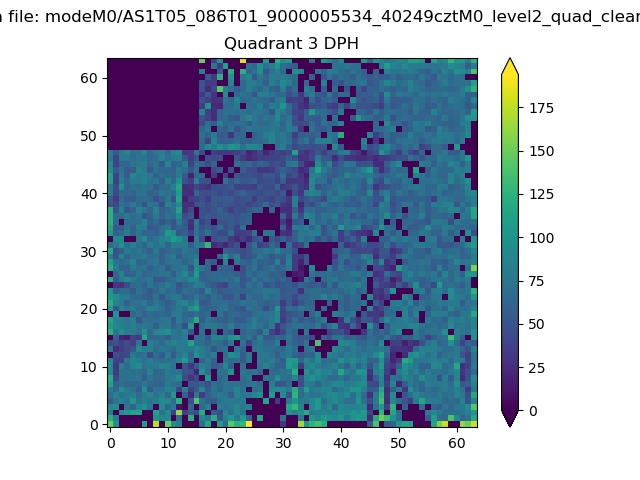 |
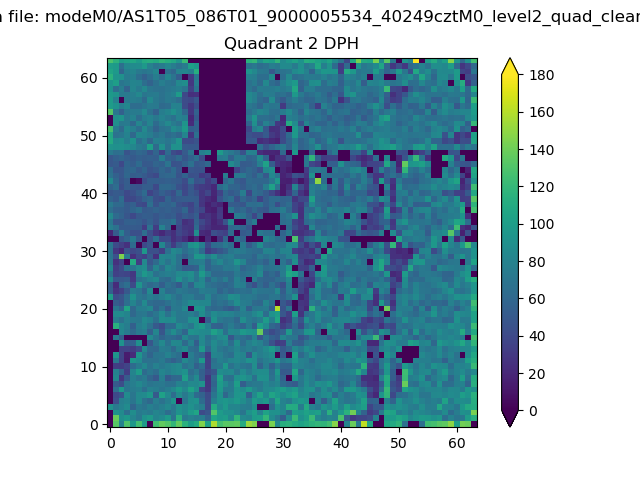 |
Quadrant C |
| Plot type | Count rate plots | Images |
|---|---|---|
| Comparison with Poisson distribution Blue bars denote a histogram of data divided into 1 sec bins. Red curve is a Poisson curve with rate = median count rate of data. |
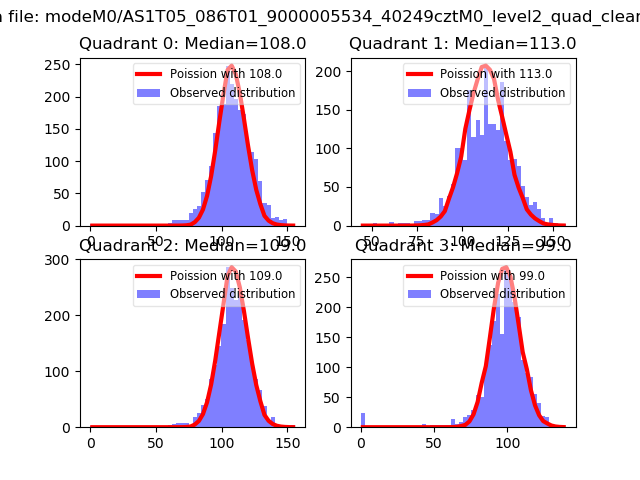 |
 |
| Quadrant-wise count rates Data is divided into 100 sec bins |
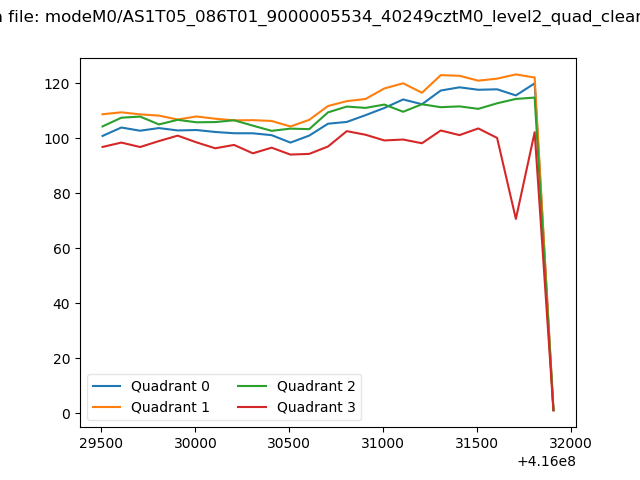 |
|
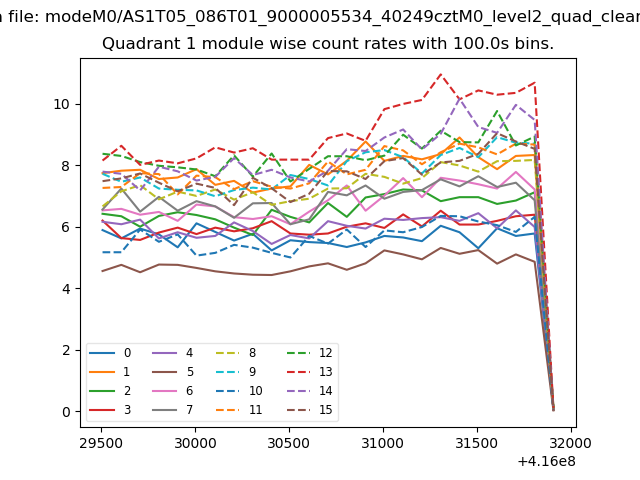
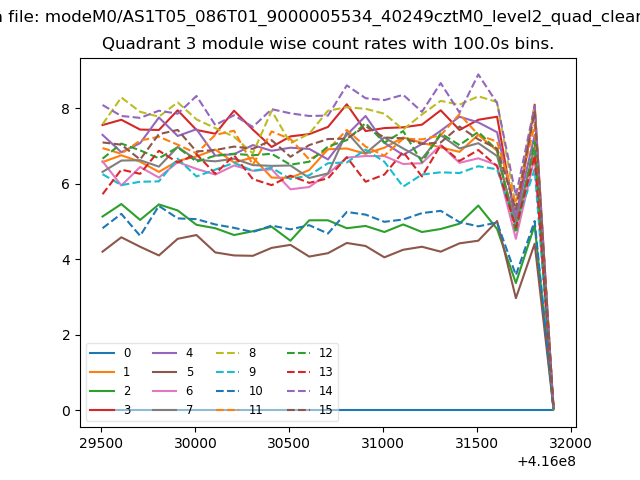
| Module-wise count rates for Quadrant A Data is divided into 100 sec bins |
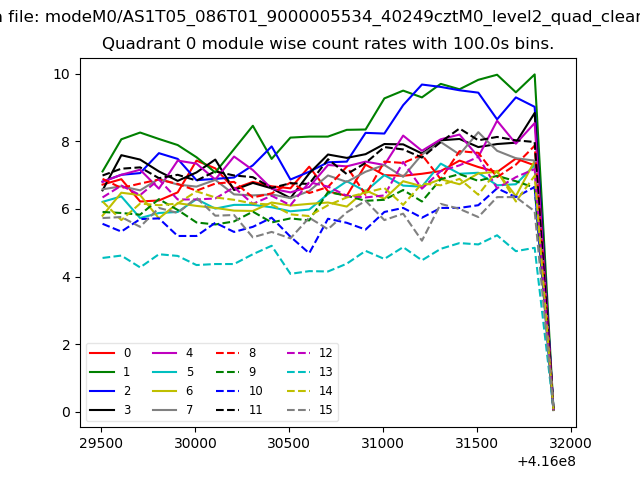 |
 |
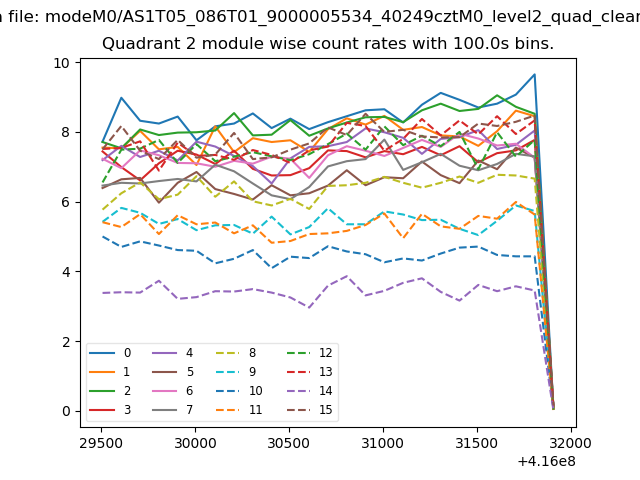
| Module-wise count rates for Quadrant B Data is divided into 100 sec bins |
 |
 |
| Module-wise count rates for Quadrant C Data is divided into 100 sec bins |
 |
 |
| Module-wise count rates for Quadrant D Data is divided into 100 sec bins |
 |
 |
| Parameter | Plot |
|---|---|
| CZT HV Monitor | 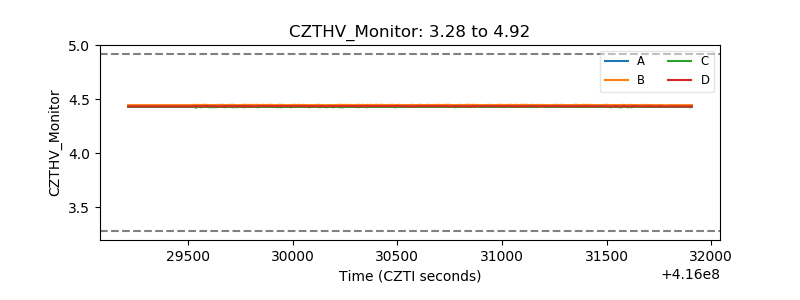 |
| D_VDD | 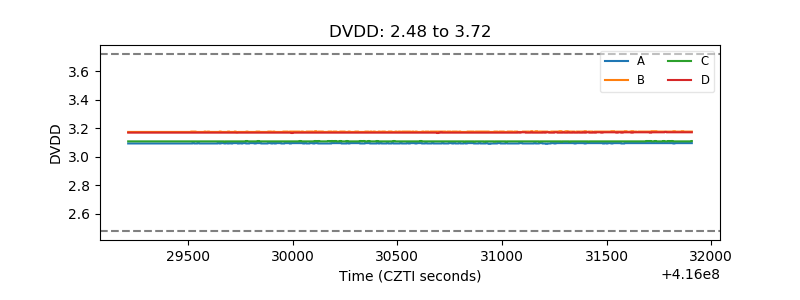 |
| Temperature 1 | 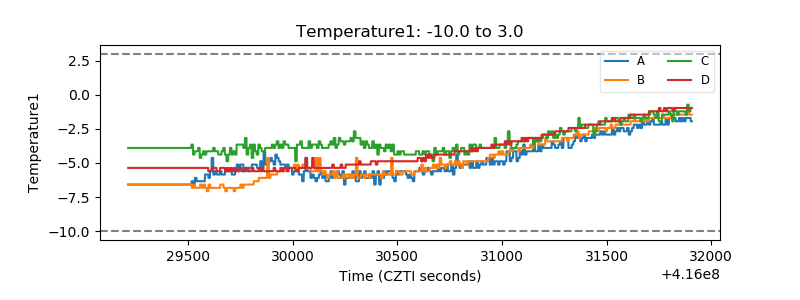 |
| Veto HV Monitor | 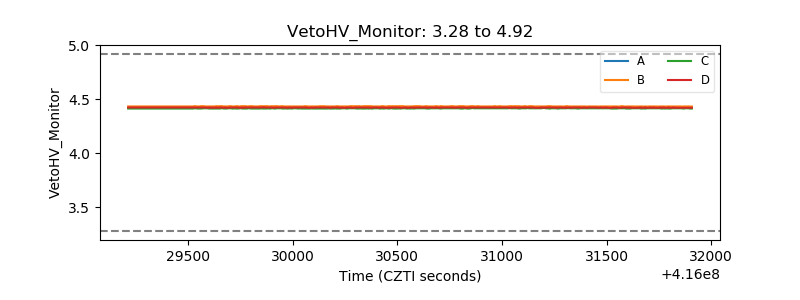 |
| Veto LLD | 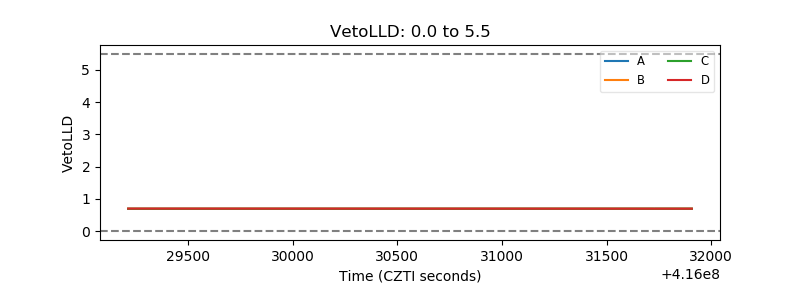 |
| Alpha Counter | 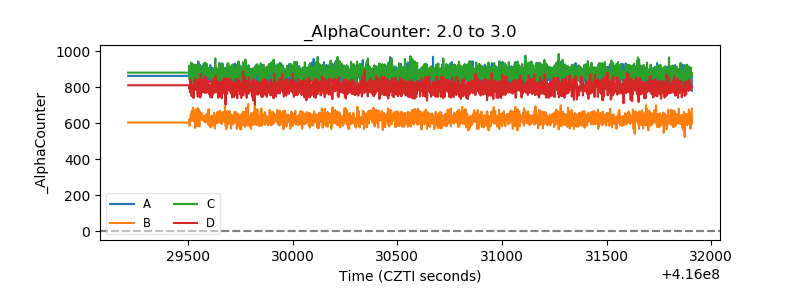 |
| _CPM_Rate | 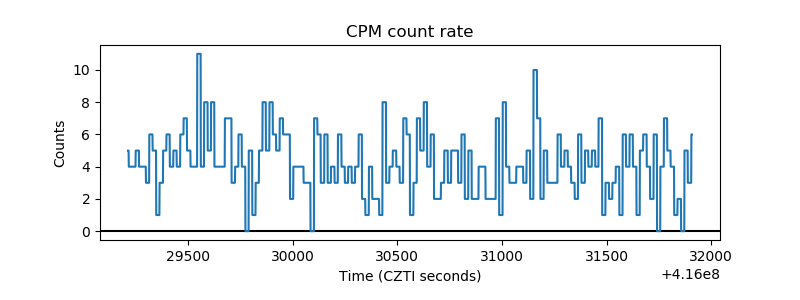 |
| CZT Counter | 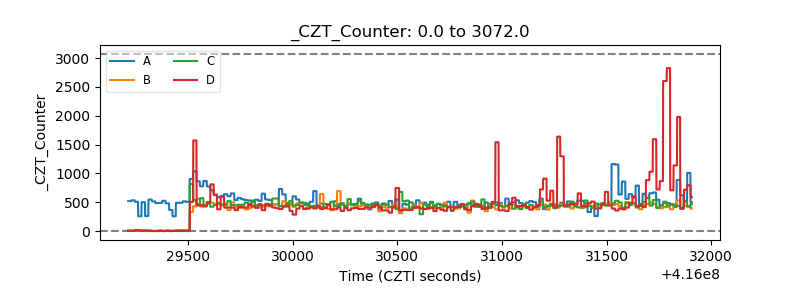 |
| +2.5 Volts monitor | 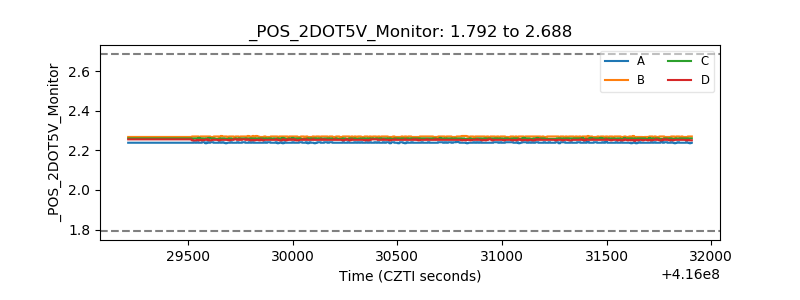 |
| +5 Volts monitor | 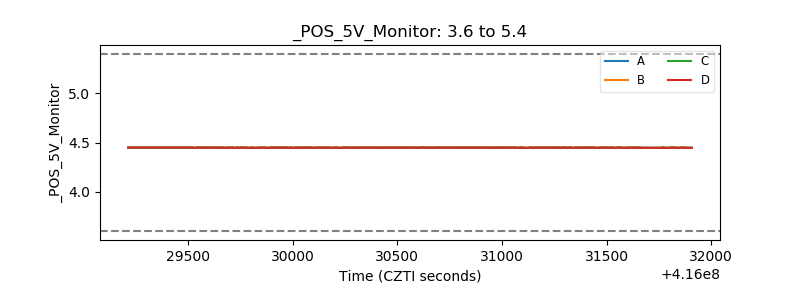 |
| _ROLL_ROT | 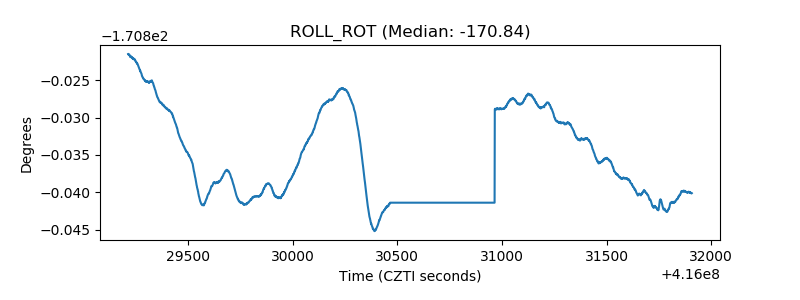 |
| _Roll_DEC | 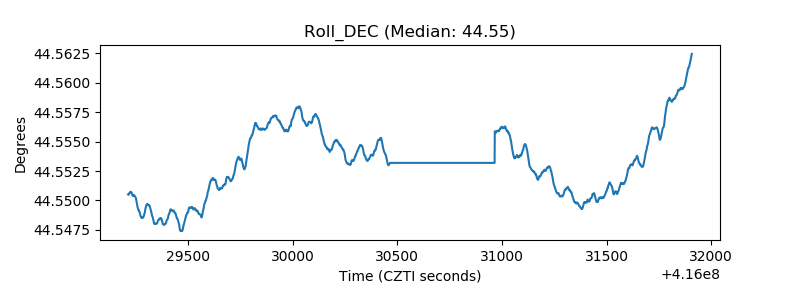 |
| _Roll_RA | 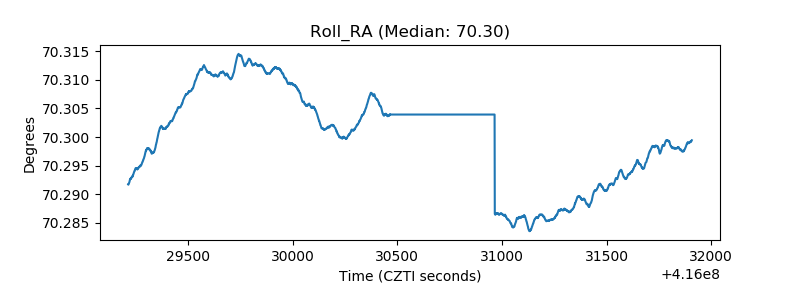 |
| Veto Counter | 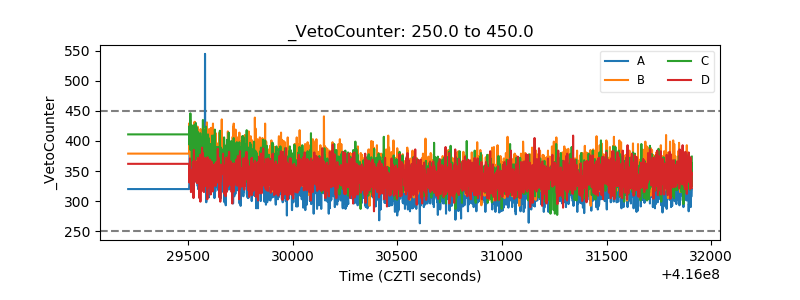 |