| Param | Original file | Final file |
|---|---|---|
| Filename | modeM0/AS1A12_022T01_9000005536_40249cztM0_level2.fits | modeM0/AS1A12_022T01_9000005536_40249cztM0_level2_quad_clean.evt |
| Size (bytes) | 165,640,320 | 43,816,320 |
| Size | 158.0 MB | 41.8 MB |
| Events in quadrant A | 1,757,947 | 285,701 |
| Events in quadrant B | 1,236,233 | 300,252 |
| Events in quadrant C | 1,342,141 | 289,868 |
| Events in quadrant D | 1,587,457 | 261,444 |
| Mode SS | |||
|---|---|---|---|
| Quadrant | BADHDUFLAG | Total packets | Discarded packets |
| A | 0 | 56 | 0 |
| B | 0 | 56 | 0 |
| C | 0 | 56 | 0 |
| D | 0 | 56 | 0 |
| Mode M0 | |||
|---|---|---|---|
| Quadrant | BADHDUFLAG | Total packets | Discarded packets |
| A | 0 | 6762 | 2 |
| B | 0 | 5386 | 1 |
| C | 0 | 5523 | 1 |
| D | 0 | 6534 | 1 |
| Mode M9 | |||
|---|---|---|---|
| Quadrant | BADHDUFLAG | Total packets | Discarded packets |
| A | 0 | 13 | 0 |
| B | 0 | 13 | 0 |
| C | 0 | 13 | 0 |
| D | 0 | 13 | 0 |
| Quadrant | Total seconds | Saturated seconds | Saturation percentage |
|---|---|---|---|
| A | 2641 | 82 | 3.104885% |
| B | 2641 | 5 | 0.189322% |
| C | 2641 | 8 | 0.302916% |
| D | 2641 | 71 | 2.688376% |
Noise dominated data is calculated using 1-second bins in cleaned event files. If a bin has >2000 counts, and if more than 50% of those come from <1% of pixels, then it is considered to be noise-dominated and hence unusable.
| Quadrant | # 1 sec bins | Bins with >0 counts | Bins with >2000 counts | High rate bins dominated by noise | Noise dominated (total time) | Noise dominated (detector-on time) | Marked lightcurve |
|---|---|---|---|---|---|---|---|
| A | 3954 | 2642 | 47 | 47 | 1.19% | 1.78% | 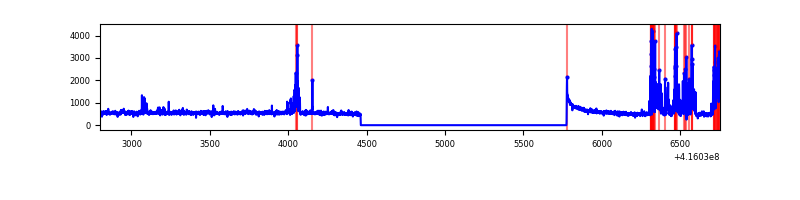 |
| B | 3954 | 2642 | 1 | 1 | 0.03% | 0.04% | 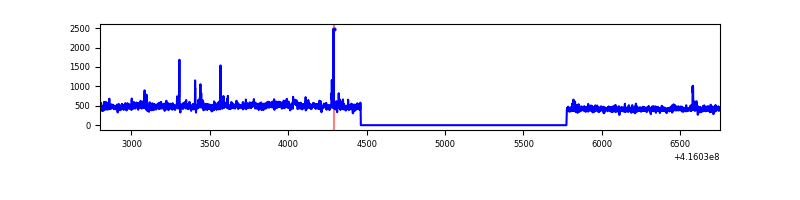 |
| C | 3954 | 2642 | 8 | 8 | 0.20% | 0.30% | 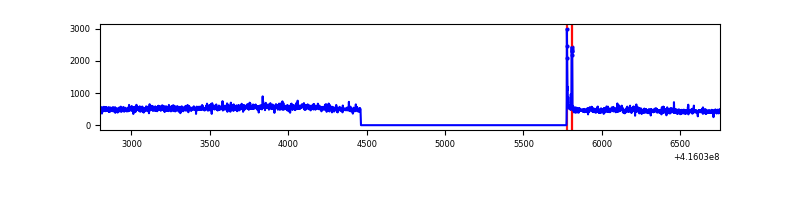 |
| D | 3954 | 2642 | 55 | 55 | 1.39% | 2.08% | 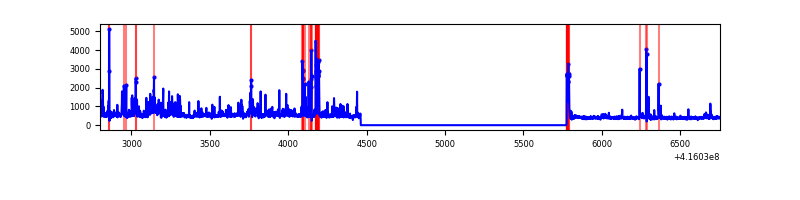 |
Top three noisy pixels from each quadrant. If the there are fewer than three noisy pixels in the level2.evt file, extra rows are filled as -1
| Pixel properties | Quadrant properties | ||||||
|---|---|---|---|---|---|---|---|
| Quadrant | DetID | PixID | Counts | Sigma | Mean | Median | Sigma |
| A | 13 | 248 | 335602 | 5287.49 | 295 | 289 | 63.4 |
| A | 10 | 83 | 251332 | 3958.65 | 295 | 289 | 63.4 |
| A | 2 | 79 | 8738 | 133.23 | 295 | 289 | 63.4 |
| B | 5 | 255 | 17570 | 284.2 | 302 | 293 | 60.8 |
| B | 0 | 230 | 9057 | 144.17 | 302 | 293 | 60.8 |
| B | 5 | 32 | 8424 | 133.75 | 302 | 293 | 60.8 |
| C | 15 | 214 | 114107 | 1592.56 | 297 | 298 | 71.5 |
| C | 9 | 54 | 26863 | 371.73 | 297 | 298 | 71.5 |
| C | 9 | 187 | 15716 | 215.75 | 297 | 298 | 71.5 |
| D | 12 | 217 | 105029 | 1451.8 | 291 | 283 | 72.1 |
| D | 12 | 227 | 97194 | 1343.2 | 291 | 283 | 72.1 |
| D | 9 | 19 | 78937 | 1090.16 | 291 | 283 | 72.1 |
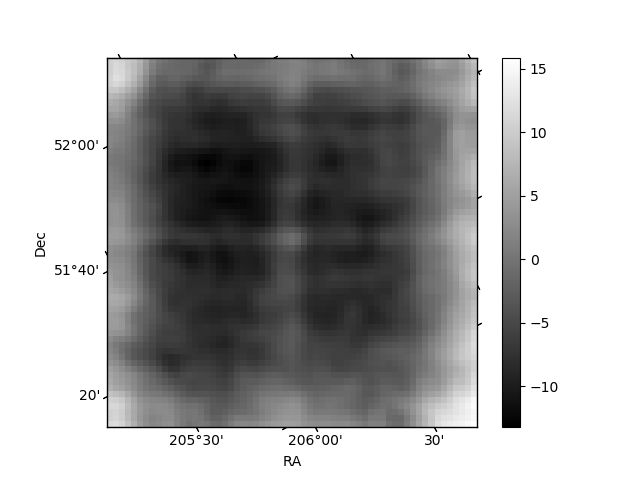
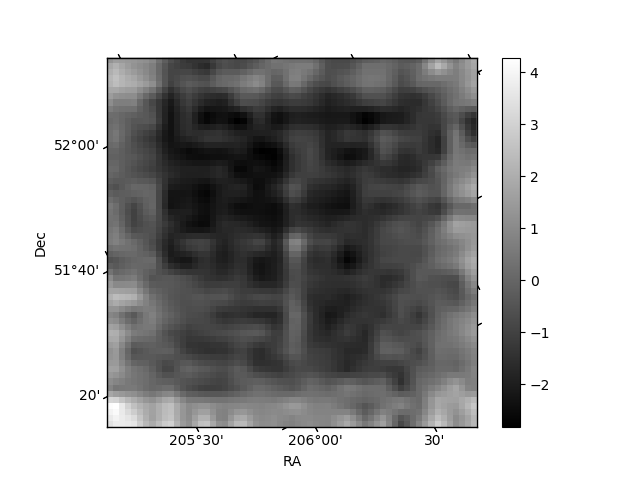
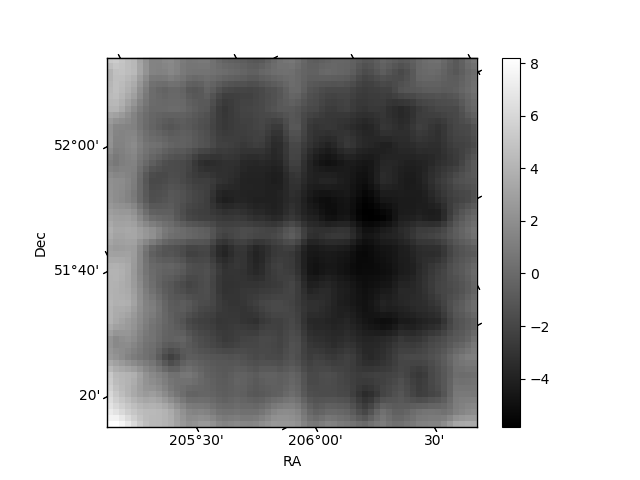
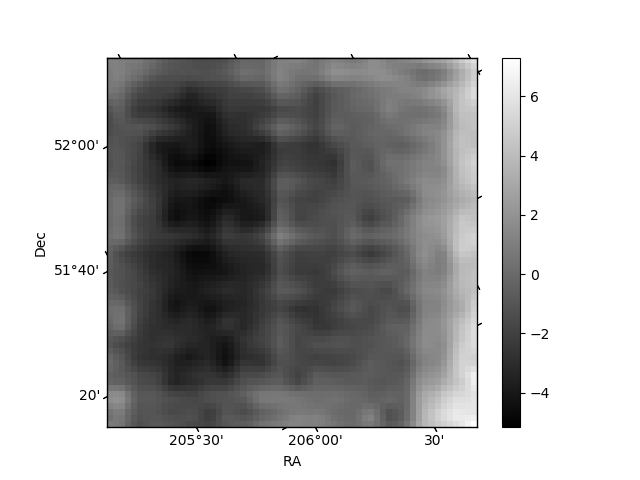
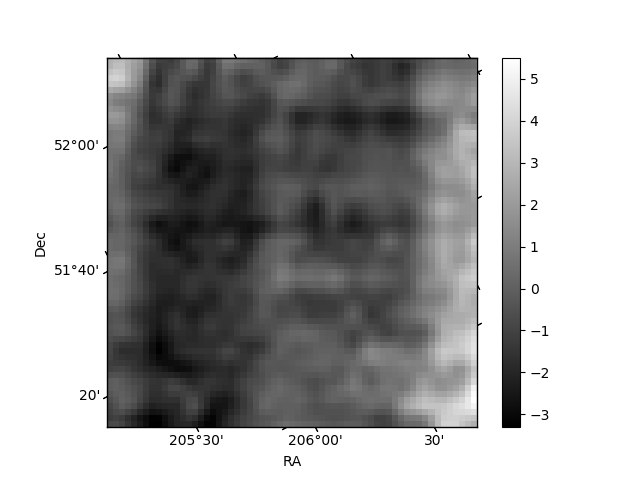
Histogram calculated using DETX and DETY for each event in the final _common_clean file
| Quadrant A | 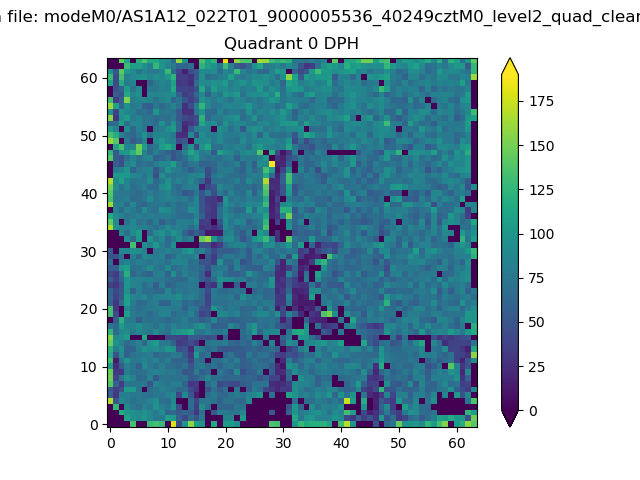 |
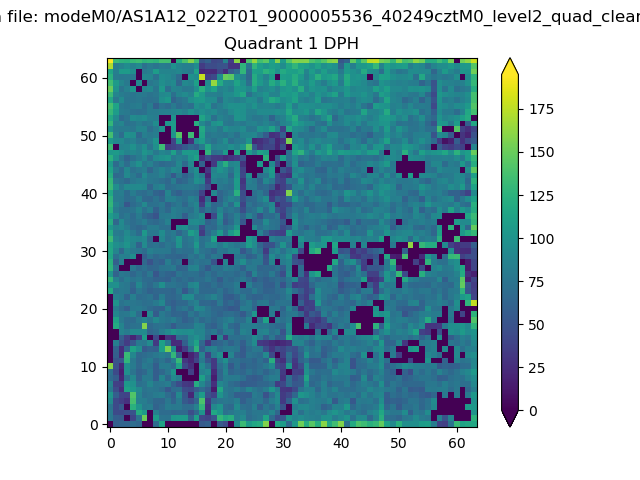 |
Quadrant B |
|---|---|---|---|
| Quadrant D | 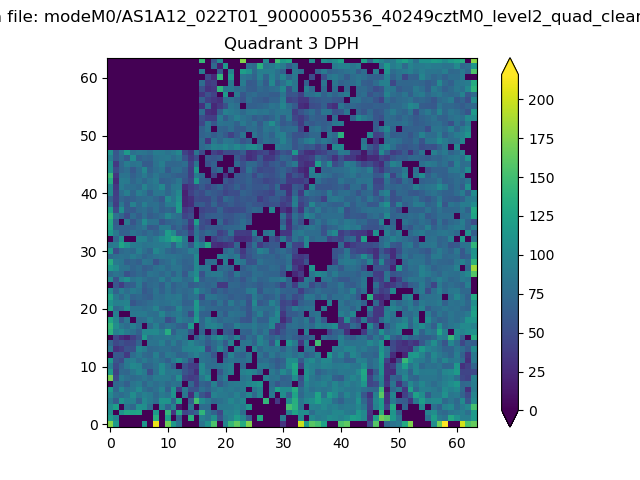 |
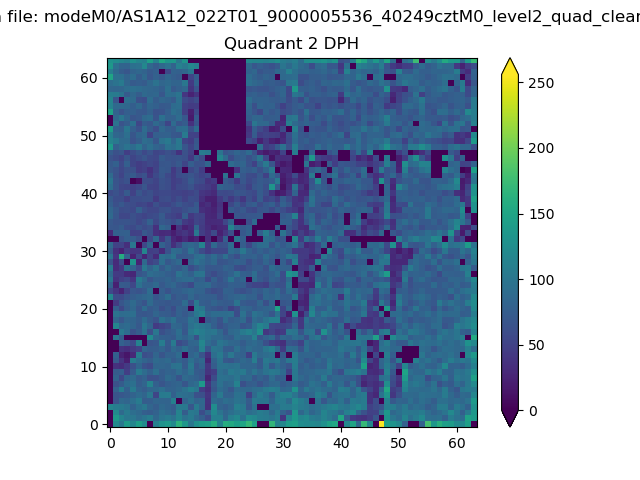 |
Quadrant C |
| Plot type | Count rate plots | Images |
|---|---|---|
| Comparison with Poisson distribution Blue bars denote a histogram of data divided into 1 sec bins. Red curve is a Poisson curve with rate = median count rate of data. |
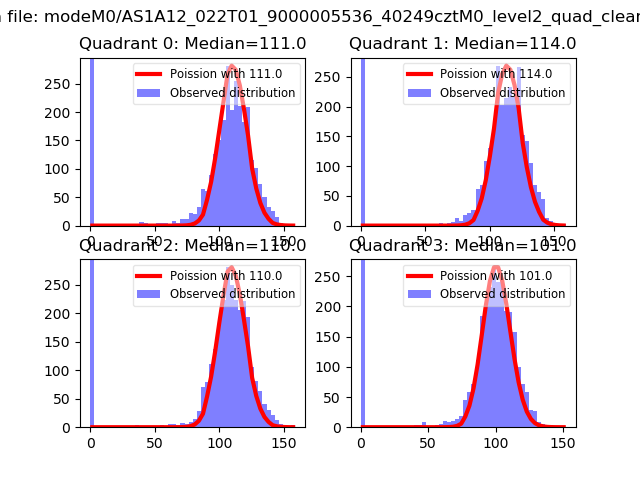 |
 |
| Quadrant-wise count rates Data is divided into 100 sec bins |
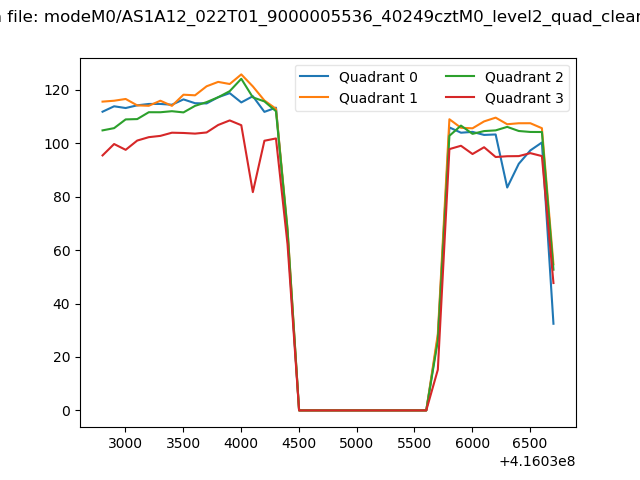 |
|
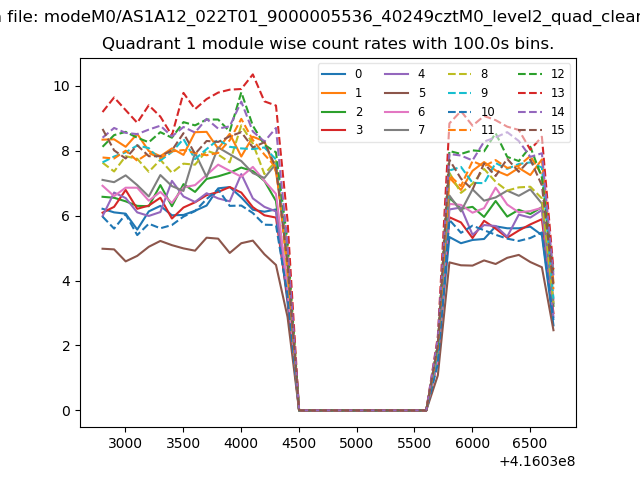
| Module-wise count rates for Quadrant A Data is divided into 100 sec bins |
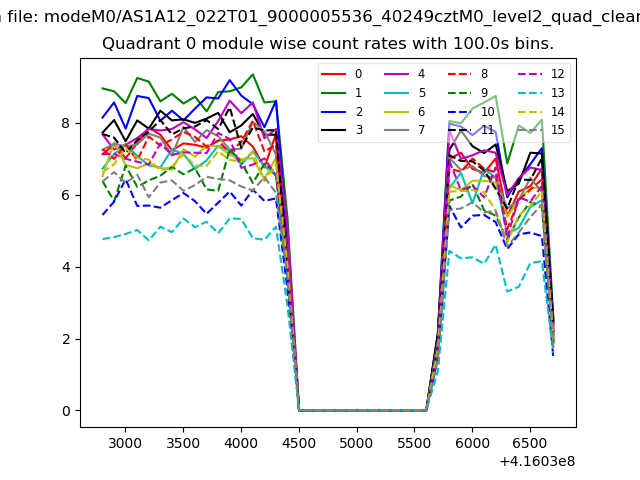 |
 |
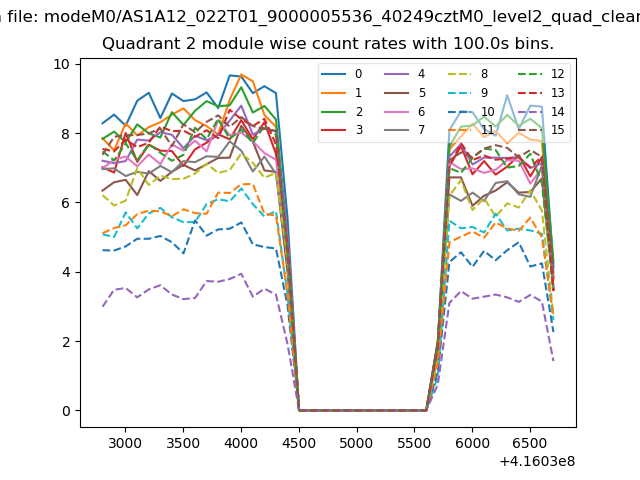
| Module-wise count rates for Quadrant B Data is divided into 100 sec bins |
 |
 |
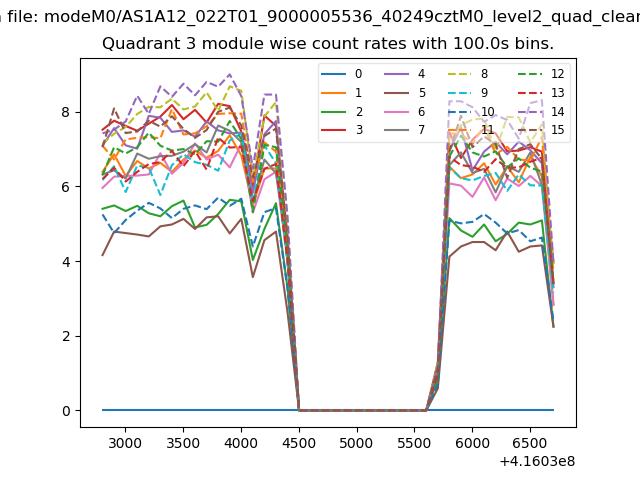
| Module-wise count rates for Quadrant C Data is divided into 100 sec bins |
 |
 |
| Module-wise count rates for Quadrant D Data is divided into 100 sec bins |
 |
 |
| Parameter | Plot |
|---|---|
| CZT HV Monitor | 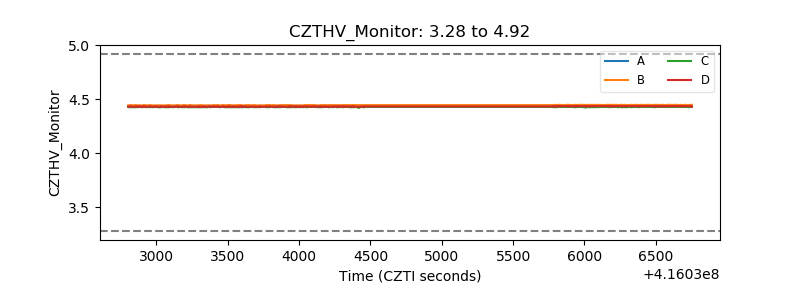 |
| D_VDD | 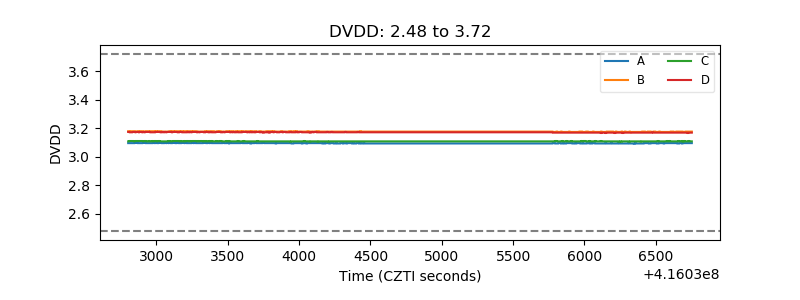 |
| Temperature 1 | 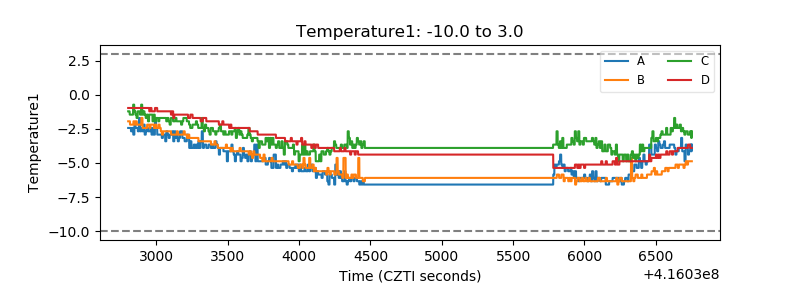 |
| Veto HV Monitor | 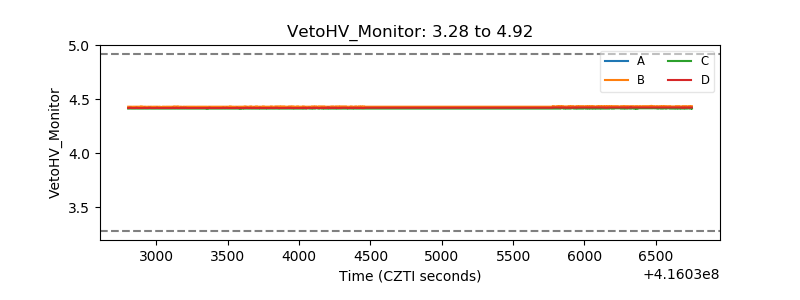 |
| Veto LLD | 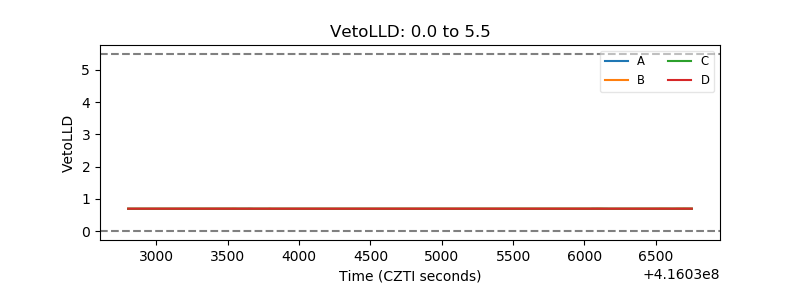 |
| Alpha Counter | 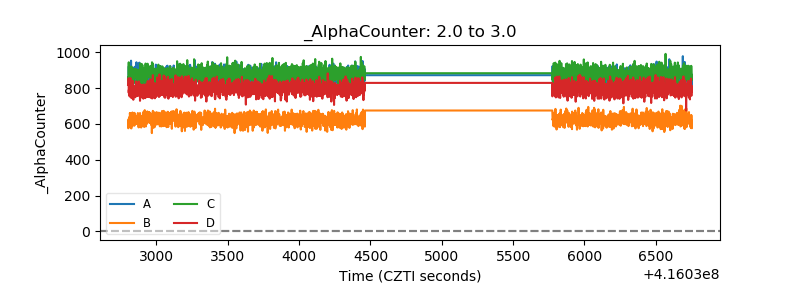 |
| _CPM_Rate | 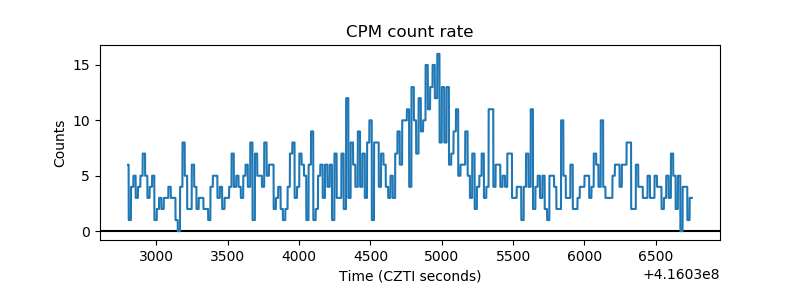 |
| CZT Counter | 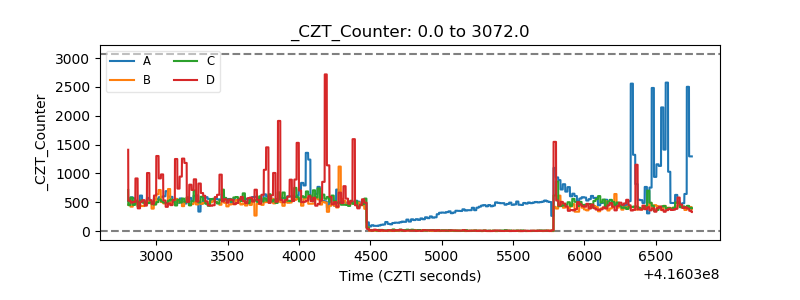 |
| +2.5 Volts monitor | 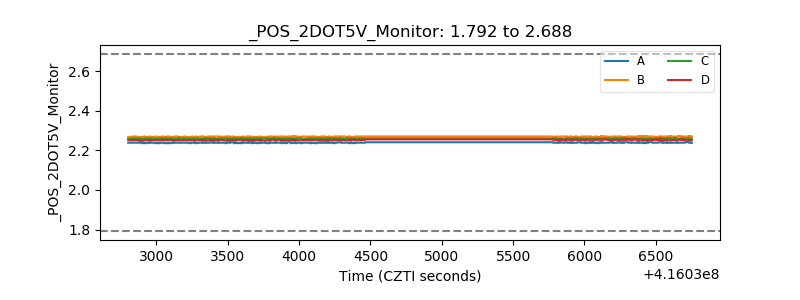 |
| +5 Volts monitor | 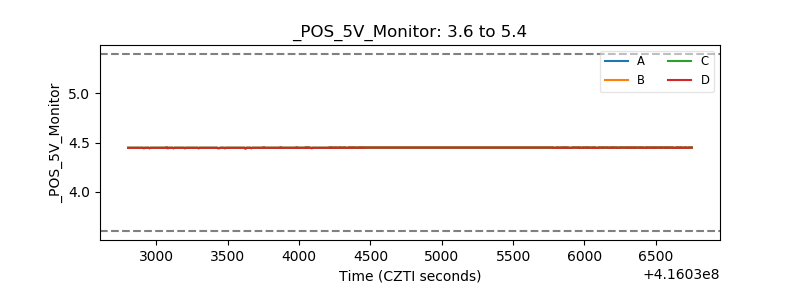 |
| _ROLL_ROT | 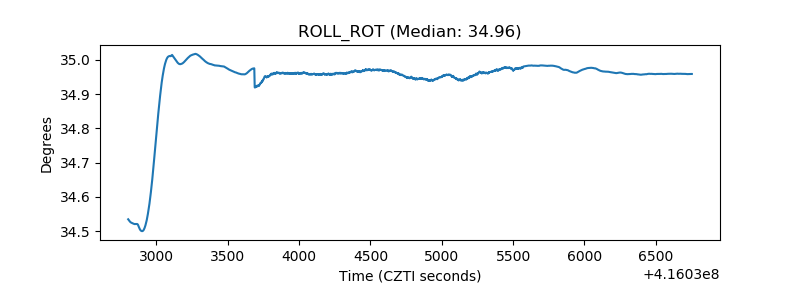 |
| _Roll_DEC | 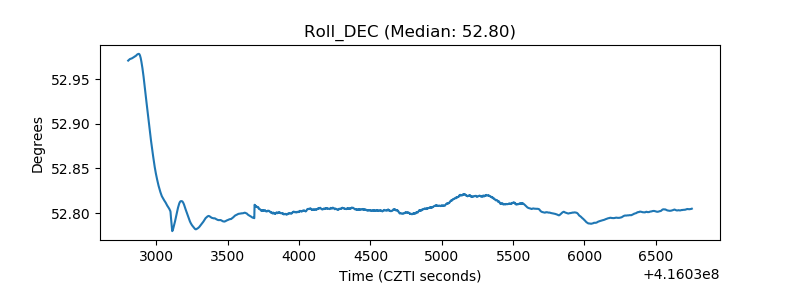 |
| _Roll_RA | 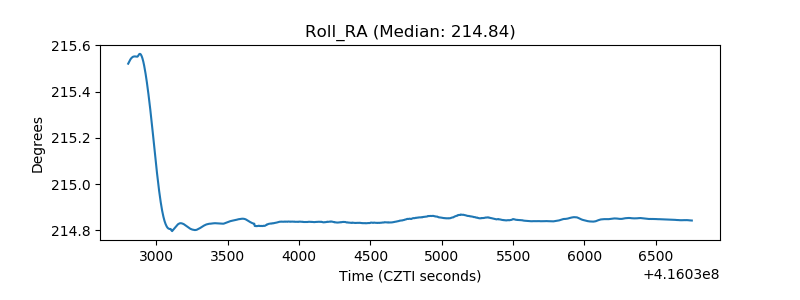 |
| Veto Counter | 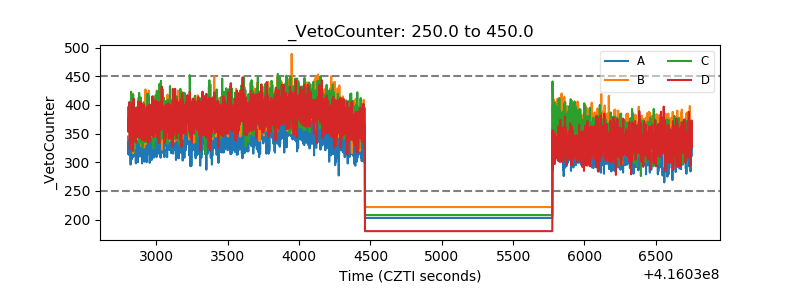 |