| Param | Original file | Final file |
|---|---|---|
| Filename | modeM0/AS1A12_022T01_9000005536_40251cztM0_level2.fits | modeM0/AS1A12_022T01_9000005536_40251cztM0_level2_quad_clean.evt |
| Size (bytes) | 336,888,000 | 75,631,680 |
| Size | 321.3 MB | 72.1 MB |
| Events in quadrant A | 3,473,497 | 494,292 |
| Events in quadrant B | 2,341,802 | 530,366 |
| Events in quadrant C | 2,263,808 | 510,888 |
| Events in quadrant D | 4,016,281 | 416,965 |
| Mode SS | |||
|---|---|---|---|
| Quadrant | BADHDUFLAG | Total packets | Discarded packets |
| A | 0 | 98 | 0 |
| B | 0 | 98 | 0 |
| C | 0 | 98 | 0 |
| D | 0 | 98 | 0 |
| Mode M0 | |||
|---|---|---|---|
| Quadrant | BADHDUFLAG | Total packets | Discarded packets |
| A | 0 | 13096 | 0 |
| B | 0 | 10244 | 0 |
| C | 0 | 9715 | 0 |
| D | 0 | 15409 | 0 |
| Mode M9 | |||
|---|---|---|---|
| Quadrant | BADHDUFLAG | Total packets | Discarded packets |
| A | 0 | 7 | 0 |
| B | 0 | 6 | 0 |
| C | 0 | 6 | 0 |
| D | 0 | 6 | 0 |
| Quadrant | Total seconds | Saturated seconds | Saturation percentage |
|---|---|---|---|
| A | 4808 | 319 | 6.634775% |
| B | 4808 | 63 | 1.310316% |
| C | 4808 | 4 | 0.083195% |
| D | 4808 | 614 | 12.770383% |
Noise dominated data is calculated using 1-second bins in cleaned event files. If a bin has >2000 counts, and if more than 50% of those come from <1% of pixels, then it is considered to be noise-dominated and hence unusable.
| Quadrant | # 1 sec bins | Bins with >0 counts | Bins with >2000 counts | High rate bins dominated by noise | Noise dominated (total time) | Noise dominated (detector-on time) | Marked lightcurve |
|---|---|---|---|---|---|---|---|
| A | 4808 | 4808 | 219 | 219 | 4.55% | 4.55% | 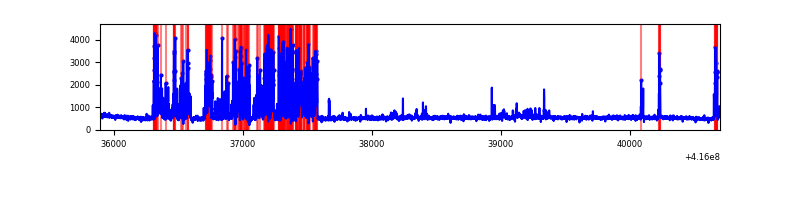 |
| B | 4808 | 4808 | 46 | 46 | 0.96% | 0.96% | 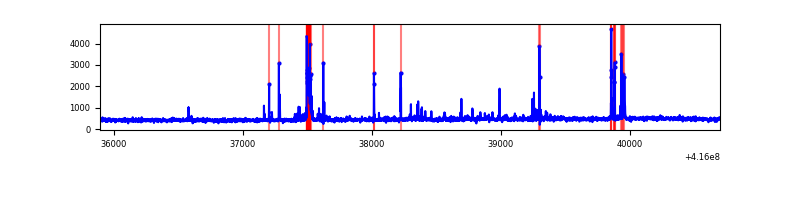 |
| C | 4808 | 4808 | 0 | 0 | 0.00% | 0.00% | 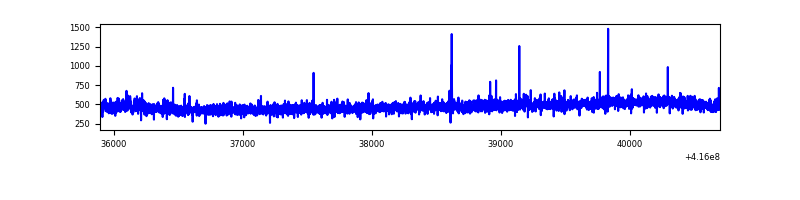 |
| D | 4808 | 4808 | 470 | 470 | 9.78% | 9.78% | 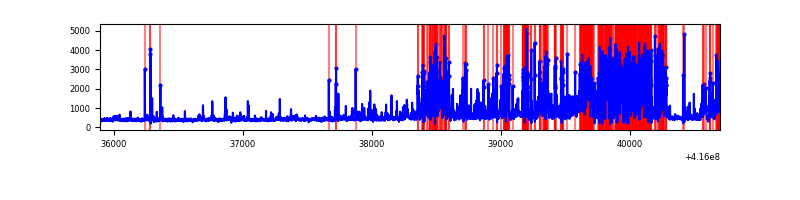 |
Top three noisy pixels from each quadrant. If the there are fewer than three noisy pixels in the level2.evt file, extra rows are filled as -1
| Pixel properties | Quadrant properties | ||||||
|---|---|---|---|---|---|---|---|
| Quadrant | DetID | PixID | Counts | Sigma | Mean | Median | Sigma |
| A | 13 | 248 | 1086529 | 10037.46 | 518 | 506 | 108.2 |
| A | 10 | 83 | 321699 | 2968.59 | 518 | 506 | 108.2 |
| A | 6 | 10 | 46576 | 425.8 | 518 | 506 | 108.2 |
| B | 5 | 255 | 193213 | 1846.61 | 528 | 512 | 104.4 |
| B | 0 | 245 | 33728 | 318.3 | 528 | 512 | 104.4 |
| B | 12 | 111 | 13030 | 119.95 | 528 | 512 | 104.4 |
| C | 15 | 214 | 200338 | 1606.86 | 521 | 524 | 124.4 |
| C | 9 | 54 | 10354 | 79.05 | 521 | 524 | 124.4 |
| C | 9 | 187 | 9411 | 71.47 | 521 | 524 | 124.4 |
| D | 12 | 227 | 1526924 | 12778.17 | 485 | 471 | 119.5 |
| D | 2 | 249 | 193653 | 1617.15 | 485 | 471 | 119.5 |
| D | 12 | 217 | 164605 | 1373.99 | 485 | 471 | 119.5 |
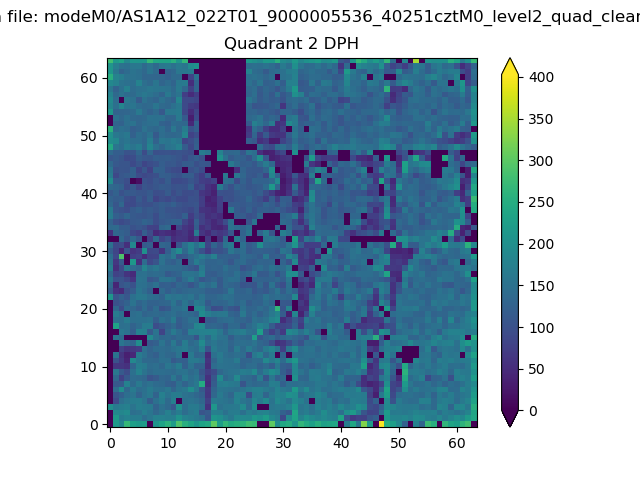
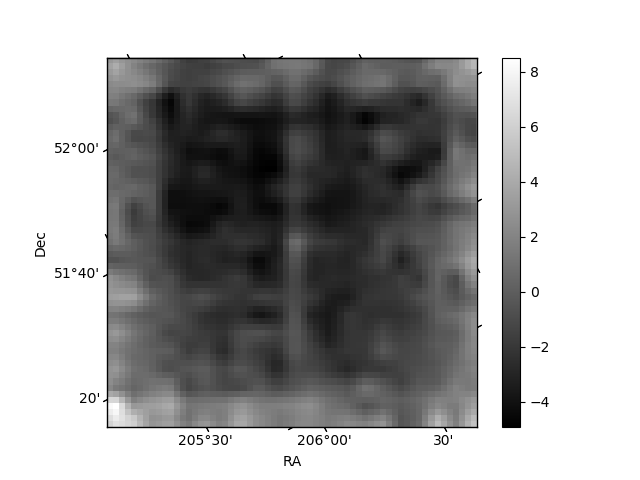
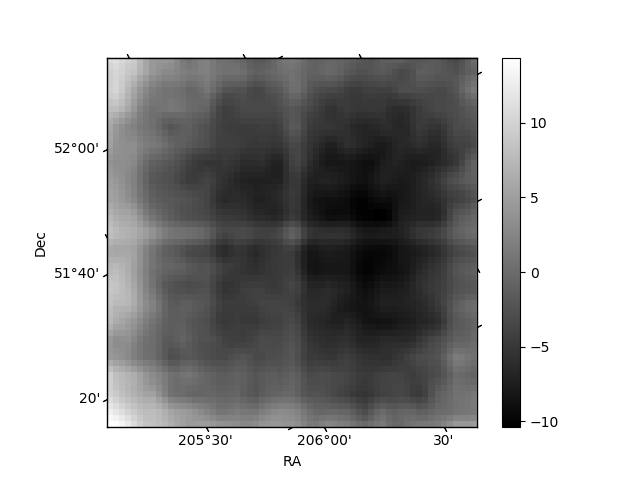
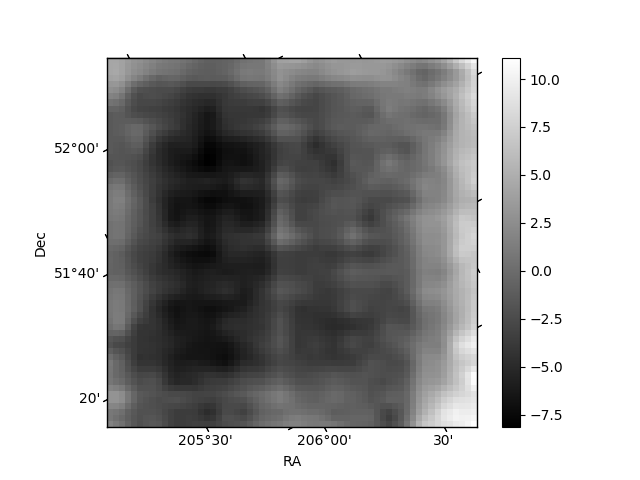
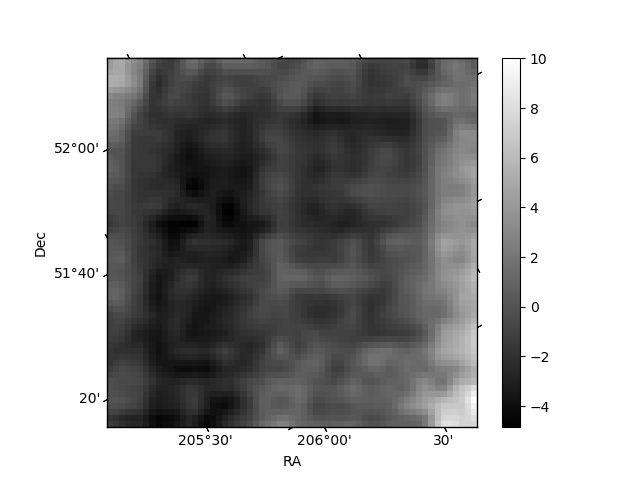
Histogram calculated using DETX and DETY for each event in the final _common_clean file
| Quadrant A |  |
 |
Quadrant B |
|---|---|---|---|
| Quadrant D | 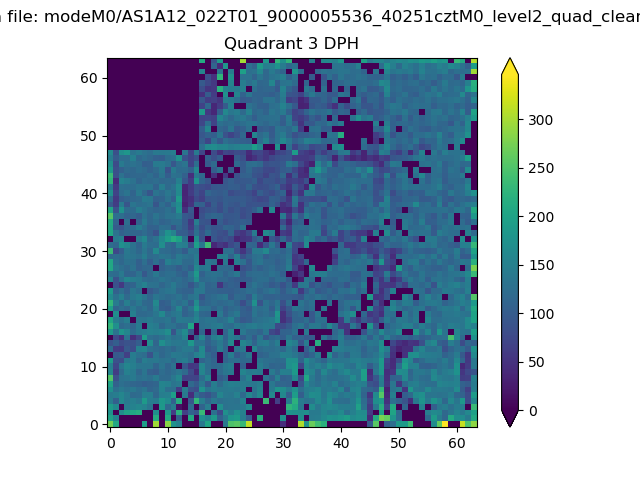 |
 |
Quadrant C |
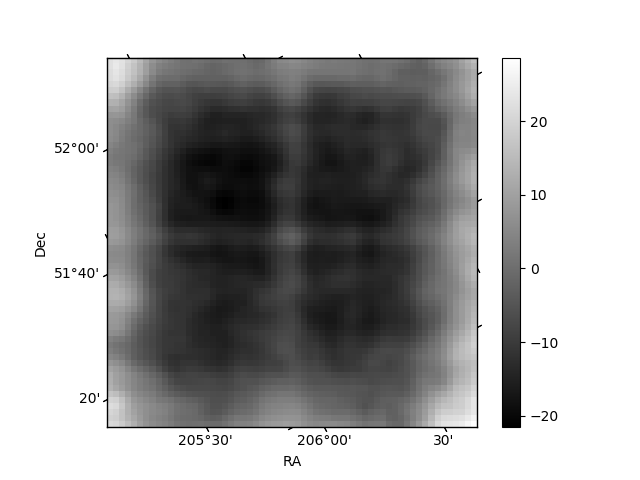
| Plot type | Count rate plots | Images |
|---|---|---|
| Comparison with Poisson distribution Blue bars denote a histogram of data divided into 1 sec bins. Red curve is a Poisson curve with rate = median count rate of data. |
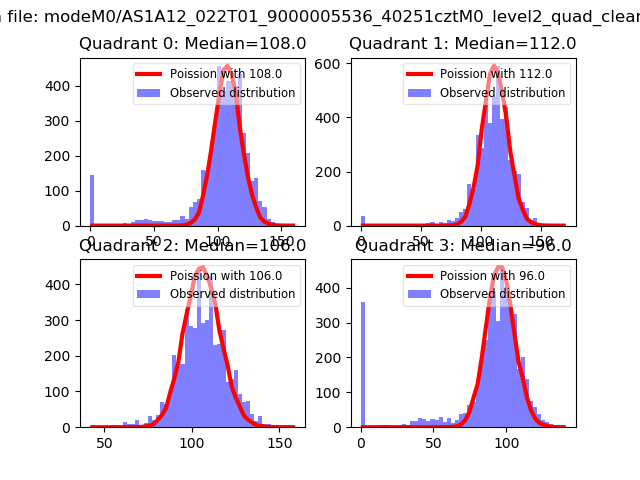 |
 |
| Quadrant-wise count rates Data is divided into 100 sec bins |
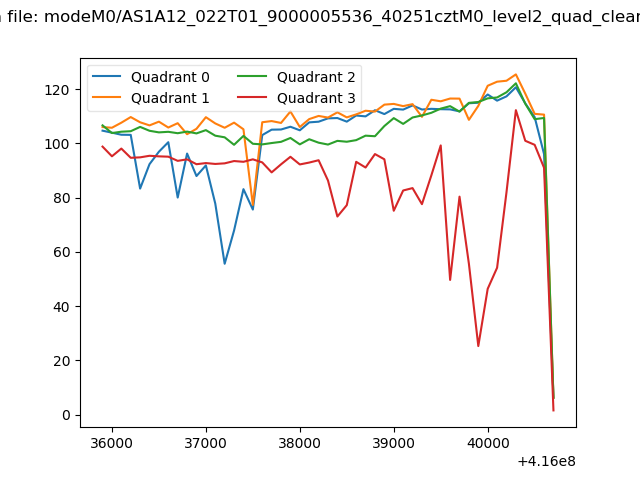 |
|
| Module-wise count rates for Quadrant A Data is divided into 100 sec bins |
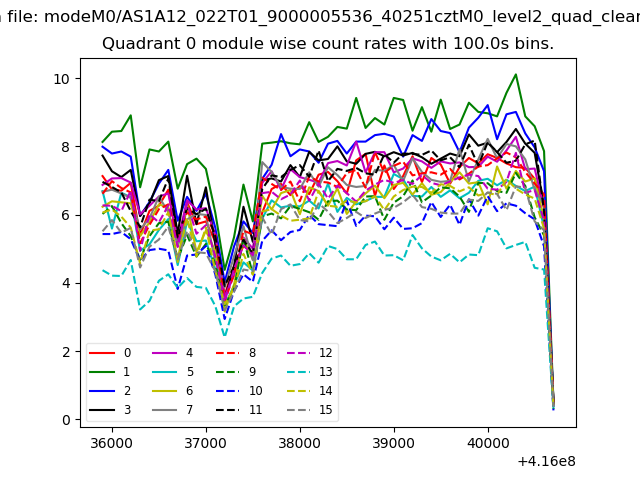 |
 |
| Module-wise count rates for Quadrant B Data is divided into 100 sec bins |
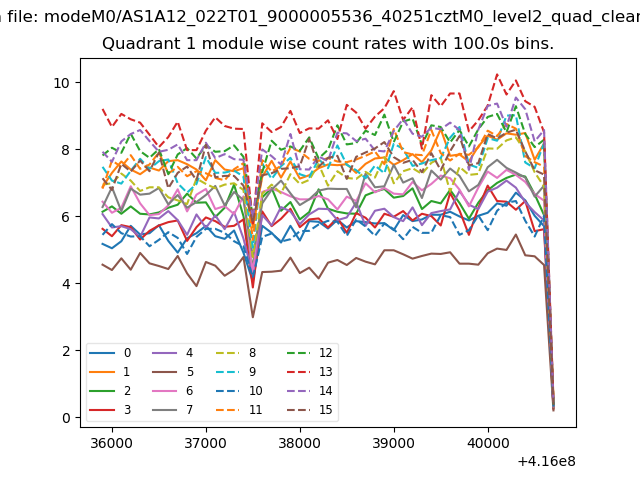 |
 |
| Module-wise count rates for Quadrant C Data is divided into 100 sec bins |
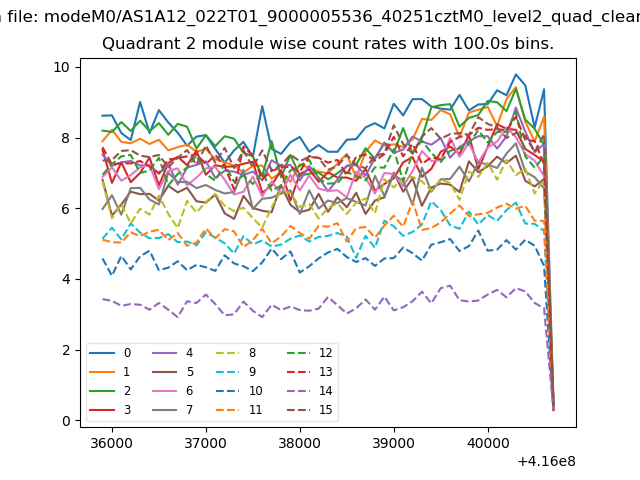 |
 |
| Module-wise count rates for Quadrant D Data is divided into 100 sec bins |
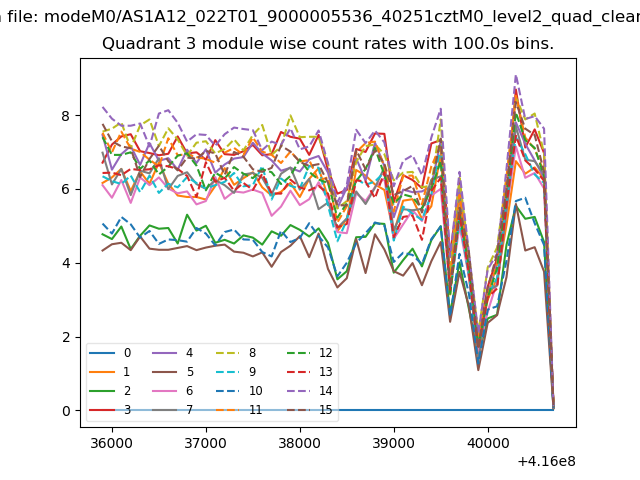 |
 |
| Parameter | Plot |
|---|---|
| CZT HV Monitor | 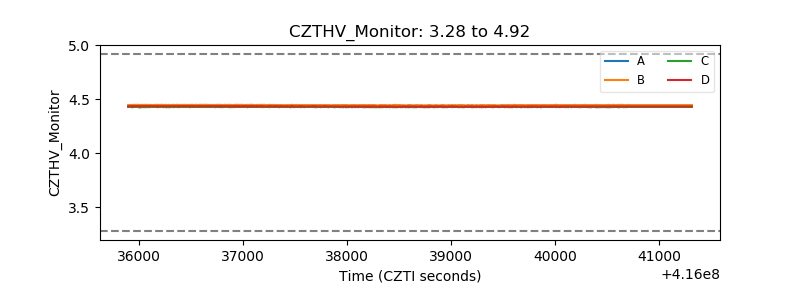 |
| D_VDD |  |
| Temperature 1 | 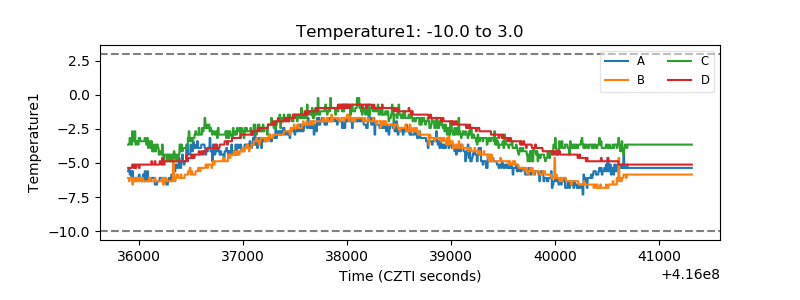 |
| Veto HV Monitor | 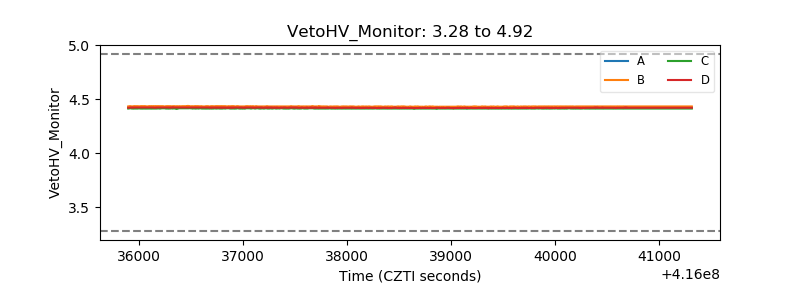 |
| Veto LLD | 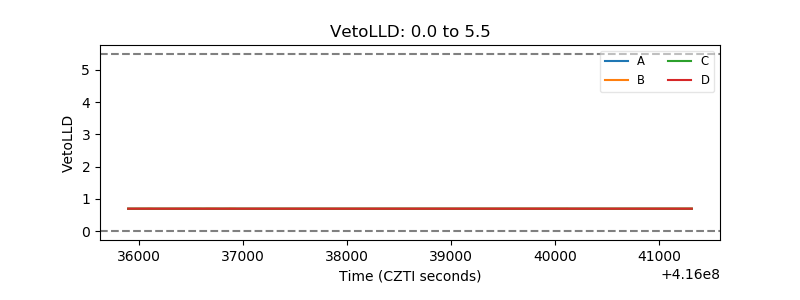 |
| Alpha Counter | 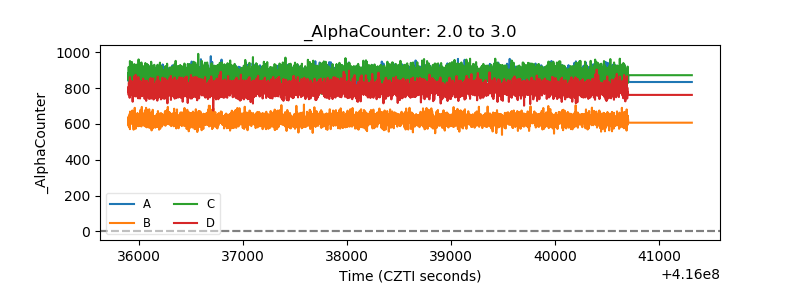 |
| _CPM_Rate | 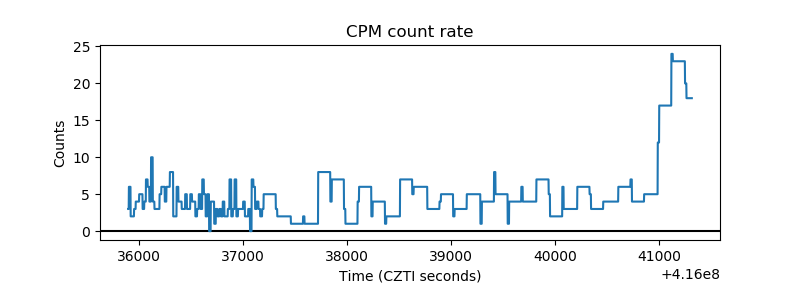 |
| CZT Counter | 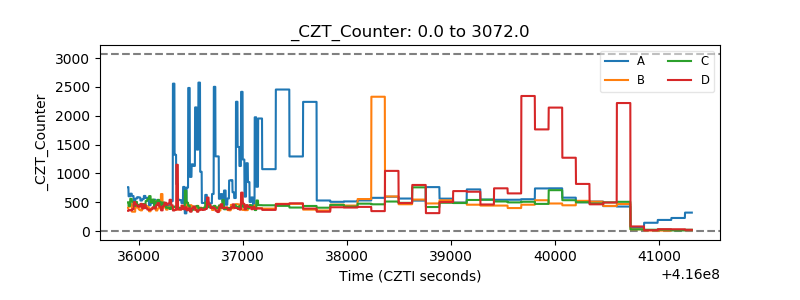 |
| +2.5 Volts monitor | 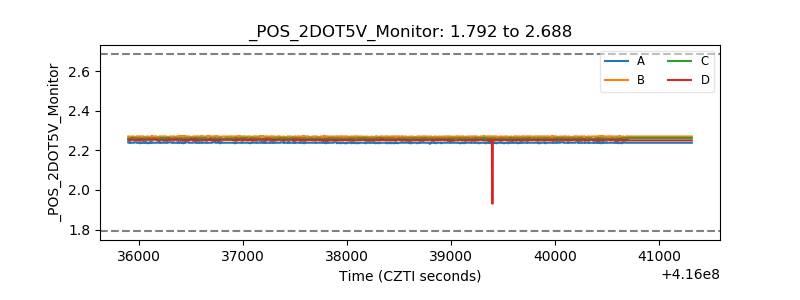 |
| +5 Volts monitor | 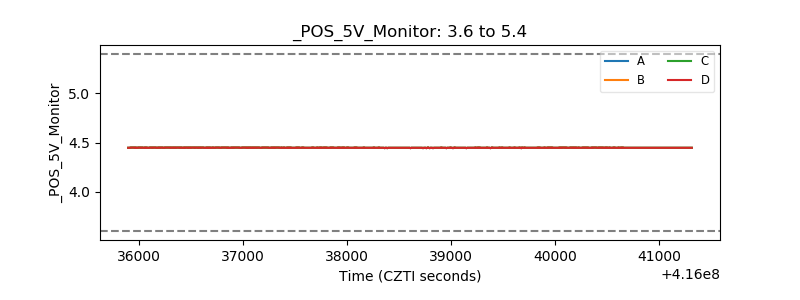 |
| _ROLL_ROT | 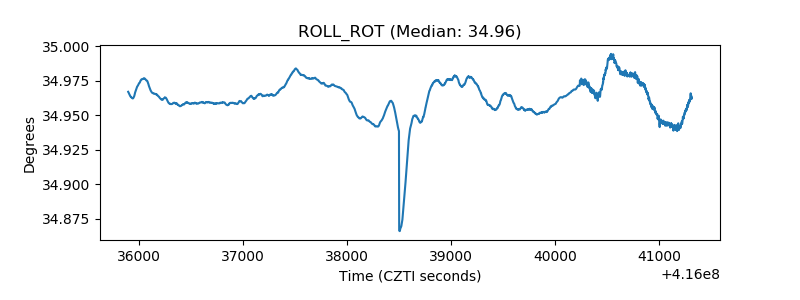 |
| _Roll_DEC | 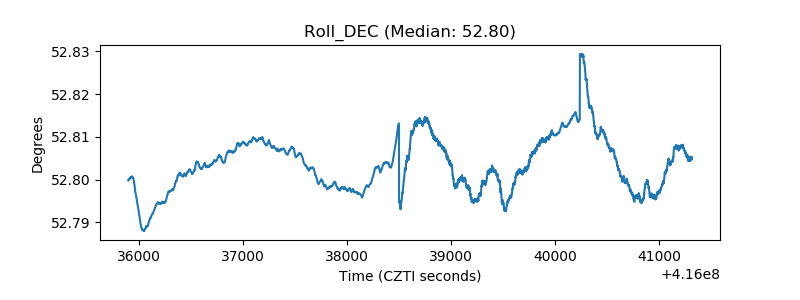 |
| _Roll_RA | 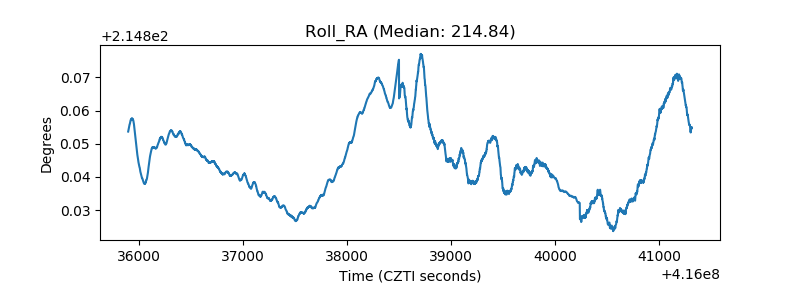 |
| Veto Counter | 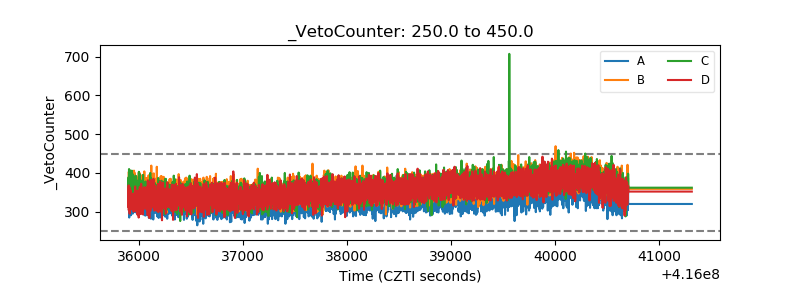 |