| Param | Original file | Final file |
|---|---|---|
| Filename | modeM0/AS1A12_022T01_9000005536_40253cztM0_level2.fits | modeM0/AS1A12_022T01_9000005536_40253cztM0_level2_quad_clean.evt |
| Size (bytes) | 348,655,680 | 92,862,720 |
| Size | 332.5 MB | 88.6 MB |
| Events in quadrant A | 3,193,739 | 622,826 |
| Events in quadrant B | 2,801,231 | 639,452 |
| Events in quadrant C | 2,721,461 | 607,561 |
| Events in quadrant D | 3,755,034 | 551,319 |
| Mode SS | |||
|---|---|---|---|
| Quadrant | BADHDUFLAG | Total packets | Discarded packets |
| A | 0 | 114 | 0 |
| B | 0 | 114 | 0 |
| C | 0 | 114 | 0 |
| D | 0 | 114 | 0 |
| Mode M0 | |||
|---|---|---|---|
| Quadrant | BADHDUFLAG | Total packets | Discarded packets |
| A | 0 | 12963 | 3 |
| B | 0 | 12108 | 2 |
| C | 0 | 11485 | 2 |
| D | 0 | 14989 | 2 |
| Mode M9 | |||
|---|---|---|---|
| Quadrant | BADHDUFLAG | Total packets | Discarded packets |
| A | 0 | 23 | 0 |
| B | 0 | 23 | 0 |
| C | 0 | 23 | 0 |
| D | 0 | 24 | 0 |
| Quadrant | Total seconds | Saturated seconds | Saturation percentage |
|---|---|---|---|
| A | 5582 | 55 | 0.985310% |
| B | 5582 | 55 | 0.985310% |
| C | 5582 | 19 | 0.340380% |
| D | 5582 | 191 | 3.421713% |
Noise dominated data is calculated using 1-second bins in cleaned event files. If a bin has >2000 counts, and if more than 50% of those come from <1% of pixels, then it is considered to be noise-dominated and hence unusable.
| Quadrant | # 1 sec bins | Bins with >0 counts | Bins with >2000 counts | High rate bins dominated by noise | Noise dominated (total time) | Noise dominated (detector-on time) | Marked lightcurve |
|---|---|---|---|---|---|---|---|
| A | 7254 | 5583 | 25 | 25 | 0.34% | 0.45% | 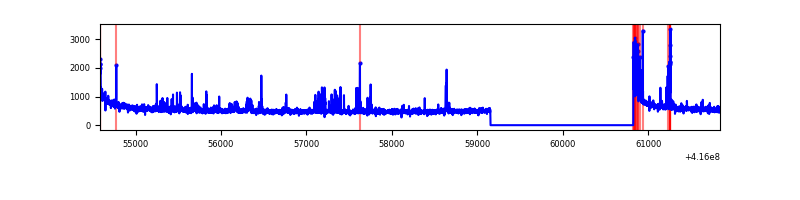 |
| B | 7254 | 5583 | 31 | 31 | 0.43% | 0.56% | 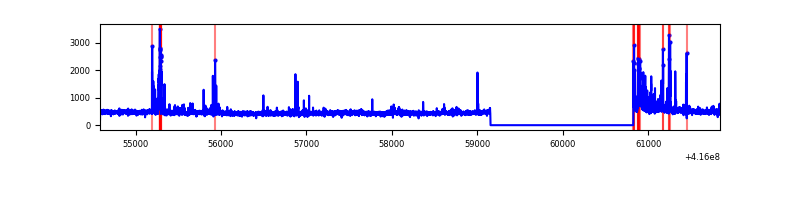 |
| C | 7254 | 5583 | 10 | 10 | 0.14% | 0.18% | 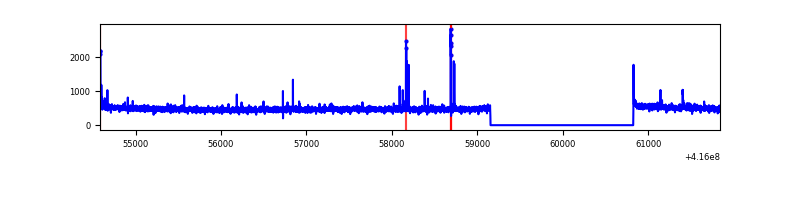 |
| D | 7254 | 5583 | 144 | 144 | 1.99% | 2.58% | 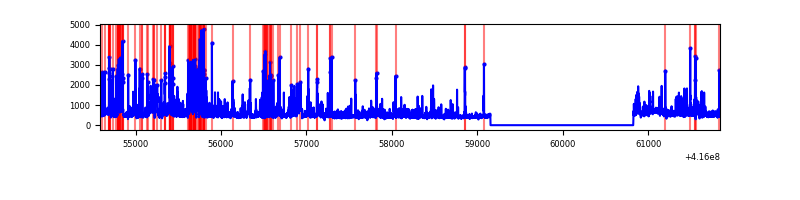 |
Top three noisy pixels from each quadrant. If the there are fewer than three noisy pixels in the level2.evt file, extra rows are filled as -1
| Pixel properties | Quadrant properties | ||||||
|---|---|---|---|---|---|---|---|
| Quadrant | DetID | PixID | Counts | Sigma | Mean | Median | Sigma |
| A | 10 | 83 | 501652 | 3867.9 | 629 | 617 | 129.5 |
| A | 13 | 248 | 195757 | 1506.45 | 629 | 617 | 129.5 |
| A | 6 | 10 | 41122 | 312.69 | 629 | 617 | 129.5 |
| B | 5 | 255 | 270702 | 2247.72 | 624 | 606 | 120.2 |
| B | 0 | 245 | 50764 | 417.41 | 624 | 606 | 120.2 |
| B | 12 | 111 | 15367 | 122.84 | 624 | 606 | 120.2 |
| C | 15 | 214 | 239344 | 1667.89 | 613 | 614 | 143.1 |
| C | 14 | 254 | 44267 | 304.98 | 613 | 614 | 143.1 |
| C | 0 | 10 | 19202 | 129.87 | 613 | 614 | 143.1 |
| D | 12 | 227 | 668982 | 4443.23 | 610 | 592 | 150.4 |
| D | 12 | 0 | 367364 | 2438.17 | 610 | 592 | 150.4 |
| D | 13 | 249 | 109914 | 726.73 | 610 | 592 | 150.4 |
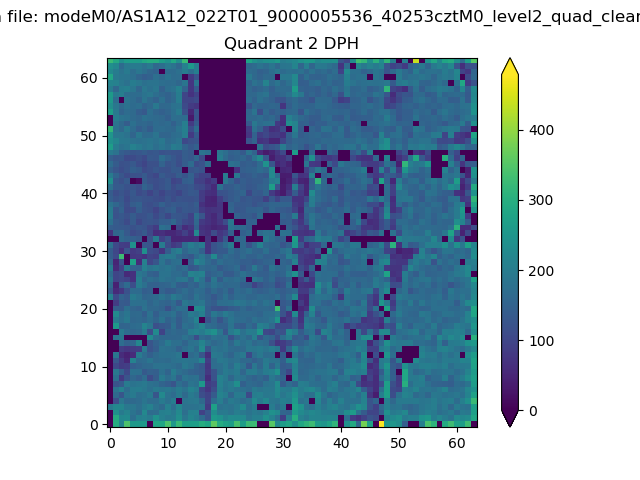
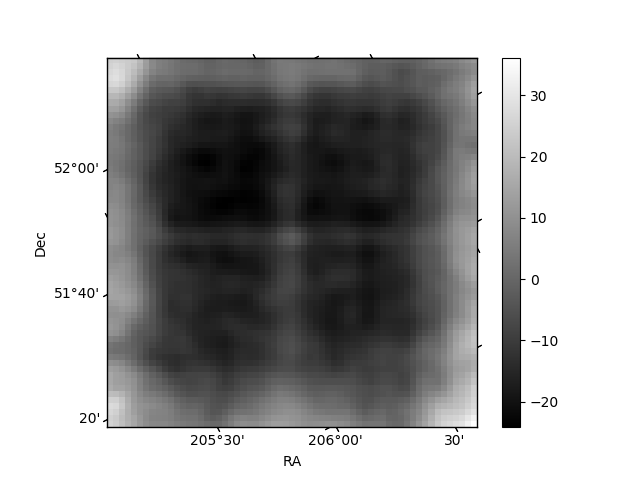
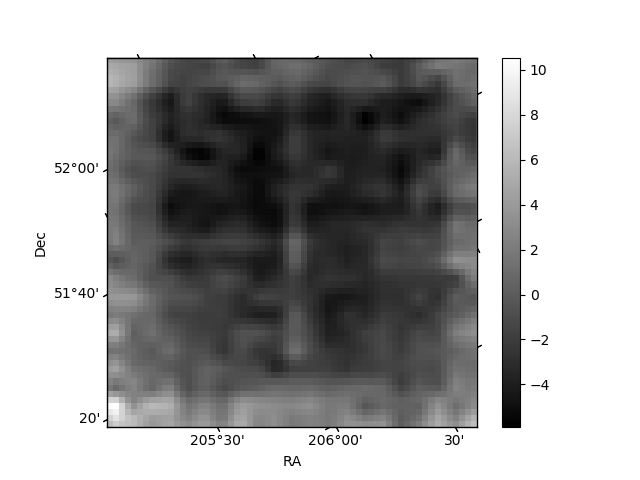
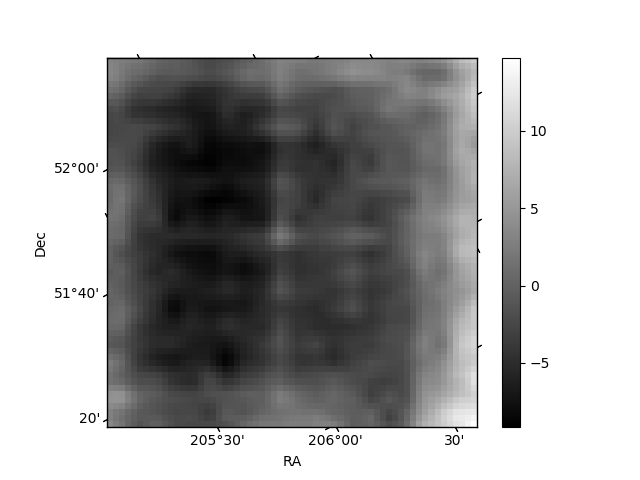
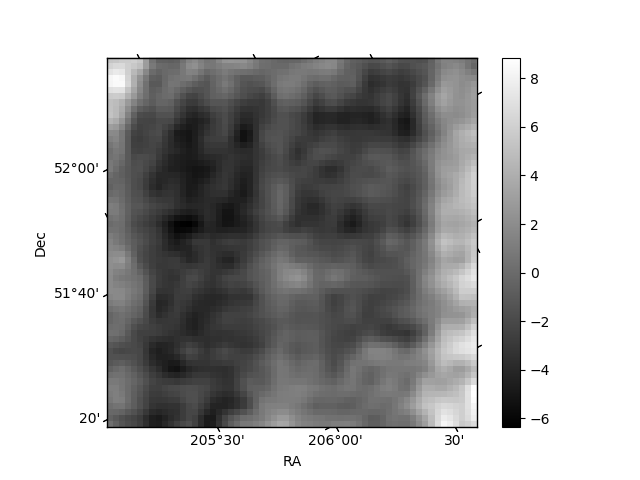
Histogram calculated using DETX and DETY for each event in the final _common_clean file
| Quadrant A | 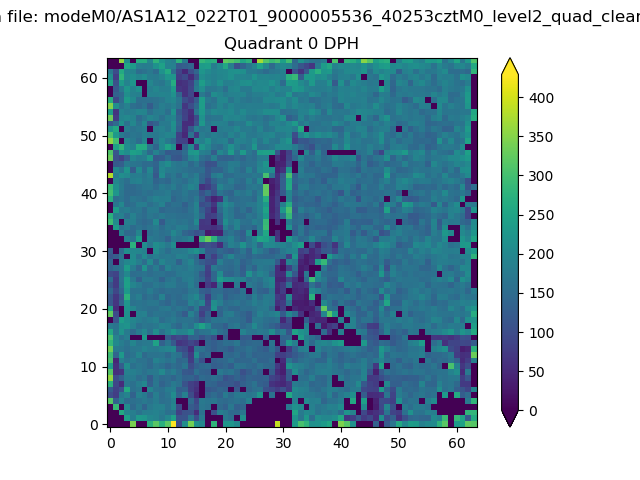 |
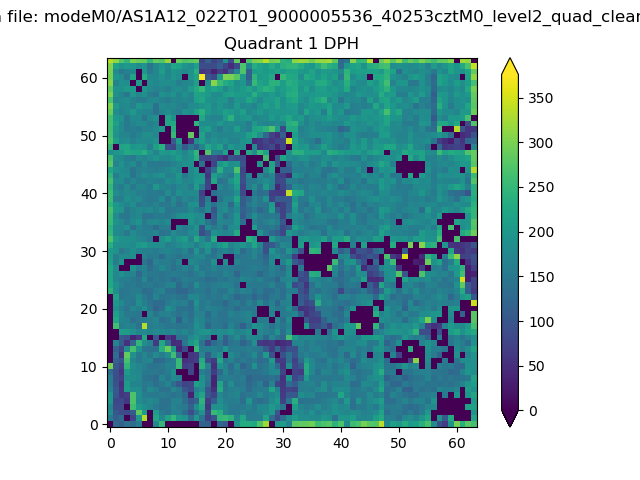 |
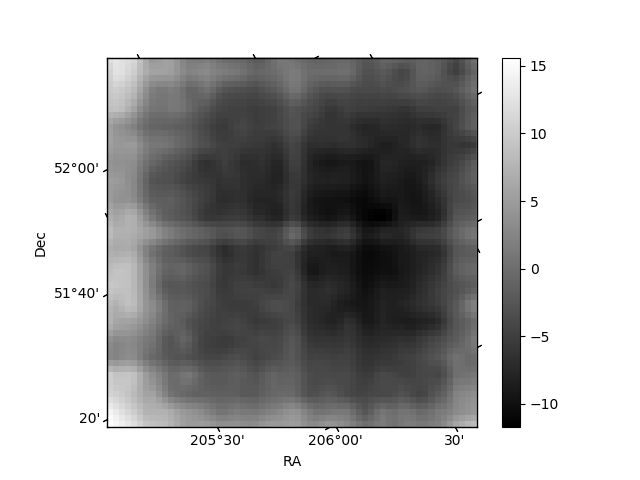
Quadrant B |
|---|---|---|---|
| Quadrant D | 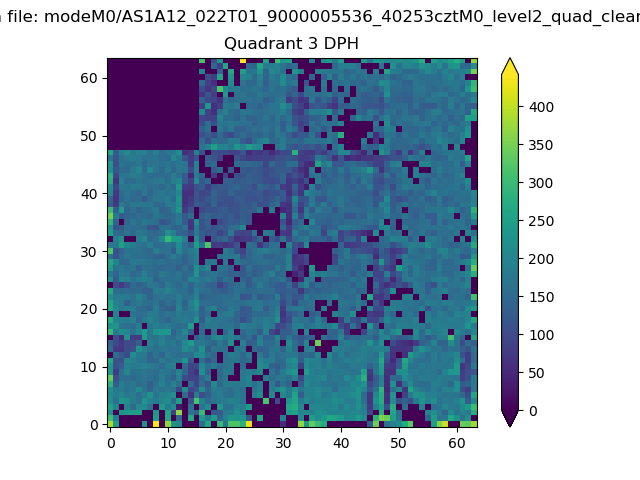 |
 |
Quadrant C |
| Plot type | Count rate plots | Images |
|---|---|---|
| Comparison with Poisson distribution Blue bars denote a histogram of data divided into 1 sec bins. Red curve is a Poisson curve with rate = median count rate of data. |
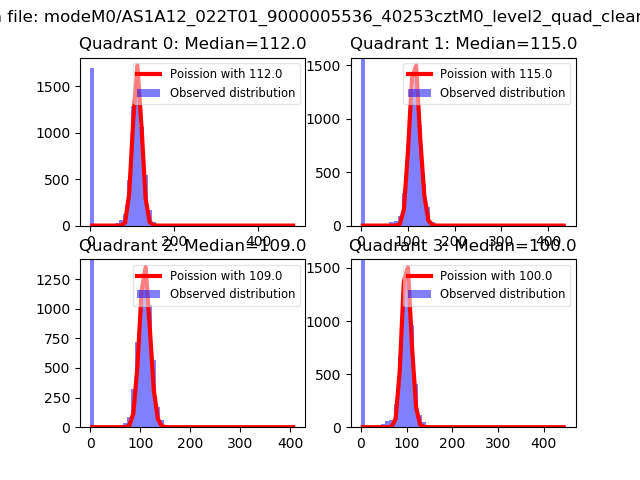 |
 |
| Quadrant-wise count rates Data is divided into 100 sec bins |
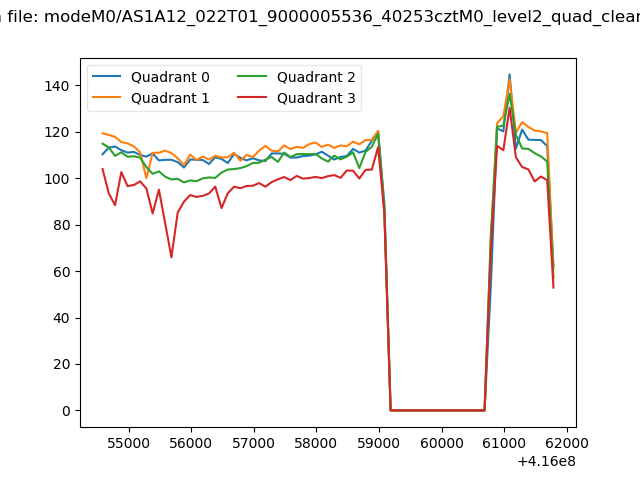 |
|
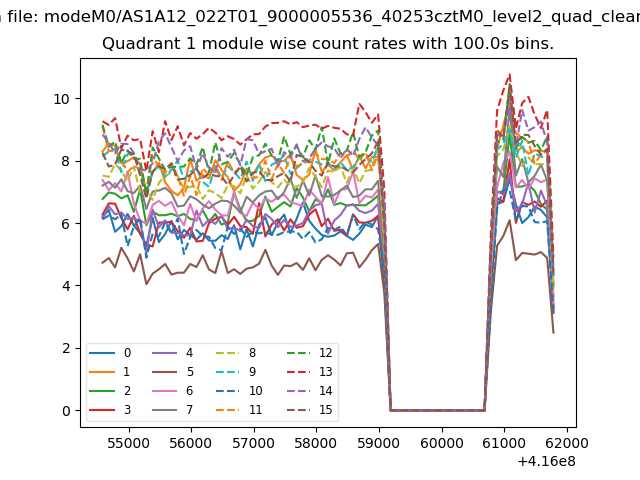
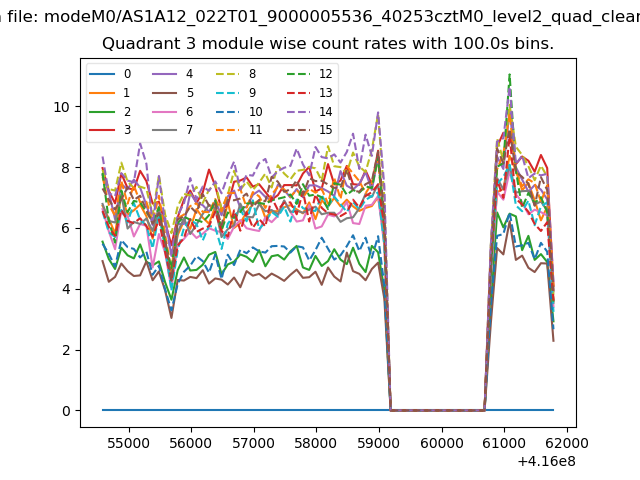
| Module-wise count rates for Quadrant A Data is divided into 100 sec bins |
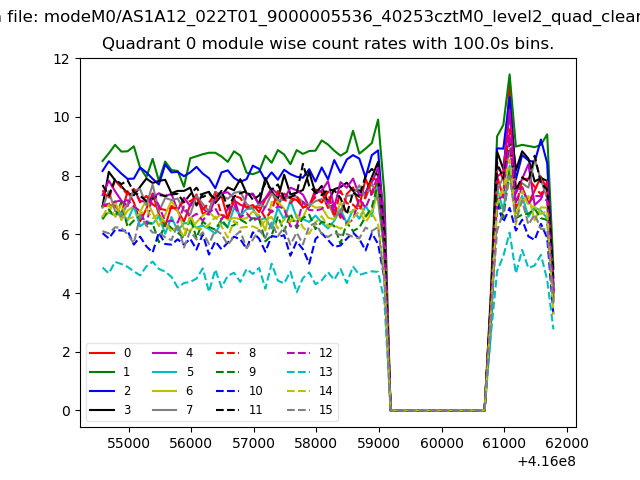 |
 |
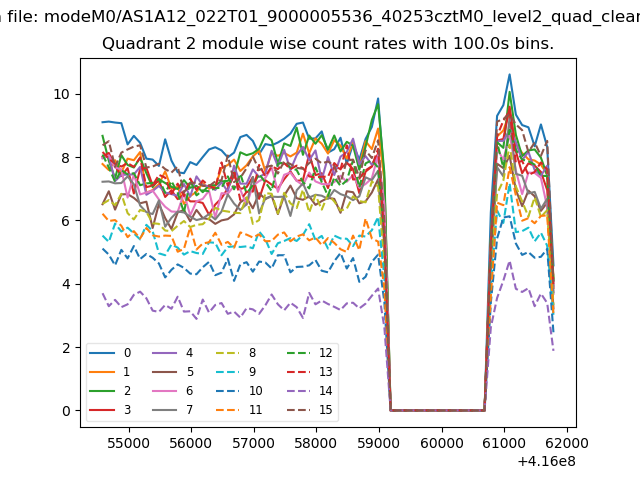
| Module-wise count rates for Quadrant B Data is divided into 100 sec bins |
 |
 |
| Module-wise count rates for Quadrant C Data is divided into 100 sec bins |
 |
 |
| Module-wise count rates for Quadrant D Data is divided into 100 sec bins |
 |
 |
| Parameter | Plot |
|---|---|
| CZT HV Monitor | 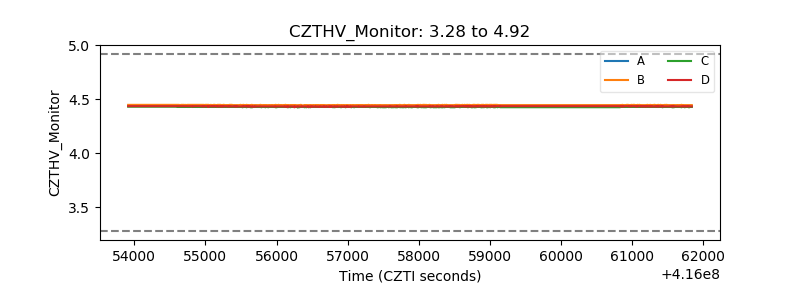 |
| D_VDD | 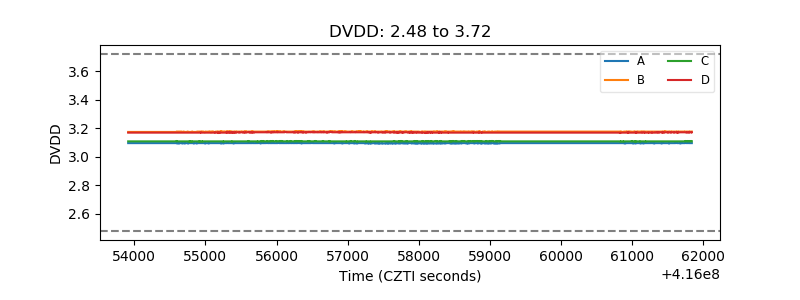 |
| Temperature 1 | 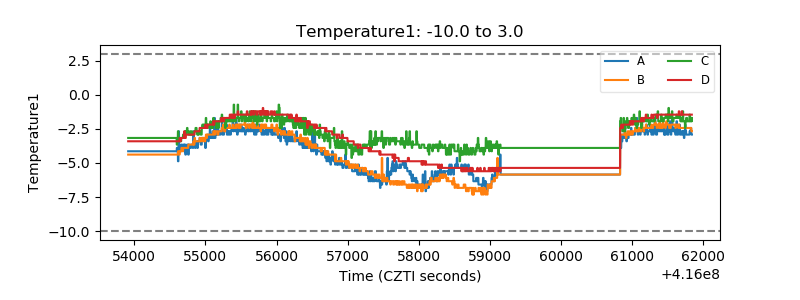 |
| Veto HV Monitor | 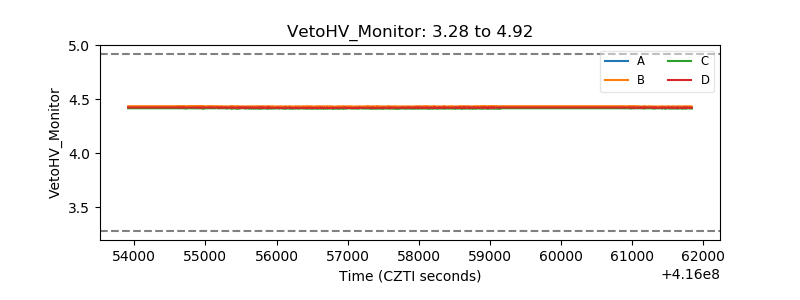 |
| Veto LLD | 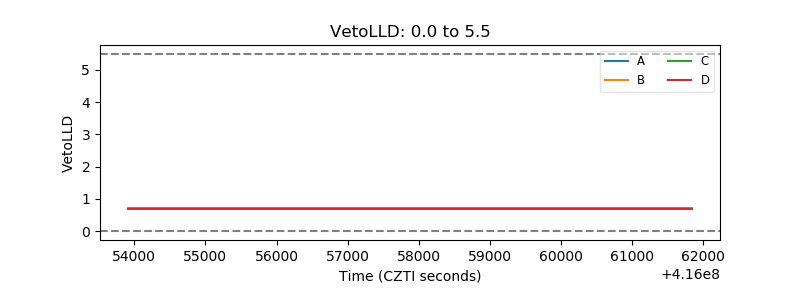 |
| Alpha Counter | 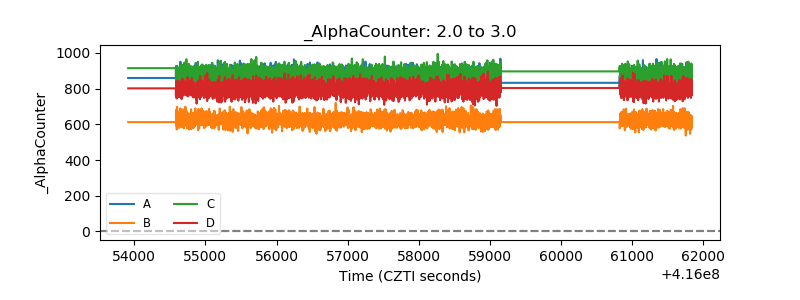 |
| _CPM_Rate | 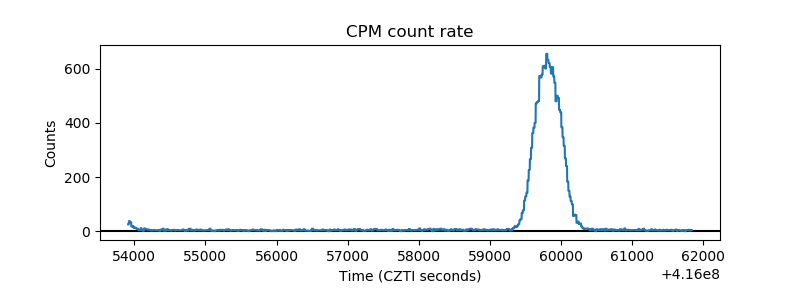 |
| CZT Counter | 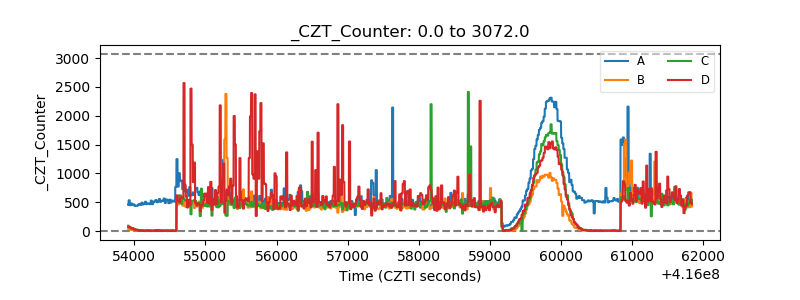 |
| +2.5 Volts monitor | 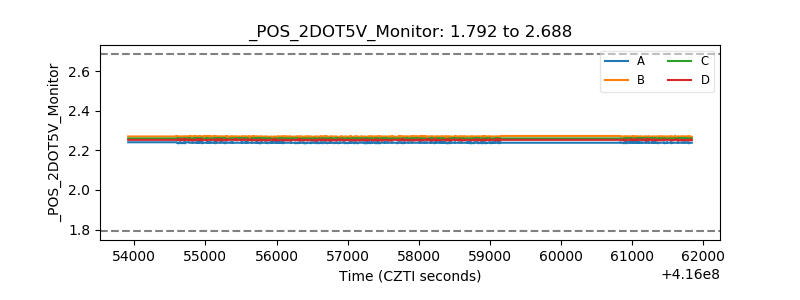 |
| +5 Volts monitor | 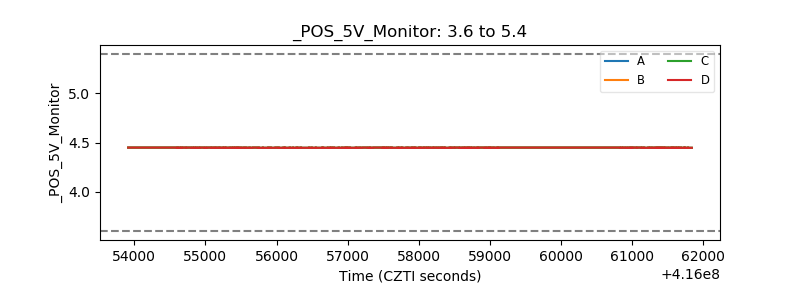 |
| _ROLL_ROT | 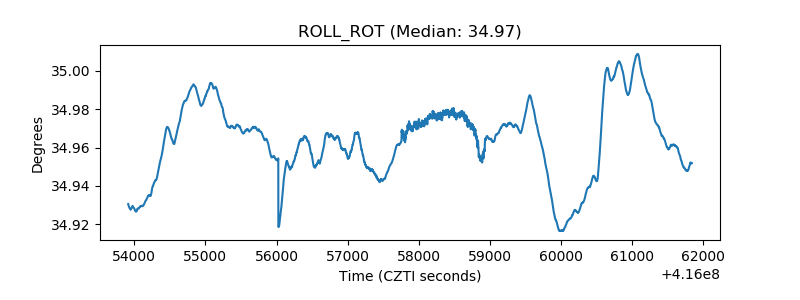 |
| _Roll_DEC | 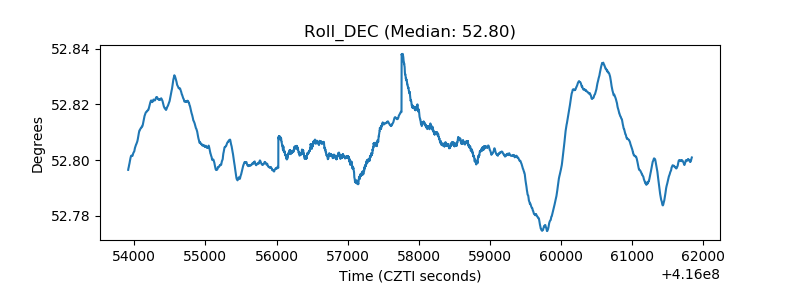 |
| _Roll_RA | 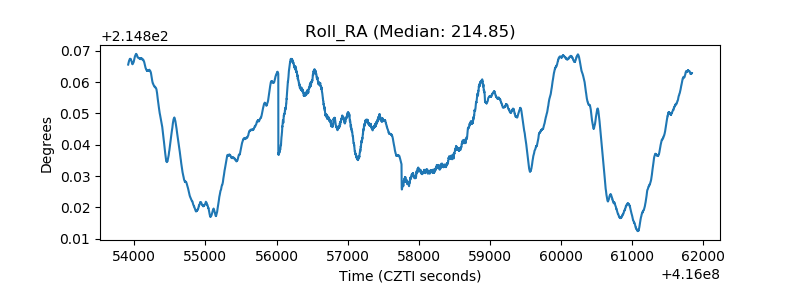 |
| Veto Counter | 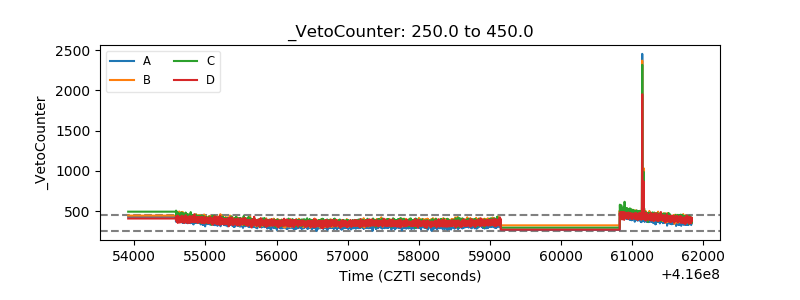 |