| Param | Original file | Final file |
|---|---|---|
| Filename | modeM0/AS1A12_022T01_9000005536_40255cztM0_level2.fits | modeM0/AS1A12_022T01_9000005536_40255cztM0_level2_quad_clean.evt |
| Size (bytes) | 370,638,720 | 91,224,000 |
| Size | 353.5 MB | 87.0 MB |
| Events in quadrant A | 3,152,578 | 616,340 |
| Events in quadrant B | 2,798,105 | 641,070 |
| Events in quadrant C | 2,849,192 | 606,203 |
| Events in quadrant D | 4,503,303 | 524,029 |
| Mode SS | |||
|---|---|---|---|
| Quadrant | BADHDUFLAG | Total packets | Discarded packets |
| A | 0 | 108 | 0 |
| B | 0 | 108 | 0 |
| C | 0 | 108 | 0 |
| D | 0 | 108 | 0 |
| Mode M0 | |||
|---|---|---|---|
| Quadrant | BADHDUFLAG | Total packets | Discarded packets |
| A | 0 | 12743 | 3 |
| B | 0 | 11748 | 2 |
| C | 0 | 11638 | 2 |
| D | 0 | 17044 | 2 |
| Mode M9 | |||
|---|---|---|---|
| Quadrant | BADHDUFLAG | Total packets | Discarded packets |
| A | 0 | 32 | 0 |
| B | 0 | 32 | 0 |
| C | 0 | 32 | 0 |
| D | 0 | 33 | 0 |
| Quadrant | Total seconds | Saturated seconds | Saturation percentage |
|---|---|---|---|
| A | 5352 | 132 | 2.466368% |
| B | 5352 | 41 | 0.766069% |
| C | 5352 | 38 | 0.710015% |
| D | 5352 | 467 | 8.725710% |
Noise dominated data is calculated using 1-second bins in cleaned event files. If a bin has >2000 counts, and if more than 50% of those come from <1% of pixels, then it is considered to be noise-dominated and hence unusable.
| Quadrant | # 1 sec bins | Bins with >0 counts | Bins with >2000 counts | High rate bins dominated by noise | Noise dominated (total time) | Noise dominated (detector-on time) | Marked lightcurve |
|---|---|---|---|---|---|---|---|
| A | 7145 | 5353 | 71 | 71 | 0.99% | 1.33% | 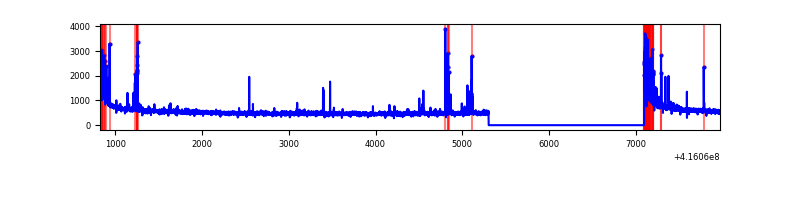 |
| B | 7145 | 5353 | 22 | 22 | 0.31% | 0.41% | 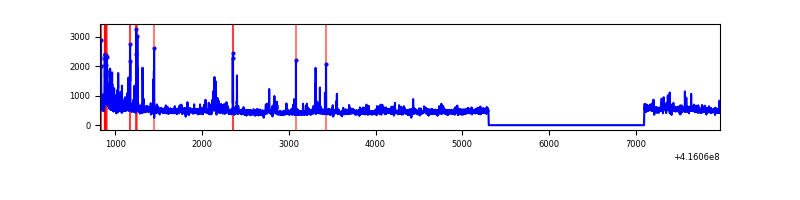 |
| C | 7145 | 5353 | 34 | 34 | 0.48% | 0.64% | 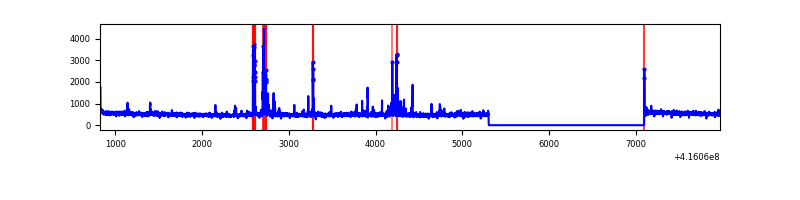 |
| D | 7145 | 5353 | 391 | 391 | 5.47% | 7.30% | 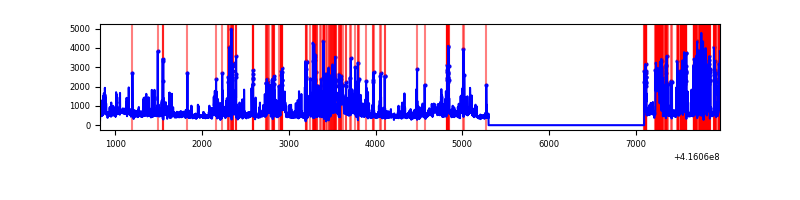 |
Top three noisy pixels from each quadrant. If the there are fewer than three noisy pixels in the level2.evt file, extra rows are filled as -1
| Pixel properties | Quadrant properties | ||||||
|---|---|---|---|---|---|---|---|
| Quadrant | DetID | PixID | Counts | Sigma | Mean | Median | Sigma |
| A | 10 | 83 | 468297 | 3725.96 | 611 | 598 | 125.5 |
| A | 13 | 248 | 307177 | 2442.39 | 611 | 598 | 125.5 |
| A | 13 | 6 | 13258 | 100.85 | 611 | 598 | 125.5 |
| B | 5 | 255 | 192542 | 1634.23 | 611 | 595 | 117.5 |
| B | 0 | 245 | 110674 | 937.21 | 611 | 595 | 117.5 |
| B | 0 | 230 | 68353 | 576.89 | 611 | 595 | 117.5 |
| C | 15 | 214 | 230094 | 1638.01 | 601 | 604 | 140.1 |
| C | 14 | 254 | 212681 | 1513.73 | 601 | 604 | 140.1 |
| C | 9 | 54 | 38427 | 269.97 | 601 | 604 | 140.1 |
| D | 12 | 227 | 1771017 | 12431.62 | 580 | 563 | 142.4 |
| D | 12 | 0 | 212182 | 1485.93 | 580 | 563 | 142.4 |
| D | 13 | 249 | 91731 | 640.16 | 580 | 563 | 142.4 |
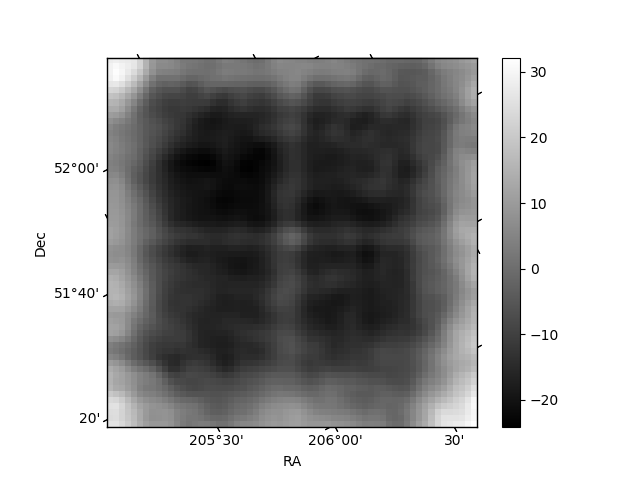
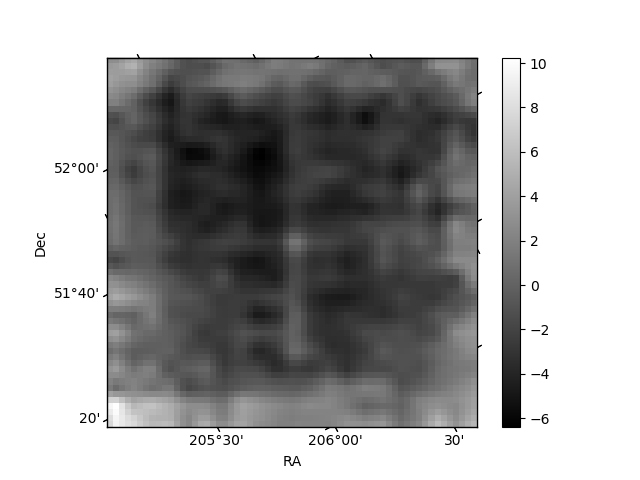
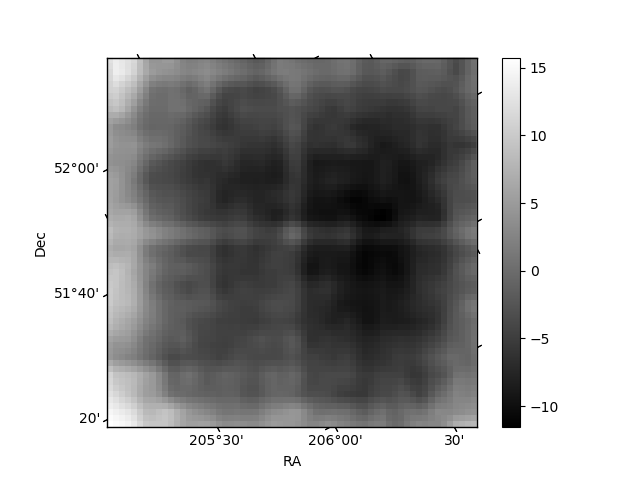
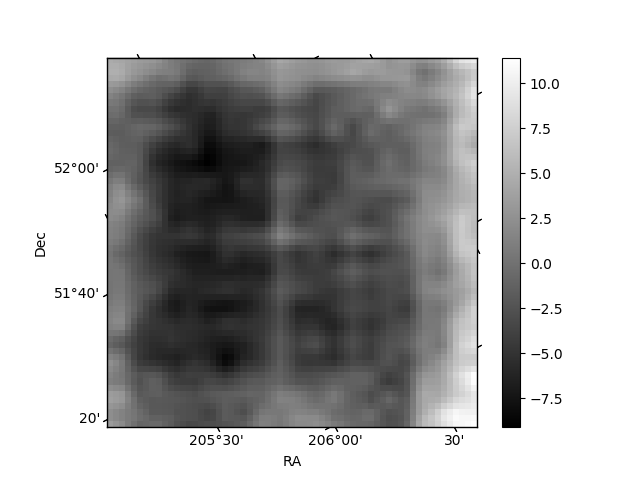
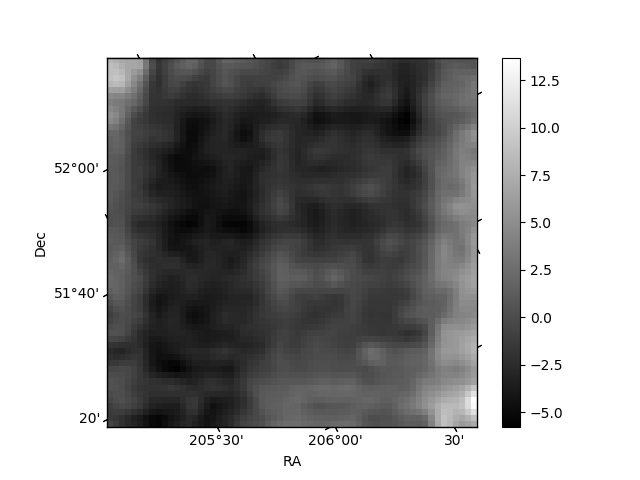
Histogram calculated using DETX and DETY for each event in the final _common_clean file
| Quadrant A | 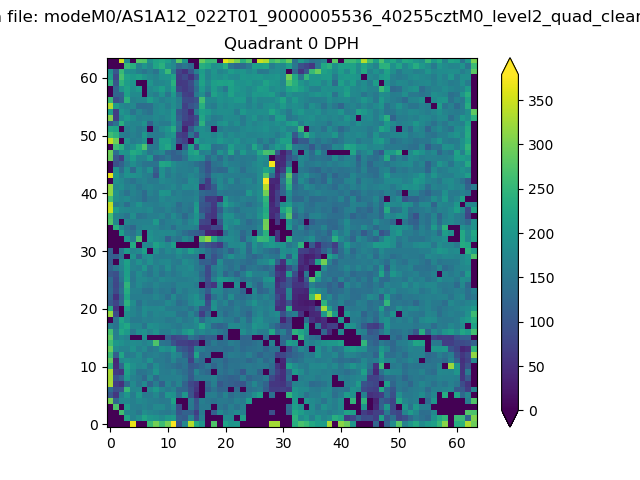 |
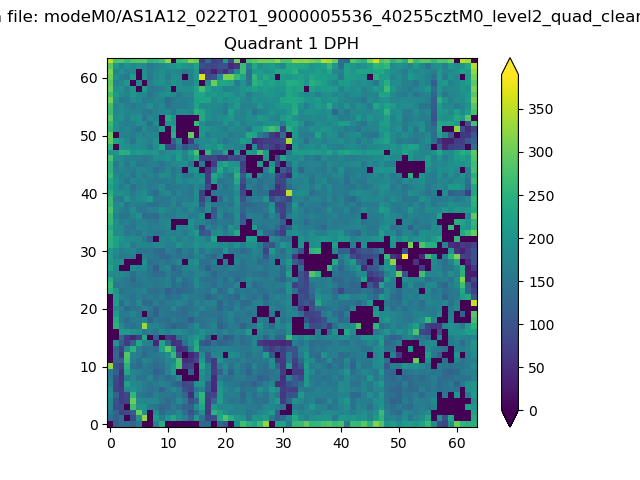 |
Quadrant B |
|---|---|---|---|
| Quadrant D | 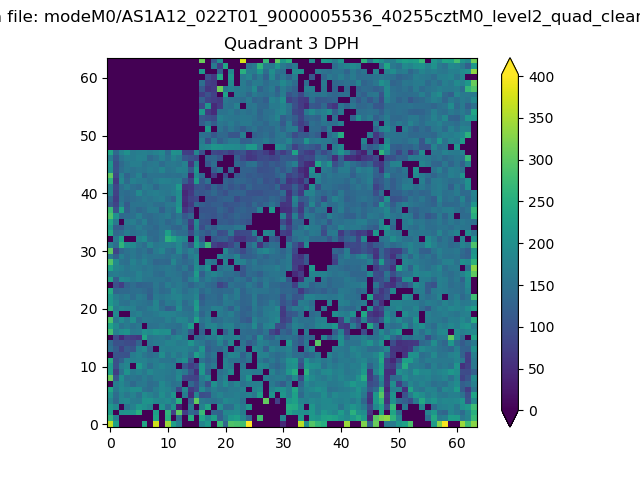 |
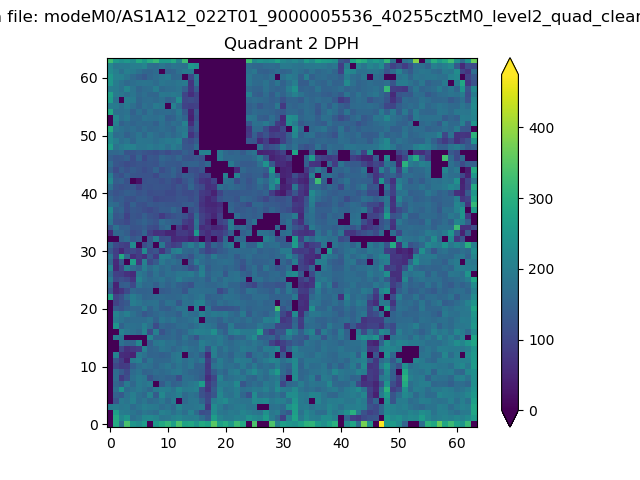 |
Quadrant C |
| Plot type | Count rate plots | Images |
|---|---|---|
| Comparison with Poisson distribution Blue bars denote a histogram of data divided into 1 sec bins. Red curve is a Poisson curve with rate = median count rate of data. |
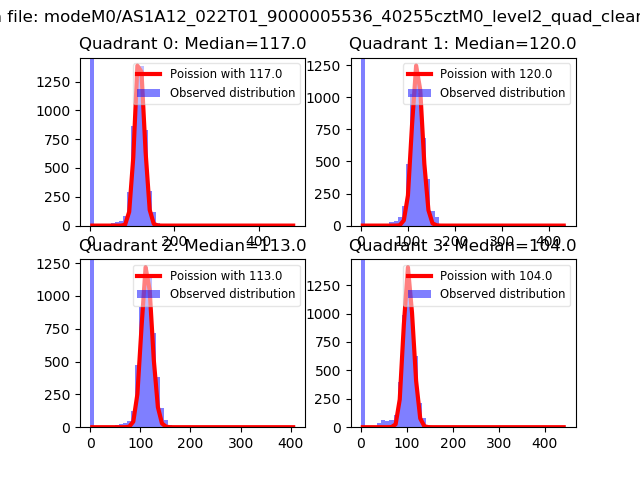 |
 |
| Quadrant-wise count rates Data is divided into 100 sec bins |
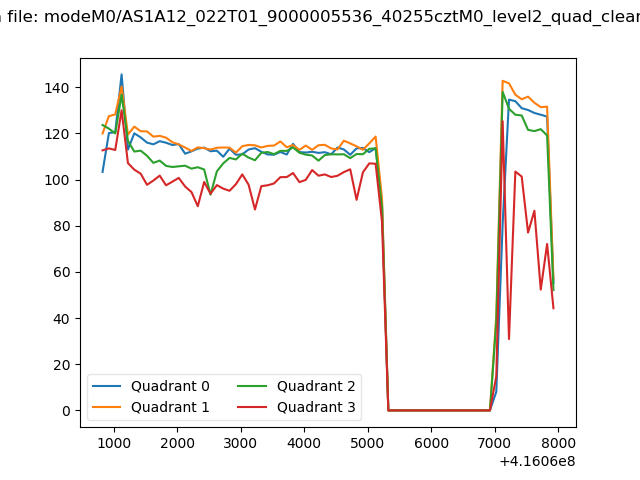 |
|
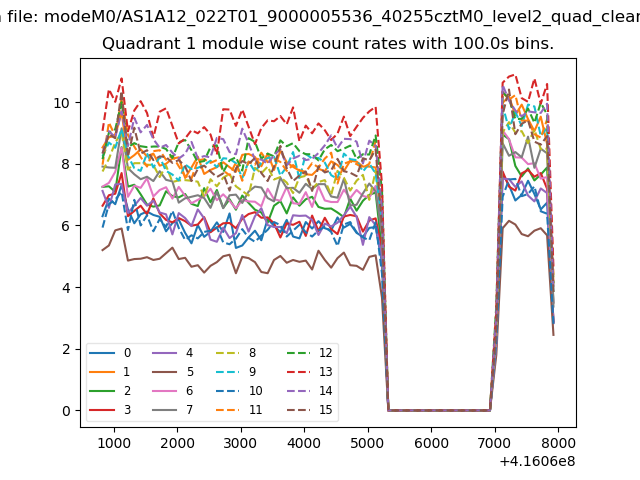
| Module-wise count rates for Quadrant A Data is divided into 100 sec bins |
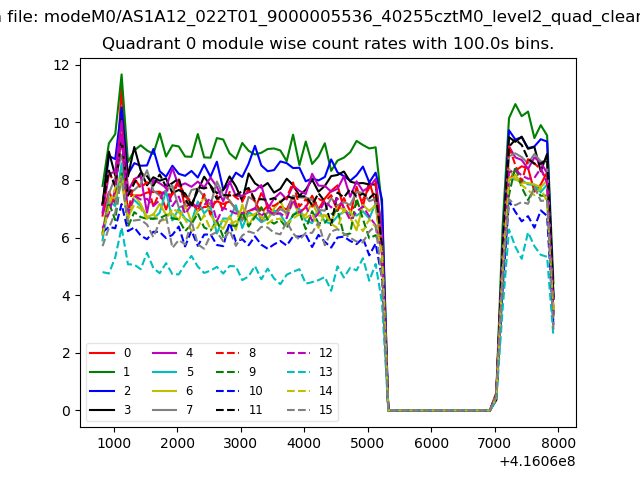 |
 |
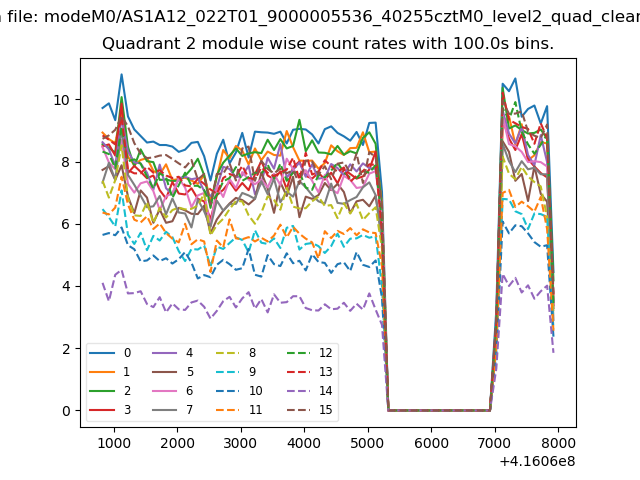
| Module-wise count rates for Quadrant B Data is divided into 100 sec bins |
 |
 |
| Module-wise count rates for Quadrant C Data is divided into 100 sec bins |
 |
 |
| Module-wise count rates for Quadrant D Data is divided into 100 sec bins |
 |
 |
| Parameter | Plot |
|---|---|
| CZT HV Monitor | 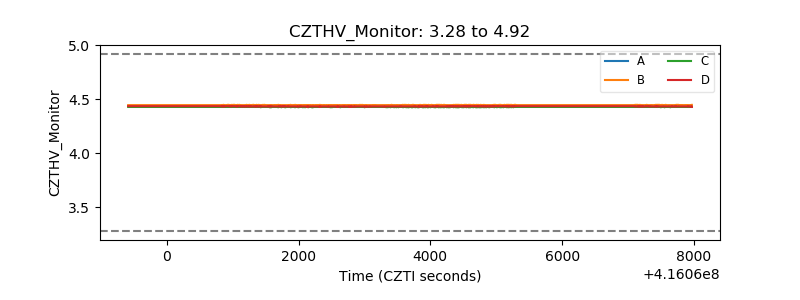 |
| D_VDD | 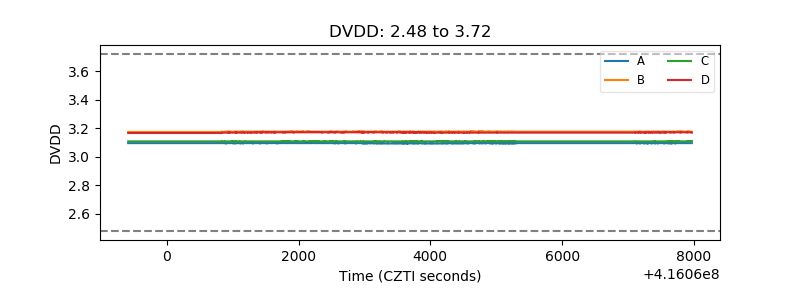 |
| Temperature 1 | 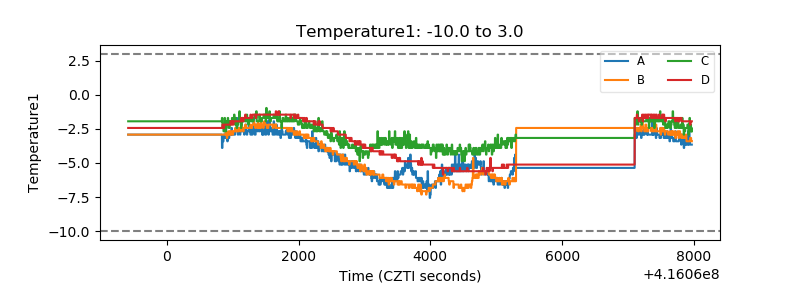 |
| Veto HV Monitor | 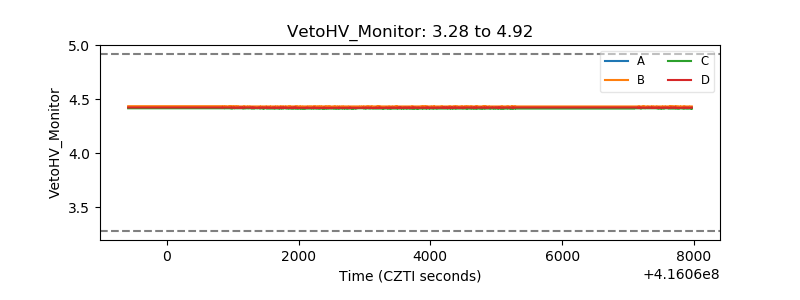 |
| Veto LLD | 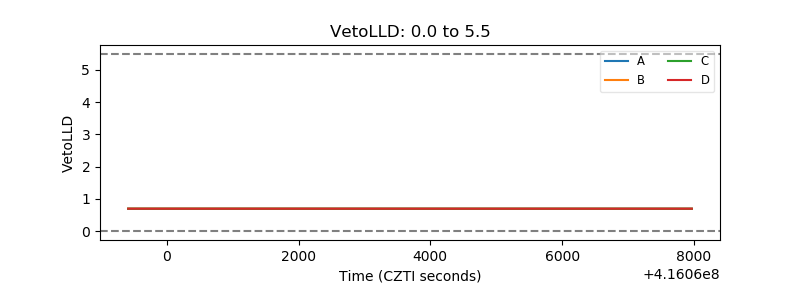 |
| Alpha Counter | 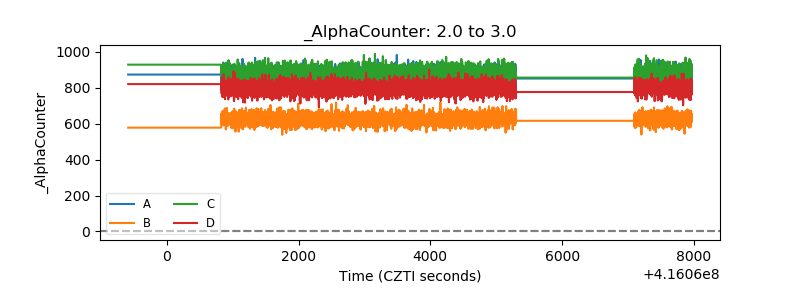 |
| _CPM_Rate | 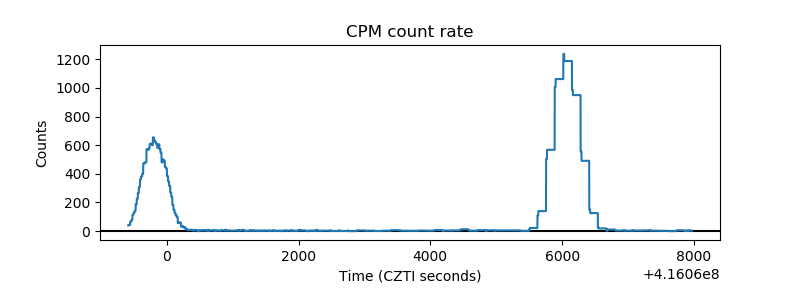 |
| CZT Counter | 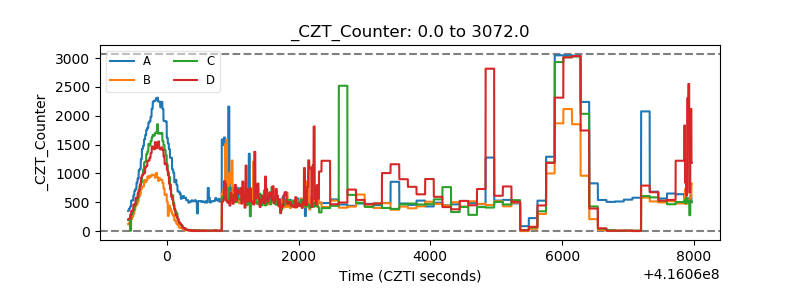 |
| +2.5 Volts monitor | 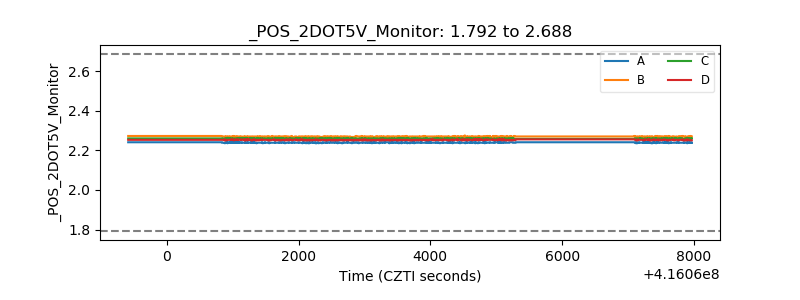 |
| +5 Volts monitor | 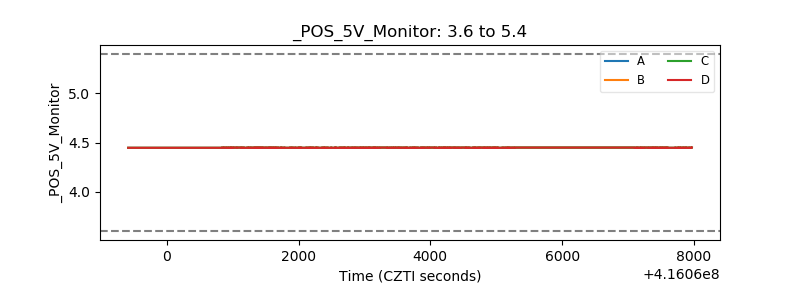 |
| _ROLL_ROT | 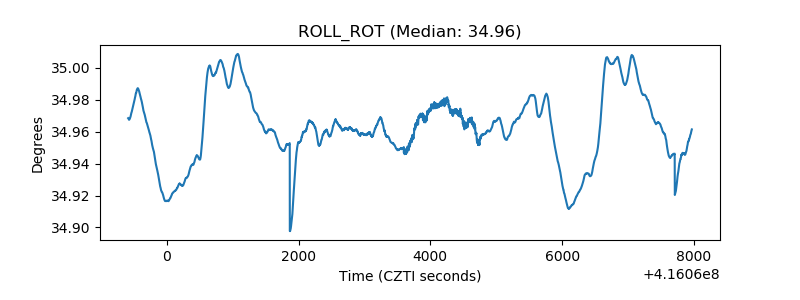 |
| _Roll_DEC | 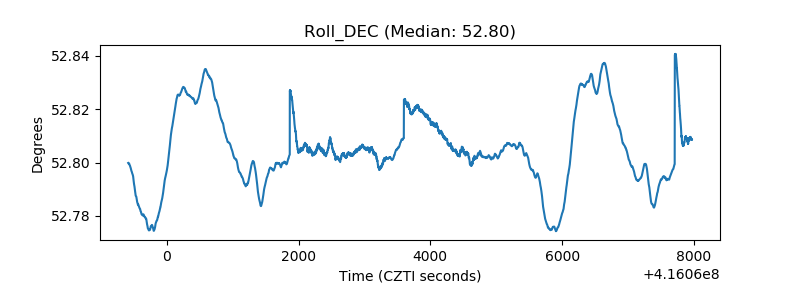 |
| _Roll_RA | 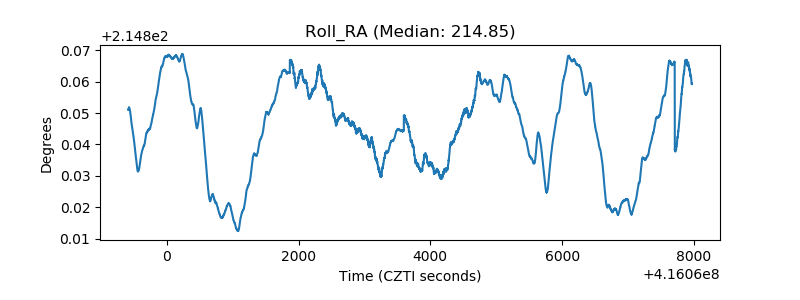 |
| Veto Counter |  |