| Param | Original file | Final file |
|---|---|---|
| Filename | modeM0/AS1A12_022T01_9000005536_40257cztM0_level2.fits | modeM0/AS1A12_022T01_9000005536_40257cztM0_level2_quad_clean.evt |
| Size (bytes) | 346,786,560 | 95,641,920 |
| Size | 330.7 MB | 91.2 MB |
| Events in quadrant A | 2,980,116 | 651,003 |
| Events in quadrant B | 2,634,814 | 672,652 |
| Events in quadrant C | 2,669,115 | 647,042 |
| Events in quadrant D | 4,149,276 | 562,226 |
| Mode SS | |||
|---|---|---|---|
| Quadrant | BADHDUFLAG | Total packets | Discarded packets |
| A | 0 | 108 | 0 |
| B | 0 | 108 | 0 |
| C | 0 | 108 | 0 |
| D | 0 | 108 | 0 |
| Mode M0 | |||
|---|---|---|---|
| Quadrant | BADHDUFLAG | Total packets | Discarded packets |
| A | 0 | 12106 | 3 |
| B | 0 | 11135 | 2 |
| C | 0 | 11008 | 2 |
| D | 0 | 15827 | 2 |
| Mode M9 | |||
|---|---|---|---|
| Quadrant | BADHDUFLAG | Total packets | Discarded packets |
| A | 0 | 40 | 0 |
| B | 0 | 40 | 0 |
| C | 0 | 40 | 0 |
| D | 0 | 40 | 0 |
| Quadrant | Total seconds | Saturated seconds | Saturation percentage |
|---|---|---|---|
| A | 5183 | 44 | 0.848929% |
| B | 5183 | 16 | 0.308702% |
| C | 5183 | 12 | 0.231526% |
| D | 5183 | 382 | 7.370249% |
Noise dominated data is calculated using 1-second bins in cleaned event files. If a bin has >2000 counts, and if more than 50% of those come from <1% of pixels, then it is considered to be noise-dominated and hence unusable.
| Quadrant | # 1 sec bins | Bins with >0 counts | Bins with >2000 counts | High rate bins dominated by noise | Noise dominated (total time) | Noise dominated (detector-on time) | Marked lightcurve |
|---|---|---|---|---|---|---|---|
| A | 9158 | 5185 | 16 | 16 | 0.17% | 0.31% | 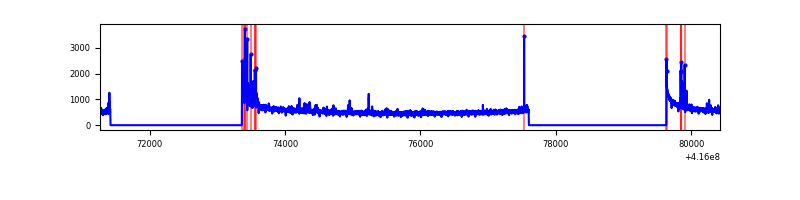 |
| B | 9158 | 5185 | 5 | 5 | 0.05% | 0.10% | 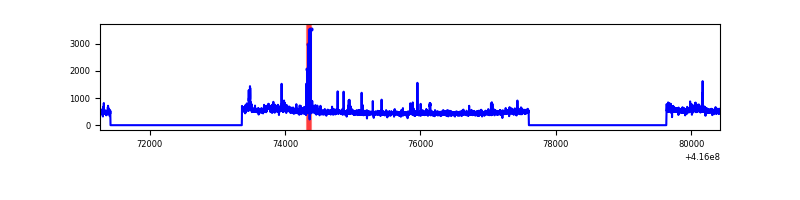 |
| C | 9158 | 5185 | 3 | 3 | 0.03% | 0.06% | 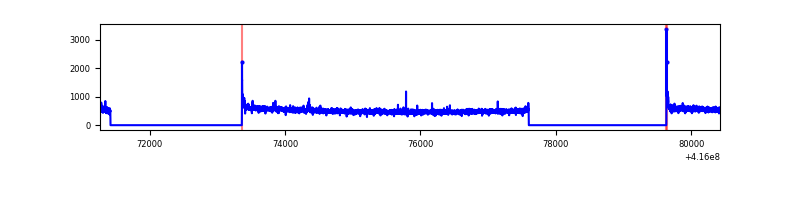 |
| D | 9158 | 5185 | 334 | 334 | 3.65% | 6.44% | 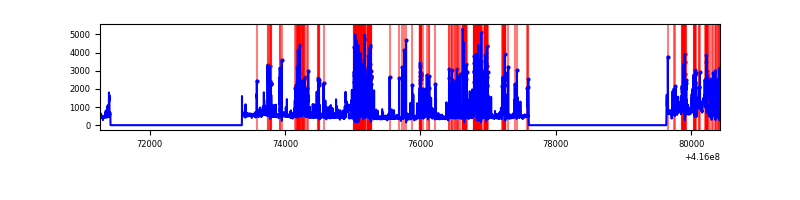 |
Top three noisy pixels from each quadrant. If the there are fewer than three noisy pixels in the level2.evt file, extra rows are filled as -1
| Pixel properties | Quadrant properties | ||||||
|---|---|---|---|---|---|---|---|
| Quadrant | DetID | PixID | Counts | Sigma | Mean | Median | Sigma |
| A | 10 | 83 | 469572 | 3782.51 | 611 | 599 | 124.0 |
| A | 13 | 248 | 106260 | 852.21 | 611 | 599 | 124.0 |
| A | 6 | 10 | 15209 | 117.84 | 611 | 599 | 124.0 |
| B | 7 | 202 | 79197 | 675.42 | 612 | 596 | 116.4 |
| B | 0 | 245 | 66231 | 564.0 | 612 | 596 | 116.4 |
| B | 5 | 255 | 56817 | 483.11 | 612 | 596 | 116.4 |
| C | 15 | 214 | 225082 | 1594.38 | 609 | 613 | 140.8 |
| C | 9 | 54 | 27651 | 192.05 | 609 | 613 | 140.8 |
| C | 0 | 10 | 26247 | 182.08 | 609 | 613 | 140.8 |
| D | 12 | 227 | 1381653 | 9711.21 | 585 | 569 | 142.2 |
| D | 1 | 47 | 128057 | 896.44 | 585 | 569 | 142.2 |
| D | 13 | 249 | 112235 | 785.19 | 585 | 569 | 142.2 |
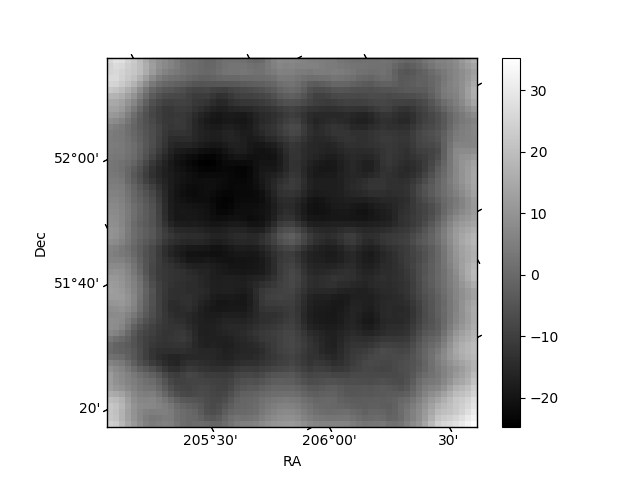
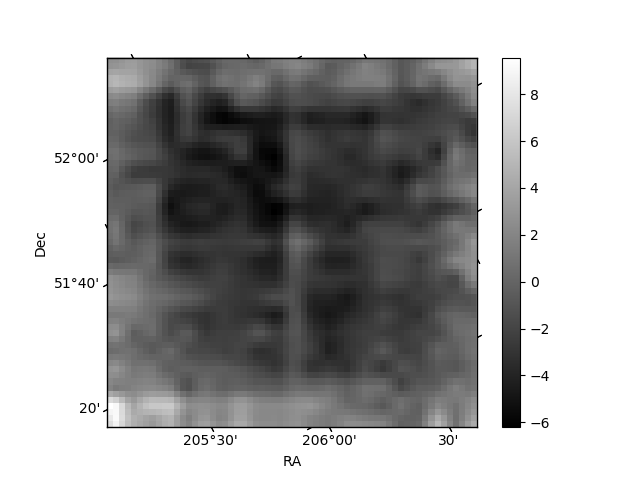
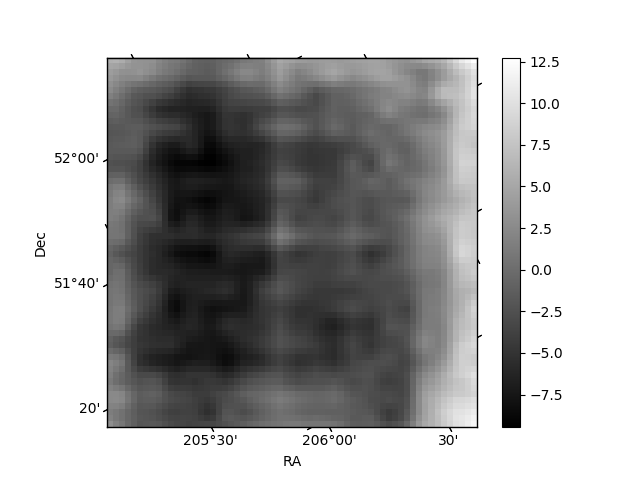
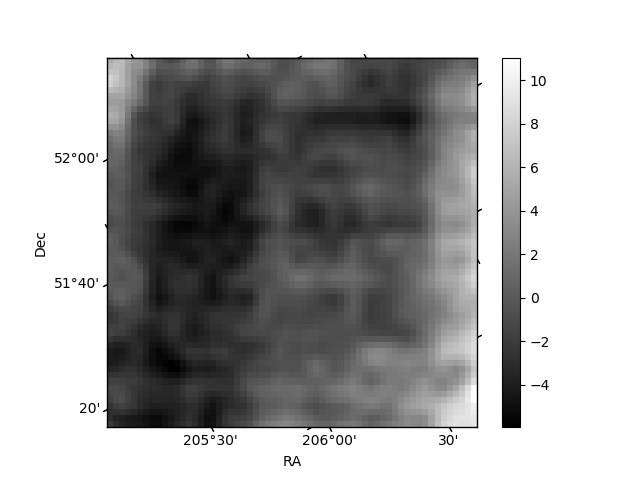
Histogram calculated using DETX and DETY for each event in the final _common_clean file
| Quadrant A | 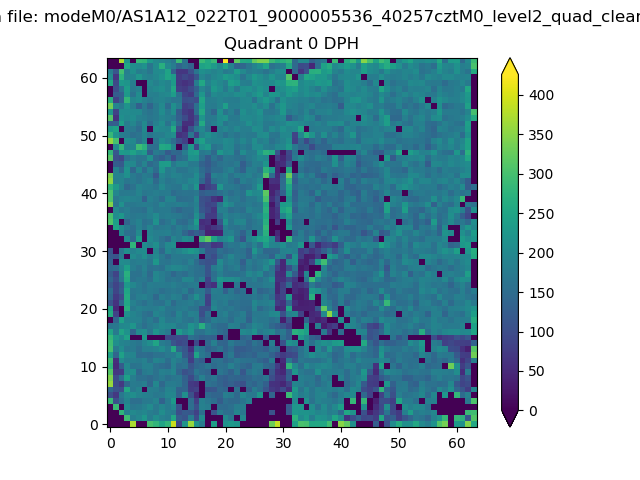 |
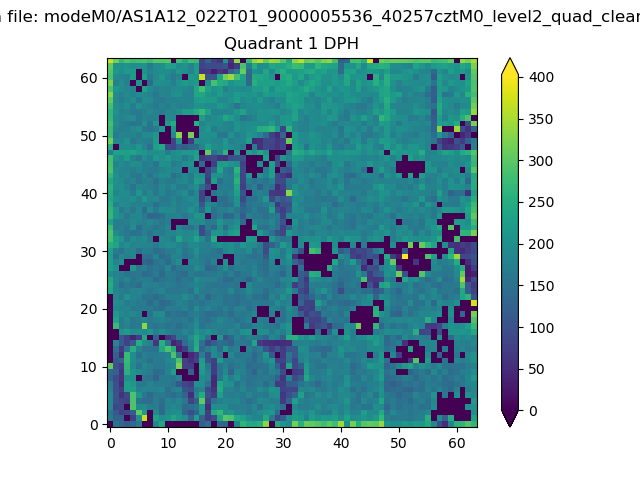 |
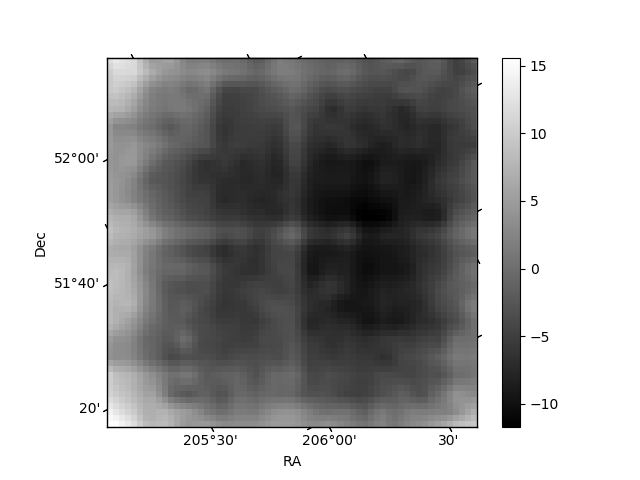
Quadrant B |
|---|---|---|---|
| Quadrant D | 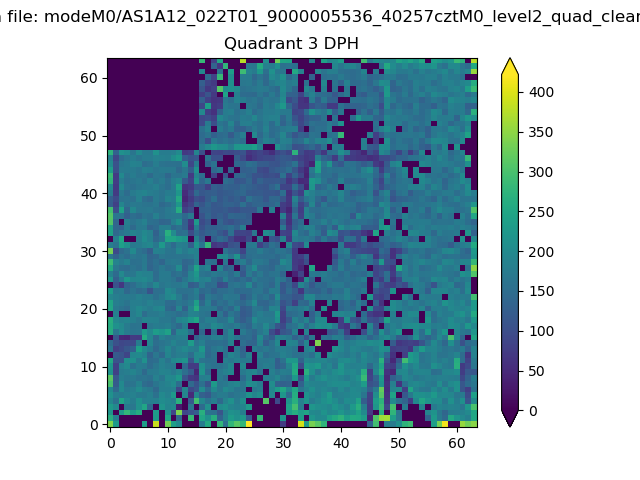 |
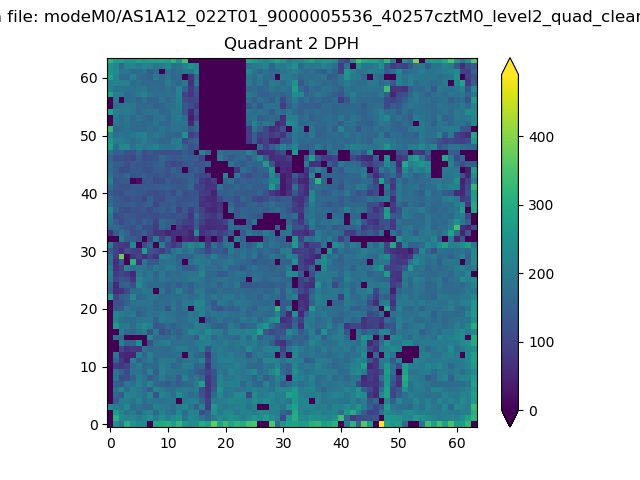 |
Quadrant C |
| Plot type | Count rate plots | Images |
|---|---|---|
| Comparison with Poisson distribution Blue bars denote a histogram of data divided into 1 sec bins. Red curve is a Poisson curve with rate = median count rate of data. |
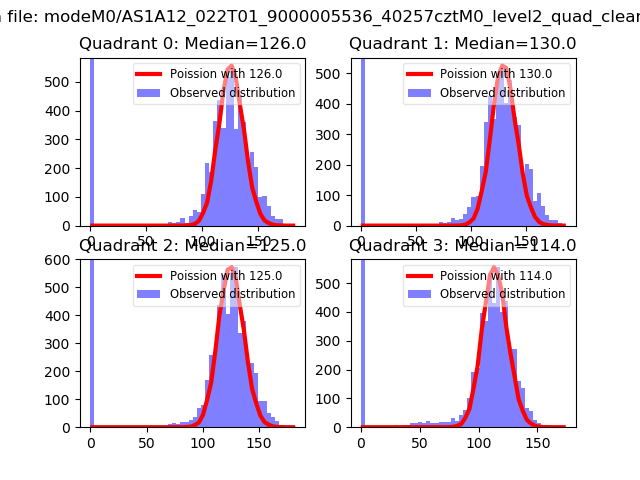 |
 |
| Quadrant-wise count rates Data is divided into 100 sec bins |
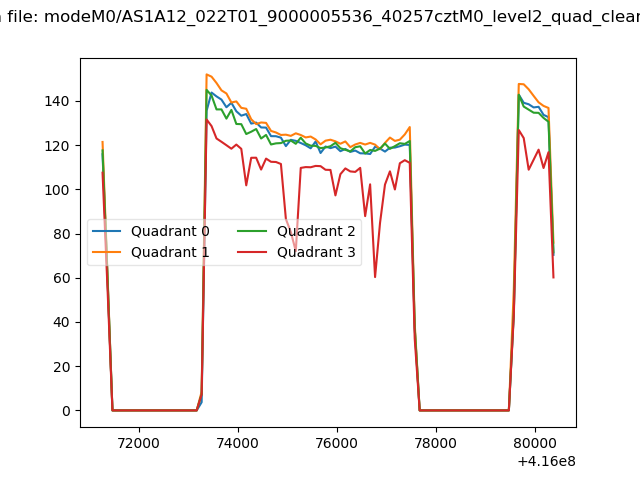 |
|
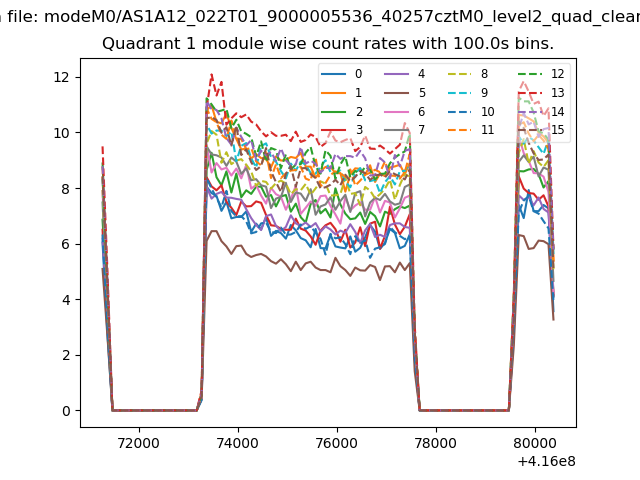
| Module-wise count rates for Quadrant A Data is divided into 100 sec bins |
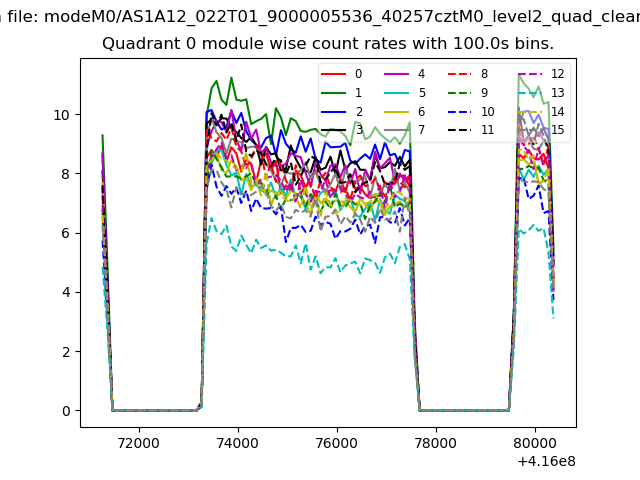 |
 |
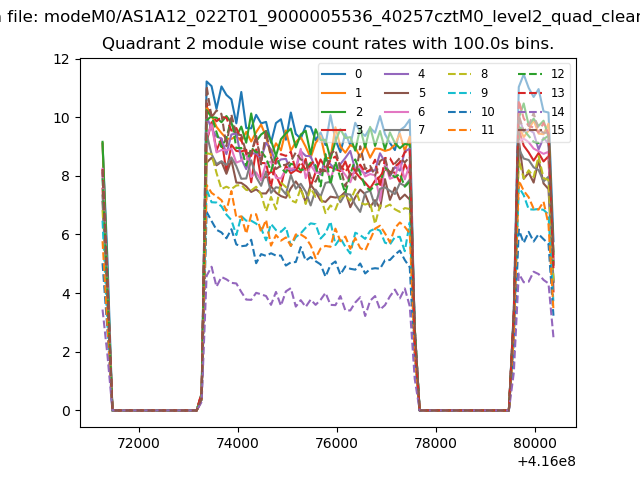
| Module-wise count rates for Quadrant B Data is divided into 100 sec bins |
 |
 |
| Module-wise count rates for Quadrant C Data is divided into 100 sec bins |
 |
 |
| Module-wise count rates for Quadrant D Data is divided into 100 sec bins |
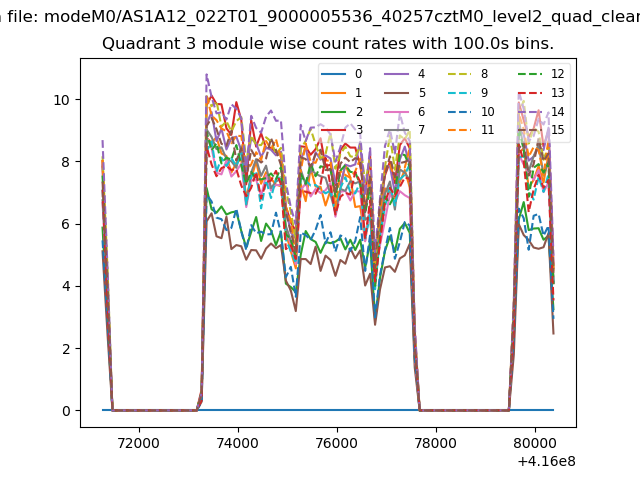 |
 |
| Parameter | Plot |
|---|---|
| CZT HV Monitor | 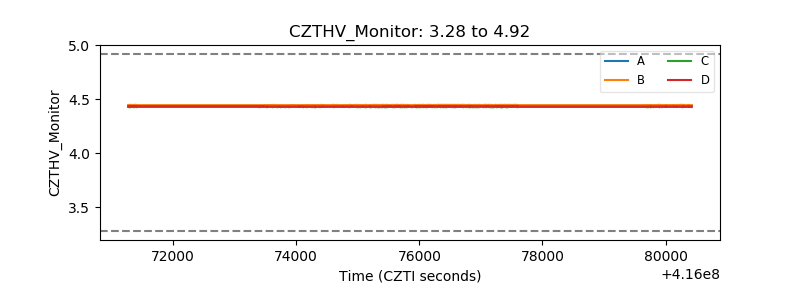 |
| D_VDD | 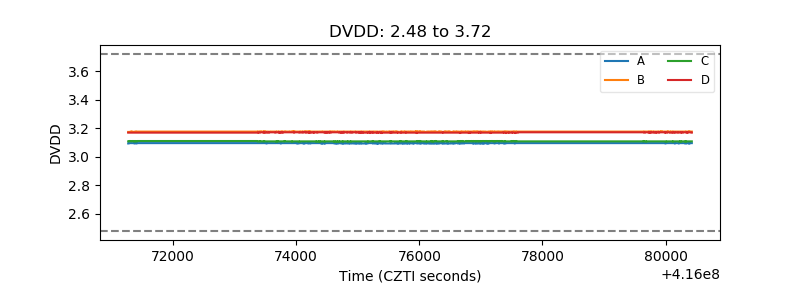 |
| Temperature 1 | 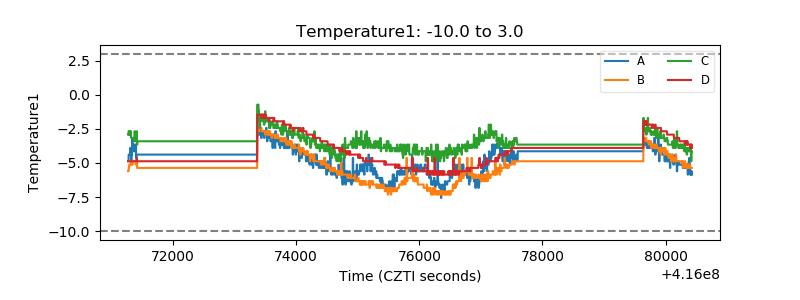 |
| Veto HV Monitor | 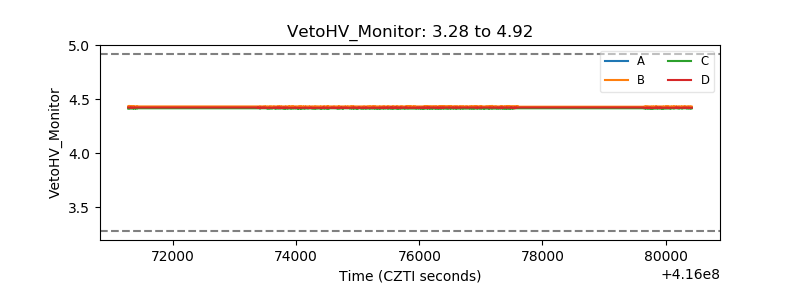 |
| Veto LLD | 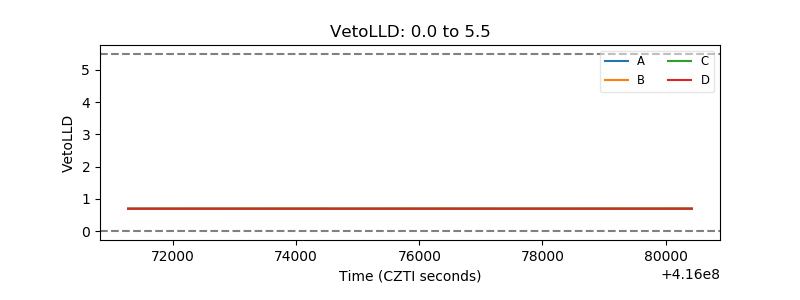 |
| Alpha Counter | 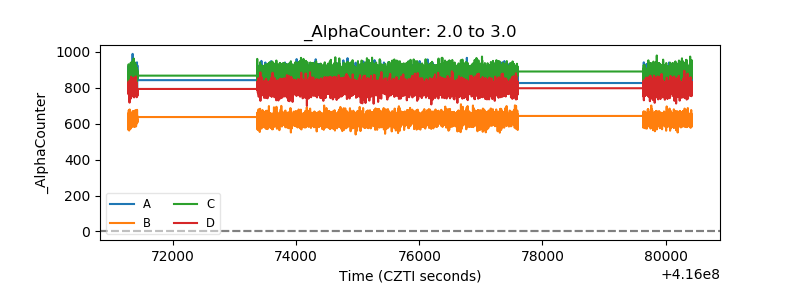 |
| _CPM_Rate | 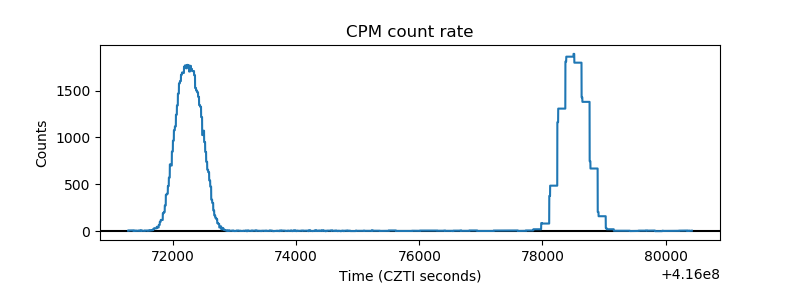 |
| CZT Counter | 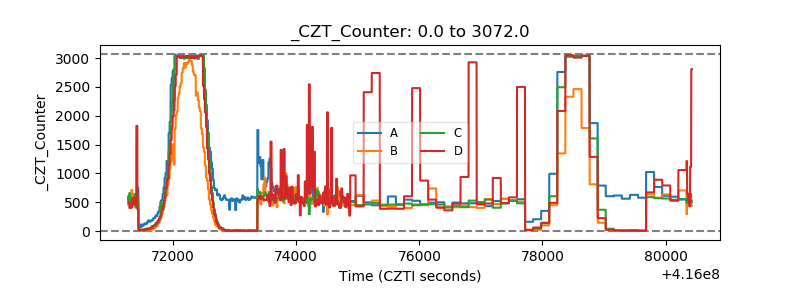 |
| +2.5 Volts monitor | 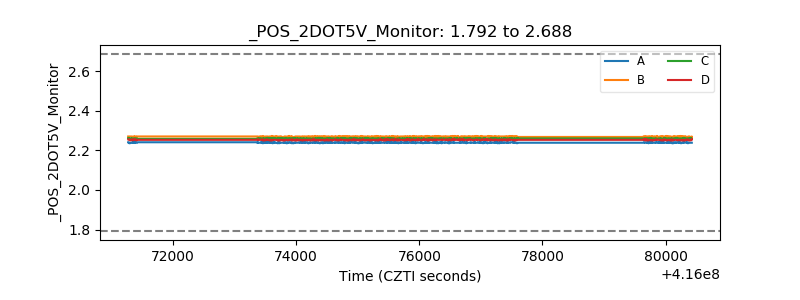 |
| +5 Volts monitor | 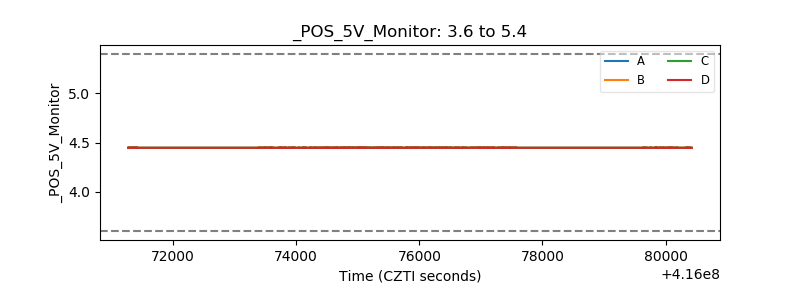 |
| _ROLL_ROT | 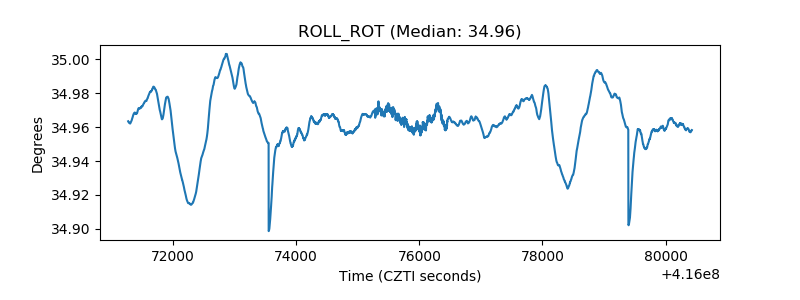 |
| _Roll_DEC | 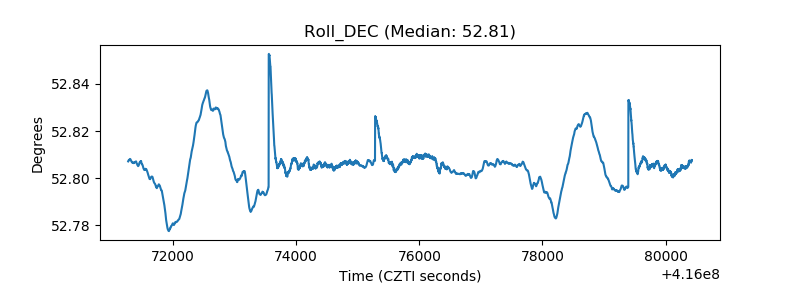 |
| _Roll_RA | 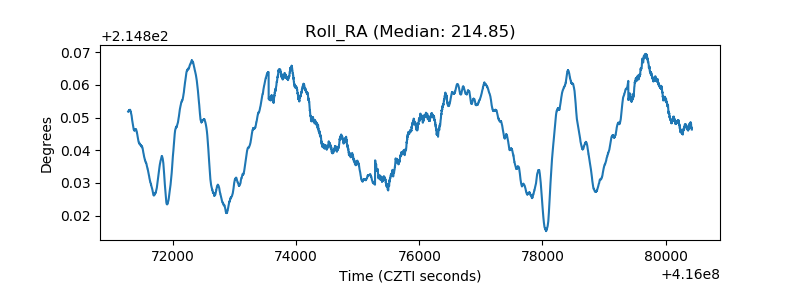 |
| Veto Counter | 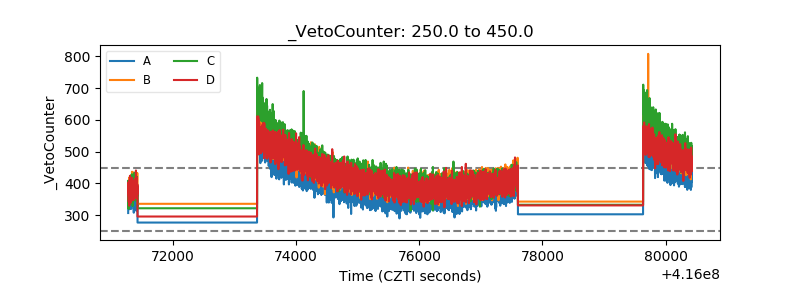 |