| Param | Original file | Final file |
|---|---|---|
| Filename | modeM0/AS1A12_022T01_9000005536_40258cztM0_level2.fits | modeM0/AS1A12_022T01_9000005536_40258cztM0_level2_quad_clean.evt |
| Size (bytes) | 359,948,160 | 88,943,040 |
| Size | 343.3 MB | 84.8 MB |
| Events in quadrant A | 2,830,254 | 607,432 |
| Events in quadrant B | 2,419,322 | 634,915 |
| Events in quadrant C | 2,486,211 | 613,926 |
| Events in quadrant D | 5,204,757 | 491,664 |
| Mode SS | |||
|---|---|---|---|
| Quadrant | BADHDUFLAG | Total packets | Discarded packets |
| A | 0 | 100 | 0 |
| B | 0 | 100 | 0 |
| C | 0 | 100 | 0 |
| D | 0 | 100 | 0 |
| Mode M0 | |||
|---|---|---|---|
| Quadrant | BADHDUFLAG | Total packets | Discarded packets |
| A | 0 | 11490 | 3 |
| B | 0 | 10331 | 2 |
| C | 0 | 10288 | 2 |
| D | 0 | 18841 | 2 |
| Mode M9 | |||
|---|---|---|---|
| Quadrant | BADHDUFLAG | Total packets | Discarded packets |
| A | 0 | 38 | 0 |
| B | 0 | 38 | 0 |
| C | 0 | 38 | 0 |
| D | 0 | 39 | 0 |
| Quadrant | Total seconds | Saturated seconds | Saturation percentage |
|---|---|---|---|
| A | 4925 | 44 | 0.893401% |
| B | 4925 | 9 | 0.182741% |
| C | 4925 | 14 | 0.284264% |
| D | 4925 | 787 | 15.979695% |
Noise dominated data is calculated using 1-second bins in cleaned event files. If a bin has >2000 counts, and if more than 50% of those come from <1% of pixels, then it is considered to be noise-dominated and hence unusable.
| Quadrant | # 1 sec bins | Bins with >0 counts | Bins with >2000 counts | High rate bins dominated by noise | Noise dominated (total time) | Noise dominated (detector-on time) | Marked lightcurve |
|---|---|---|---|---|---|---|---|
| A | 7048 | 4926 | 26 | 26 | 0.37% | 0.53% | 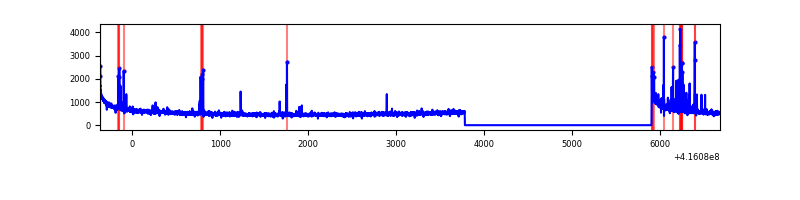 |
| B | 7048 | 4926 | 3 | 3 | 0.04% | 0.06% | 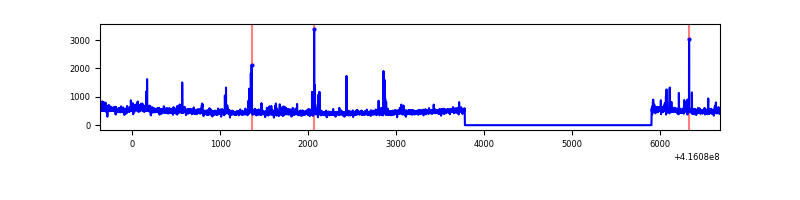 |
| C | 7048 | 4926 | 6 | 6 | 0.09% | 0.12% | 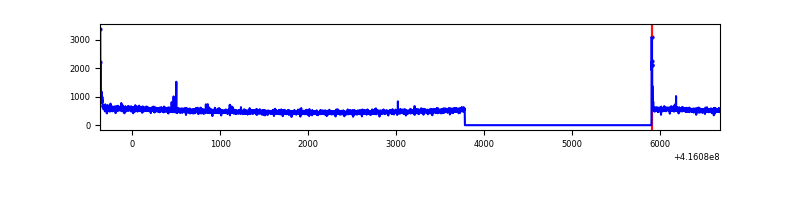 |
| D | 7048 | 4926 | 735 | 735 | 10.43% | 14.92% | 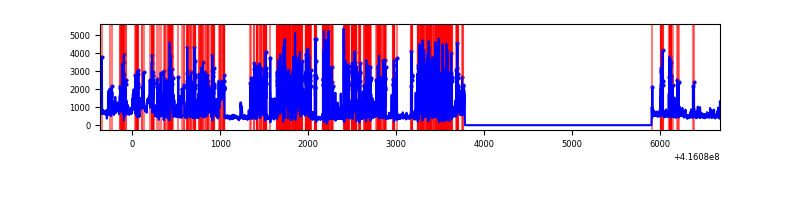 |
Top three noisy pixels from each quadrant. If the there are fewer than three noisy pixels in the level2.evt file, extra rows are filled as -1
| Pixel properties | Quadrant properties | ||||||
|---|---|---|---|---|---|---|---|
| Quadrant | DetID | PixID | Counts | Sigma | Mean | Median | Sigma |
| A | 10 | 83 | 436925 | 3765.65 | 566 | 554 | 115.9 |
| A | 13 | 248 | 170728 | 1468.51 | 566 | 554 | 115.9 |
| A | 13 | 6 | 15503 | 129.0 | 566 | 554 | 115.9 |
| B | 0 | 245 | 85081 | 765.67 | 573 | 557 | 110.4 |
| B | 5 | 255 | 59035 | 529.73 | 573 | 557 | 110.4 |
| B | 0 | 230 | 17600 | 154.39 | 573 | 557 | 110.4 |
| C | 15 | 214 | 215323 | 1622.16 | 570 | 575 | 132.4 |
| C | 0 | 10 | 26362 | 194.79 | 570 | 575 | 132.4 |
| C | 9 | 54 | 9032 | 63.88 | 570 | 575 | 132.4 |
| D | 12 | 227 | 2761775 | 21742.52 | 519 | 505 | 127.0 |
| D | 13 | 249 | 245353 | 1927.96 | 519 | 505 | 127.0 |
| D | 13 | 171 | 70980 | 554.93 | 519 | 505 | 127.0 |
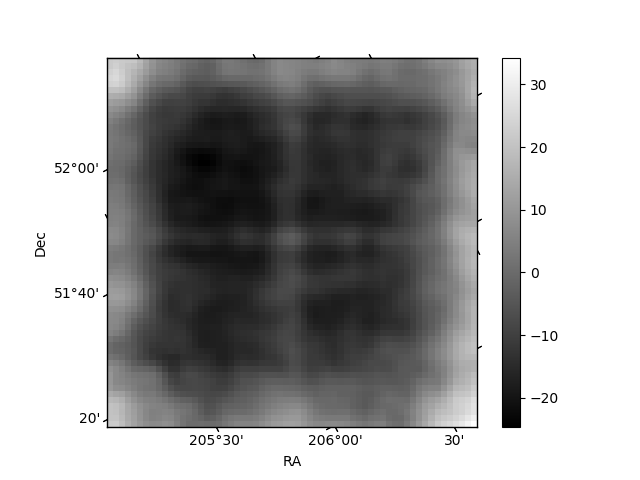
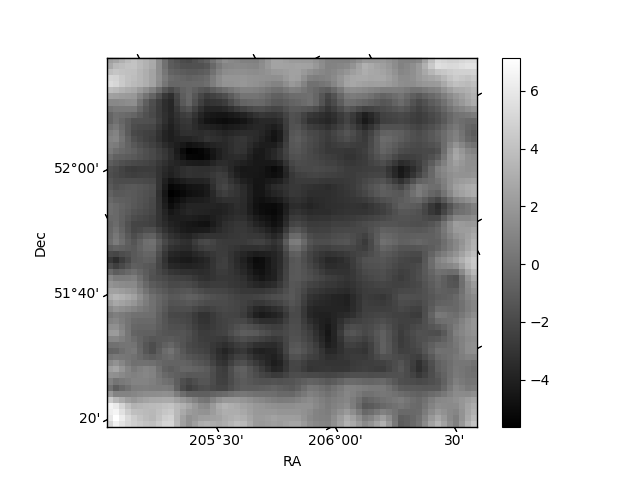
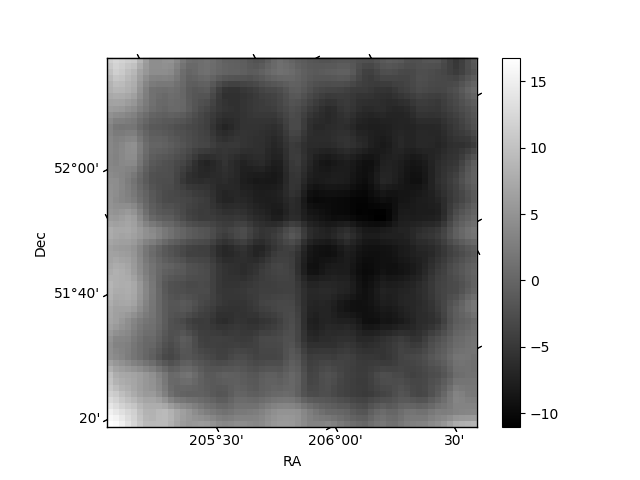
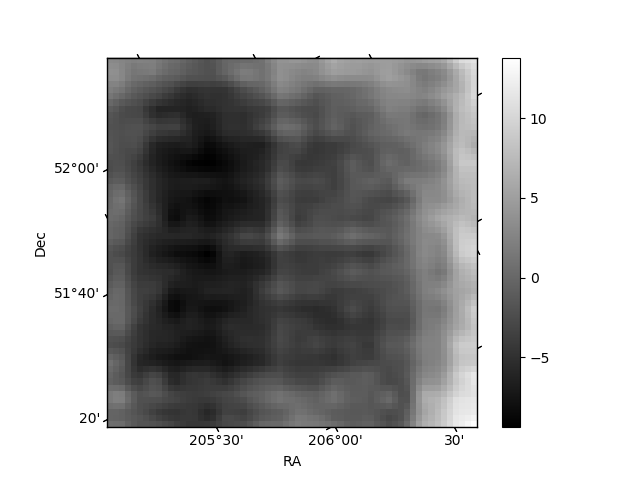
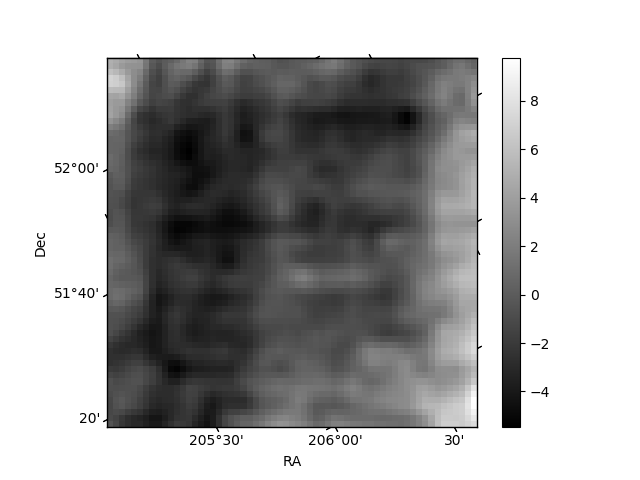
Histogram calculated using DETX and DETY for each event in the final _common_clean file
| Quadrant A | 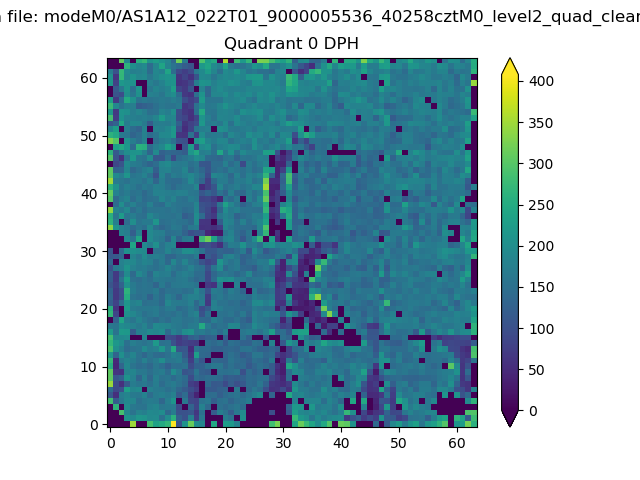 |
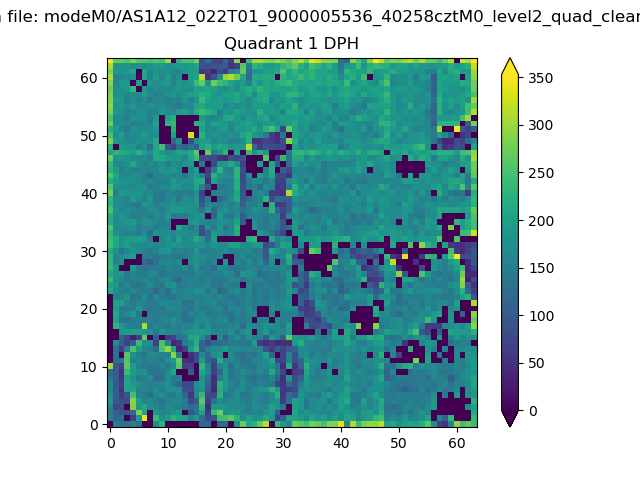 |
Quadrant B |
|---|---|---|---|
| Quadrant D | 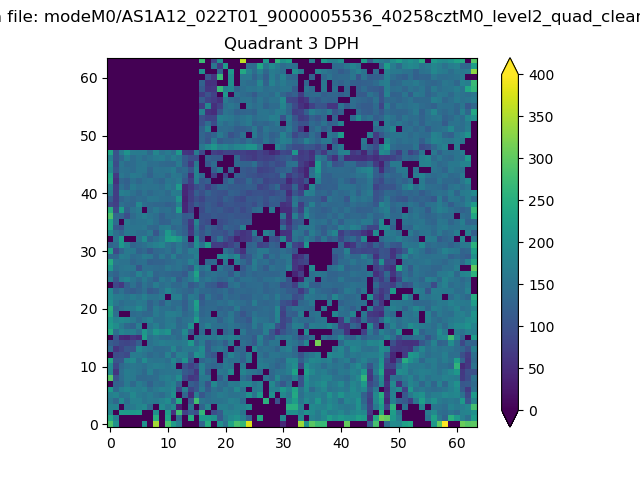 |
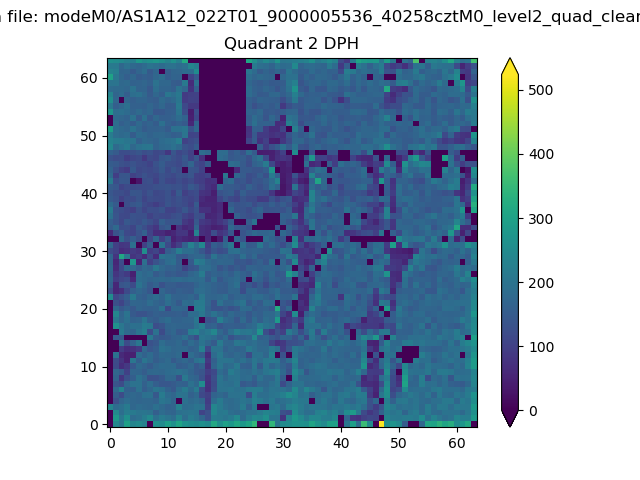 |
Quadrant C |
| Plot type | Count rate plots | Images |
|---|---|---|
| Comparison with Poisson distribution Blue bars denote a histogram of data divided into 1 sec bins. Red curve is a Poisson curve with rate = median count rate of data. |
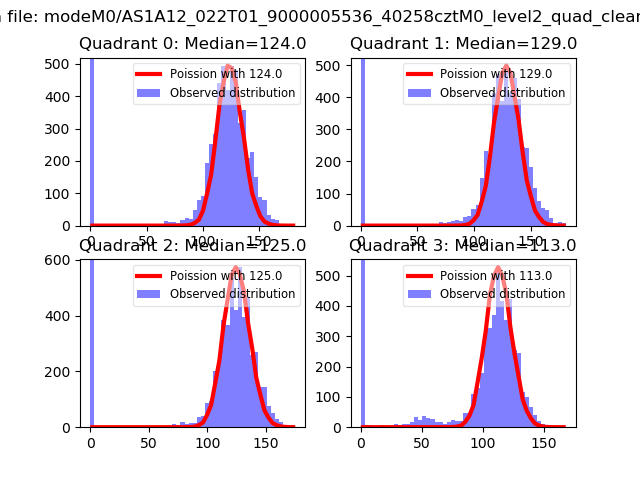 |
 |
| Quadrant-wise count rates Data is divided into 100 sec bins |
 |
|
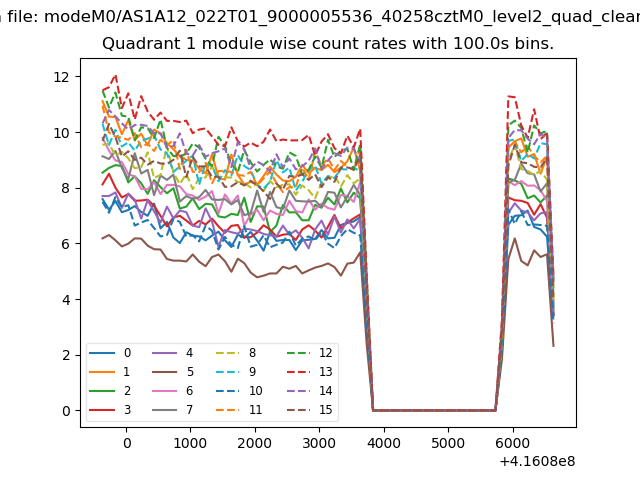
| Module-wise count rates for Quadrant A Data is divided into 100 sec bins |
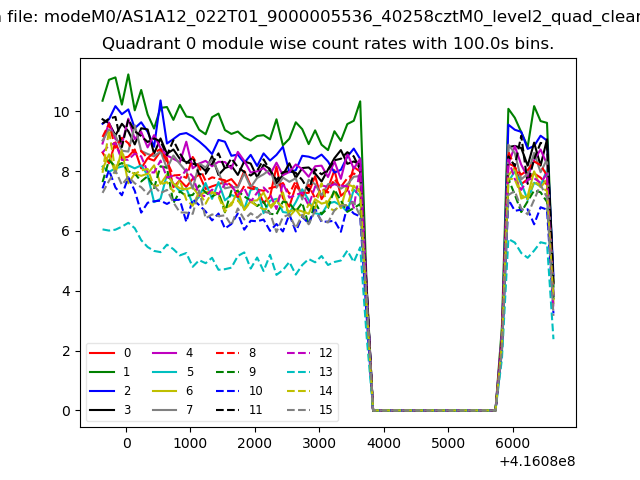 |
 |
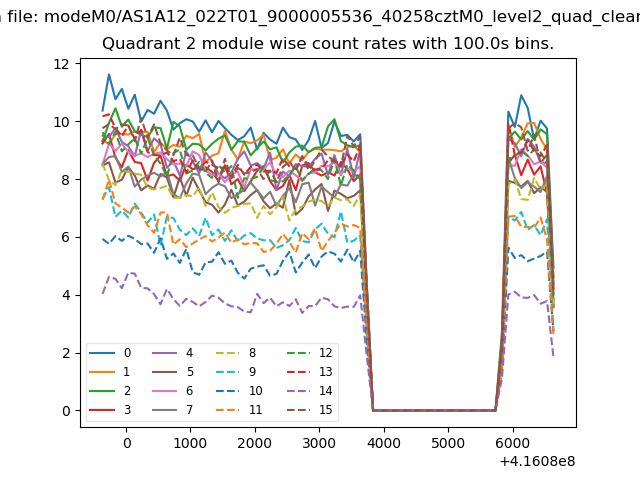
| Module-wise count rates for Quadrant B Data is divided into 100 sec bins |
 |
 |
| Module-wise count rates for Quadrant C Data is divided into 100 sec bins |
 |
 |
| Module-wise count rates for Quadrant D Data is divided into 100 sec bins |
 |
 |
| Parameter | Plot |
|---|---|
| CZT HV Monitor | 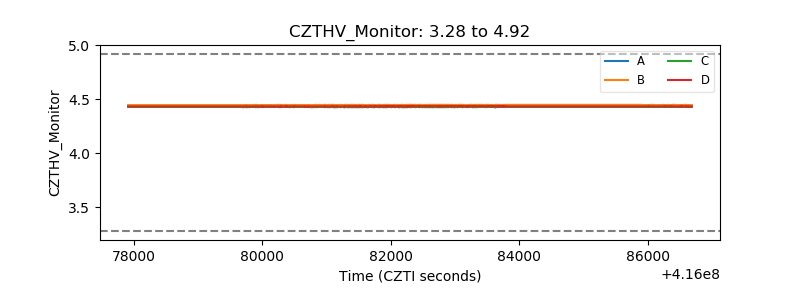 |
| D_VDD | 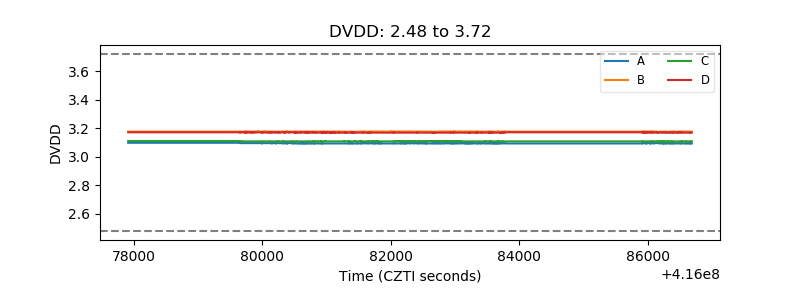 |
| Temperature 1 | 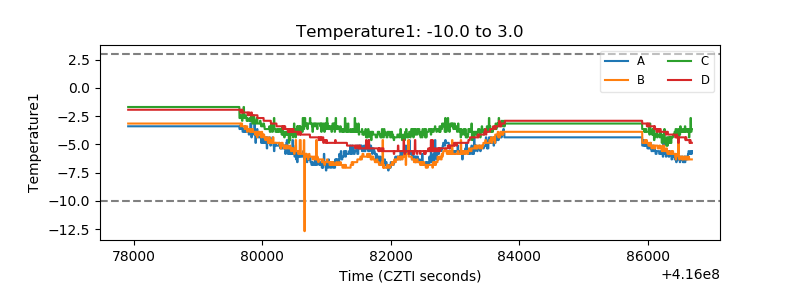 |
| Veto HV Monitor | 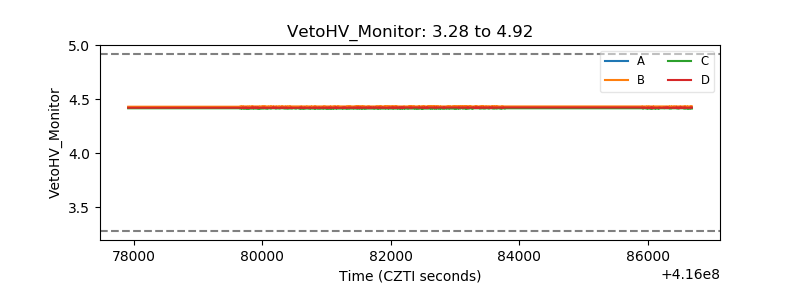 |
| Veto LLD | 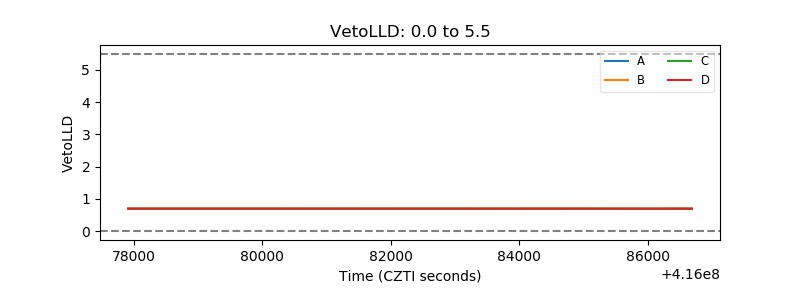 |
| Alpha Counter | 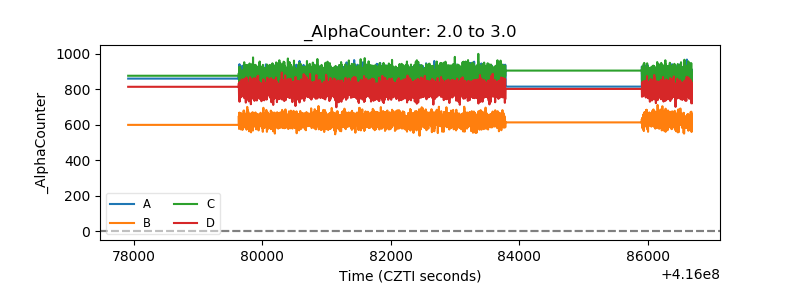 |
| _CPM_Rate | 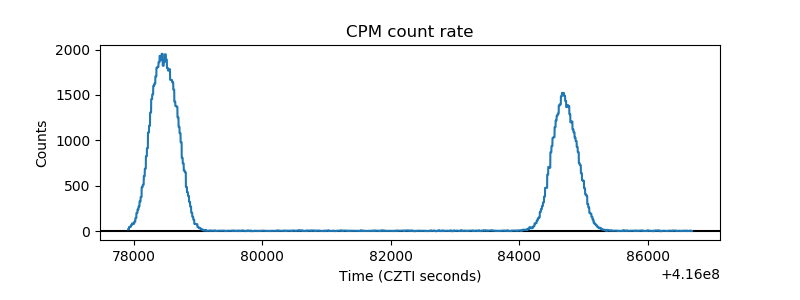 |
| CZT Counter | 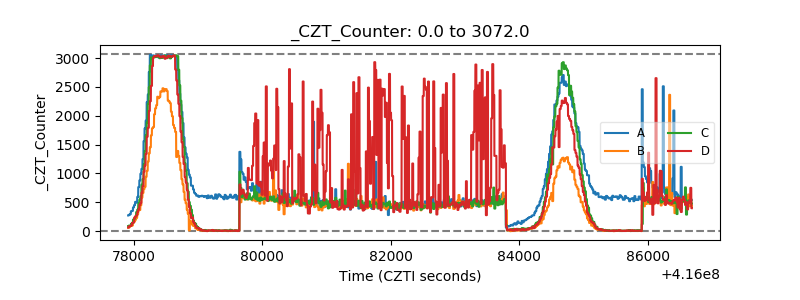 |
| +2.5 Volts monitor | 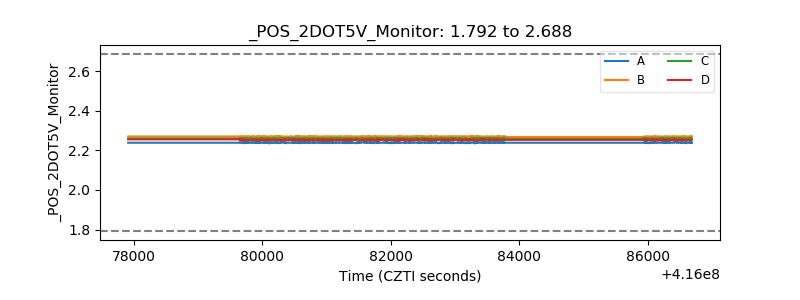 |
| +5 Volts monitor | 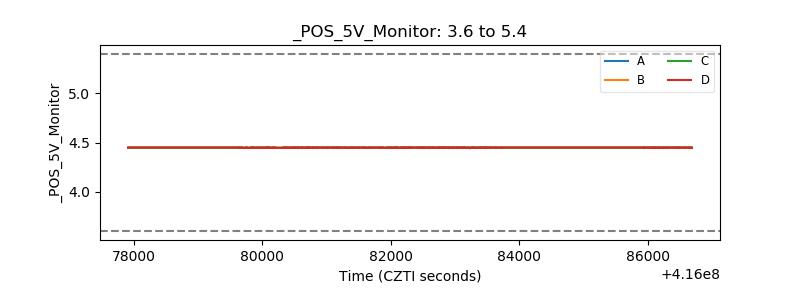 |
| _ROLL_ROT | 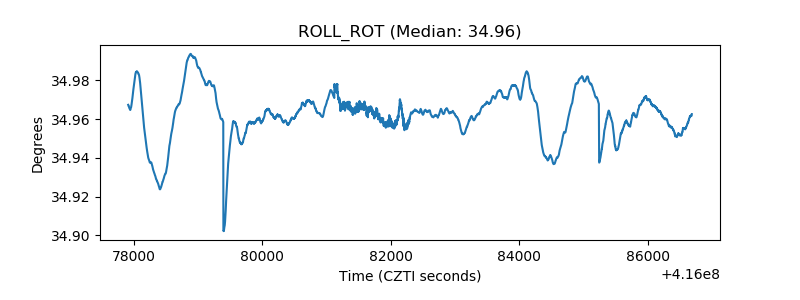 |
| _Roll_DEC | 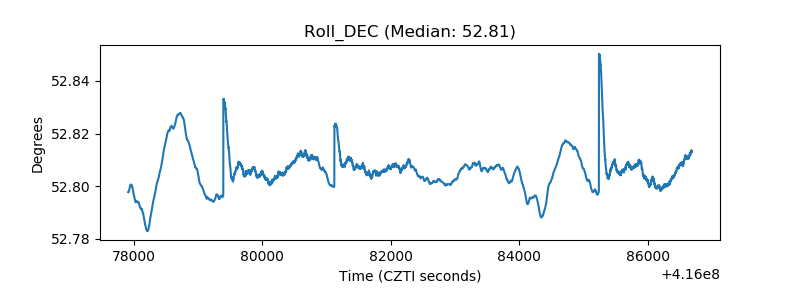 |
| _Roll_RA | 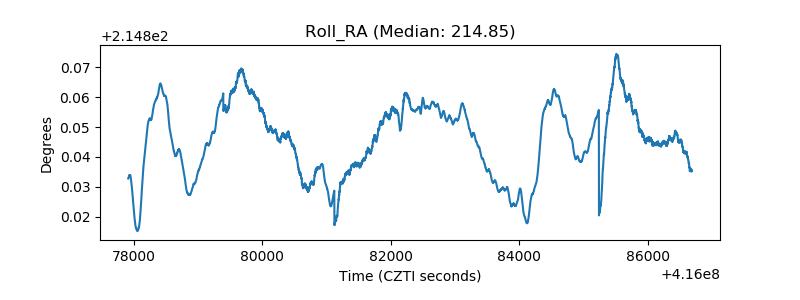 |
| Veto Counter | 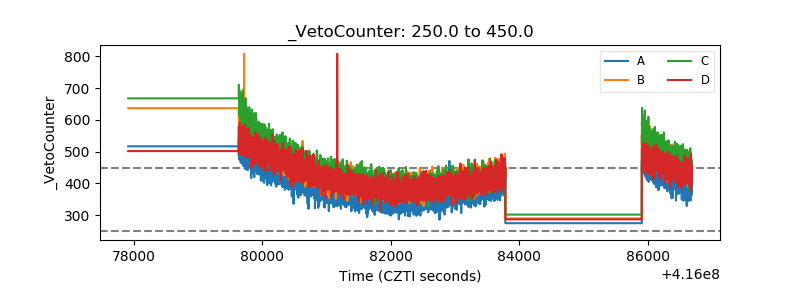 |