| Param | Original file | Final file |
|---|---|---|
| Filename | modeM0/AS1A12_022T01_9000005536_40259cztM0_level2.fits | modeM0/AS1A12_022T01_9000005536_40259cztM0_level2_quad_clean.evt |
| Size (bytes) | 312,606,720 | 93,136,320 |
| Size | 298.1 MB | 88.8 MB |
| Events in quadrant A | 2,991,957 | 617,478 |
| Events in quadrant B | 2,452,491 | 648,181 |
| Events in quadrant C | 2,624,921 | 627,762 |
| Events in quadrant D | 3,092,408 | 558,509 |
| Mode SS | |||
|---|---|---|---|
| Quadrant | BADHDUFLAG | Total packets | Discarded packets |
| A | 0 | 110 | 0 |
| B | 0 | 110 | 0 |
| C | 0 | 110 | 0 |
| D | 0 | 110 | 0 |
| Mode M0 | |||
|---|---|---|---|
| Quadrant | BADHDUFLAG | Total packets | Discarded packets |
| A | 0 | 12144 | 3 |
| B | 0 | 10836 | 2 |
| C | 0 | 11009 | 2 |
| D | 0 | 12893 | 2 |
| Mode M9 | |||
|---|---|---|---|
| Quadrant | BADHDUFLAG | Total packets | Discarded packets |
| A | 0 | 42 | 0 |
| B | 0 | 42 | 0 |
| C | 0 | 42 | 0 |
| D | 0 | 42 | 0 |
| Quadrant | Total seconds | Saturated seconds | Saturation percentage |
|---|---|---|---|
| A | 5257 | 72 | 1.369602% |
| B | 5257 | 9 | 0.171200% |
| C | 5257 | 15 | 0.285334% |
| D | 5257 | 198 | 3.766407% |
Noise dominated data is calculated using 1-second bins in cleaned event files. If a bin has >2000 counts, and if more than 50% of those come from <1% of pixels, then it is considered to be noise-dominated and hence unusable.
| Quadrant | # 1 sec bins | Bins with >0 counts | Bins with >2000 counts | High rate bins dominated by noise | Noise dominated (total time) | Noise dominated (detector-on time) | Marked lightcurve |
|---|---|---|---|---|---|---|---|
| A | 9533 | 5259 | 48 | 48 | 0.50% | 0.91% | 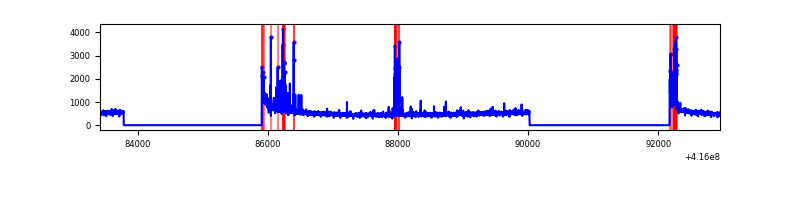 |
| B | 9533 | 5259 | 2 | 2 | 0.02% | 0.04% | 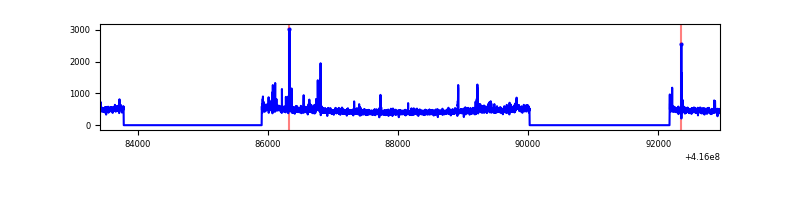 |
| C | 9533 | 5259 | 8 | 8 | 0.08% | 0.15% | 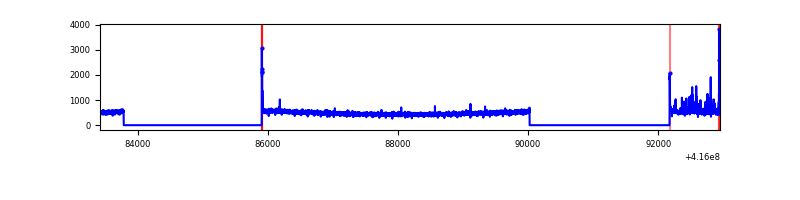 |
| D | 9533 | 5259 | 178 | 178 | 1.87% | 3.38% | 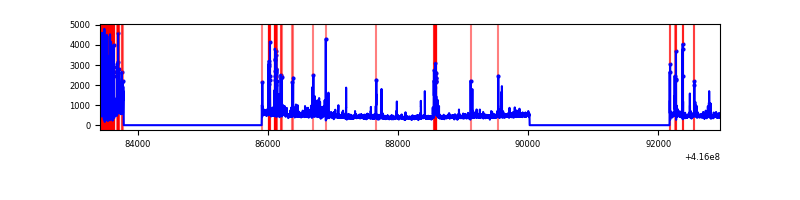 |
Top three noisy pixels from each quadrant. If the there are fewer than three noisy pixels in the level2.evt file, extra rows are filled as -1
| Pixel properties | Quadrant properties | ||||||
|---|---|---|---|---|---|---|---|
| Quadrant | DetID | PixID | Counts | Sigma | Mean | Median | Sigma |
| A | 10 | 83 | 445497 | 3729.53 | 584 | 573 | 119.3 |
| A | 13 | 248 | 254045 | 2124.7 | 584 | 573 | 119.3 |
| A | 13 | 6 | 16852 | 136.46 | 584 | 573 | 119.3 |
| B | 0 | 245 | 59831 | 519.04 | 593 | 576 | 114.2 |
| B | 5 | 255 | 53154 | 460.55 | 593 | 576 | 114.2 |
| B | 12 | 111 | 14111 | 118.56 | 593 | 576 | 114.2 |
| C | 15 | 214 | 228320 | 1659.01 | 588 | 592 | 137.3 |
| C | 14 | 254 | 74677 | 539.71 | 588 | 592 | 137.3 |
| C | 0 | 10 | 16114 | 113.08 | 588 | 592 | 137.3 |
| D | 12 | 227 | 516843 | 3686.66 | 569 | 553 | 140.0 |
| D | 13 | 249 | 226558 | 1613.83 | 569 | 553 | 140.0 |
| D | 9 | 19 | 123008 | 874.41 | 569 | 553 | 140.0 |
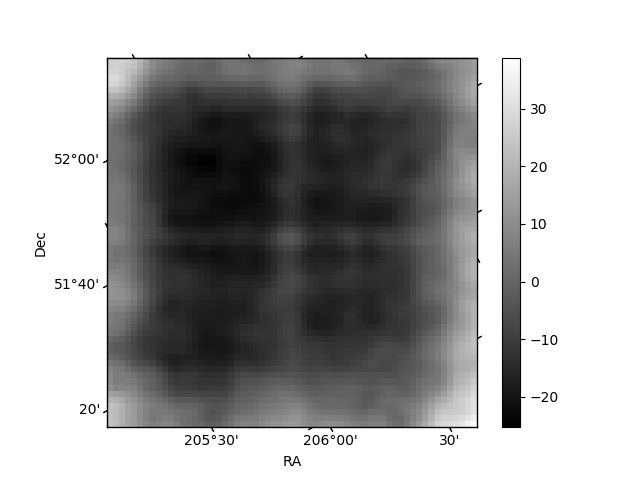
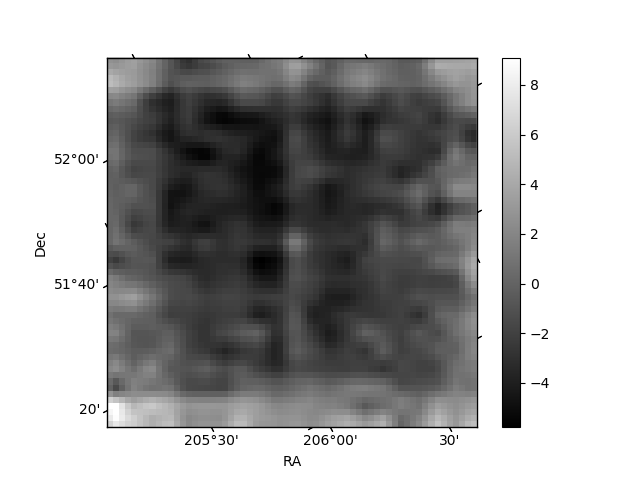
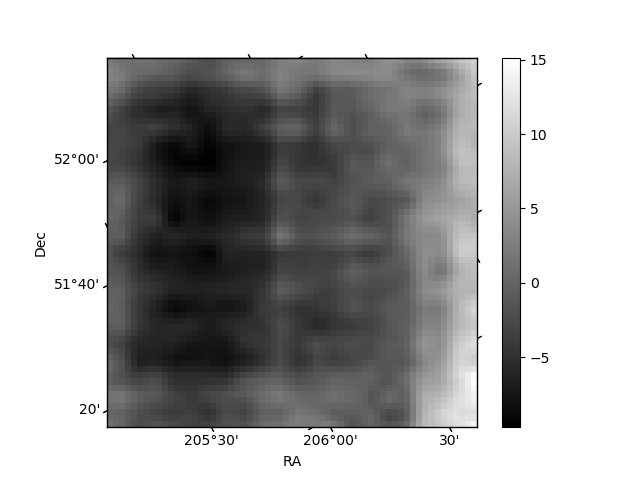
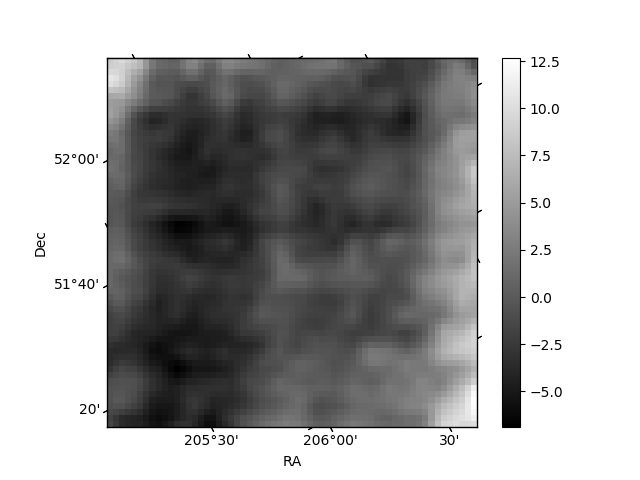
Histogram calculated using DETX and DETY for each event in the final _common_clean file
| Quadrant A | 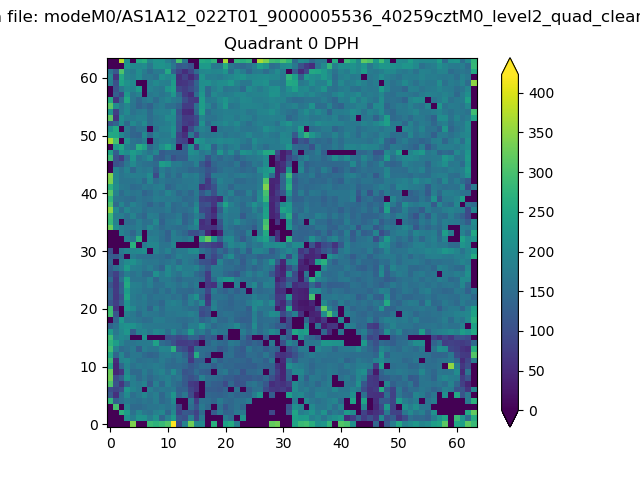 |
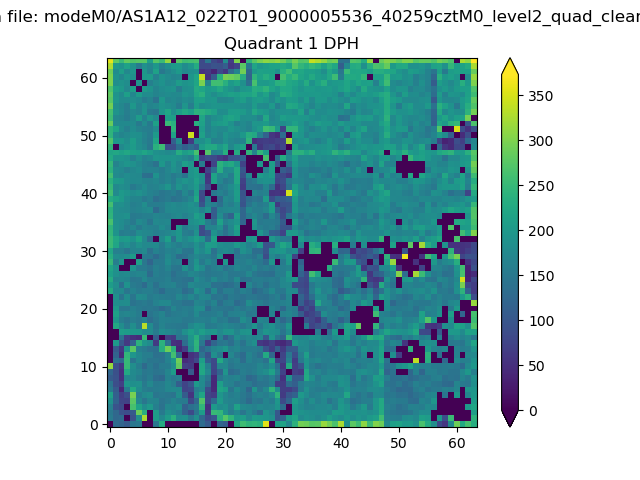 |
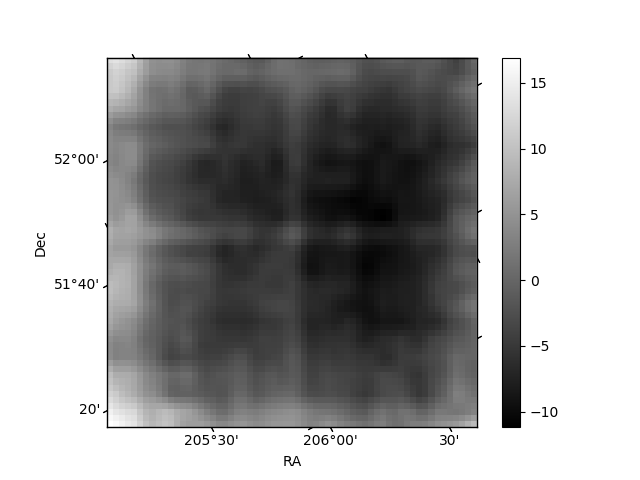
Quadrant B |
|---|---|---|---|
| Quadrant D | 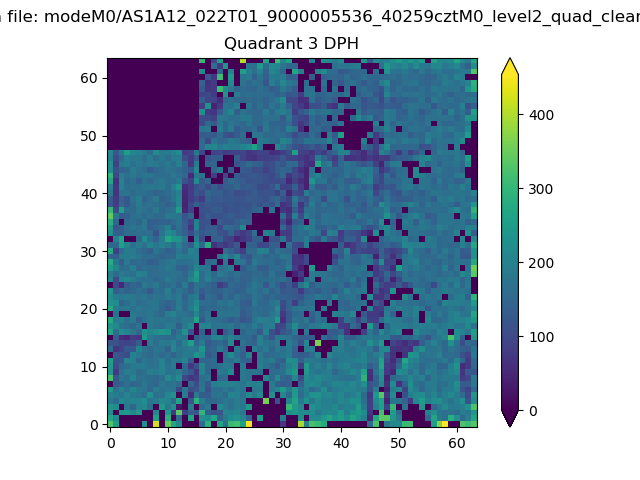 |
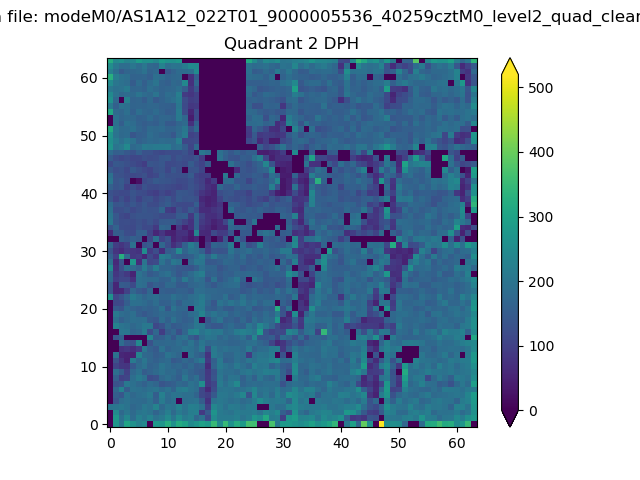 |
Quadrant C |
| Plot type | Count rate plots | Images |
|---|---|---|
| Comparison with Poisson distribution Blue bars denote a histogram of data divided into 1 sec bins. Red curve is a Poisson curve with rate = median count rate of data. |
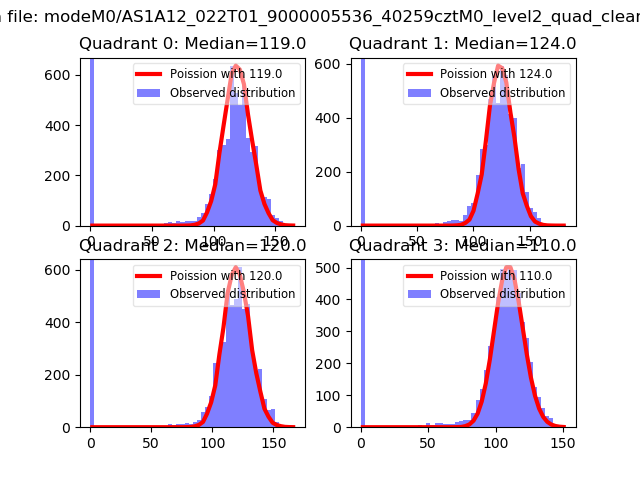 |
 |
| Quadrant-wise count rates Data is divided into 100 sec bins |
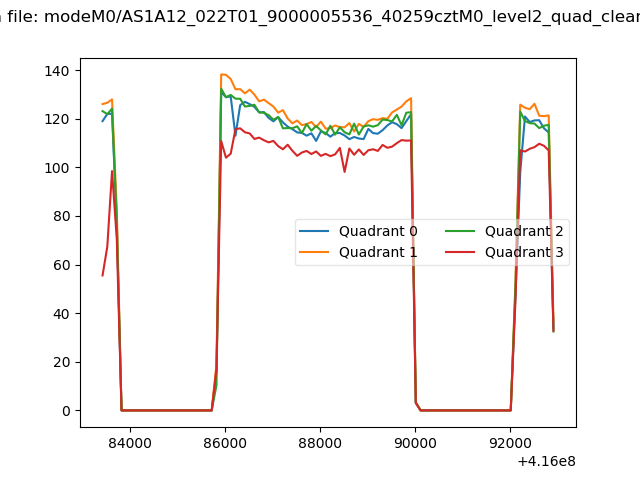 |
|
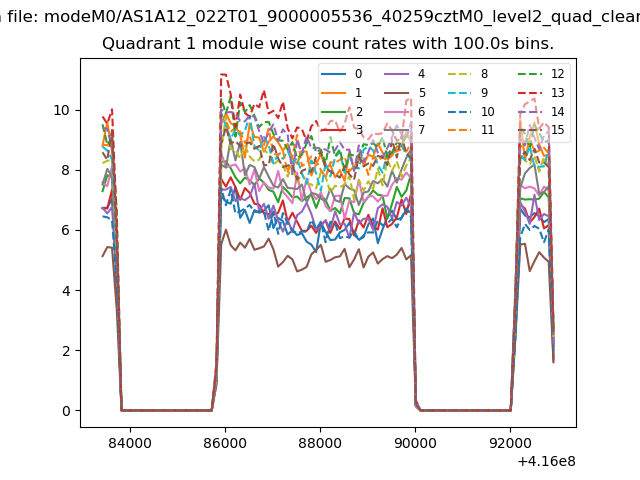
| Module-wise count rates for Quadrant A Data is divided into 100 sec bins |
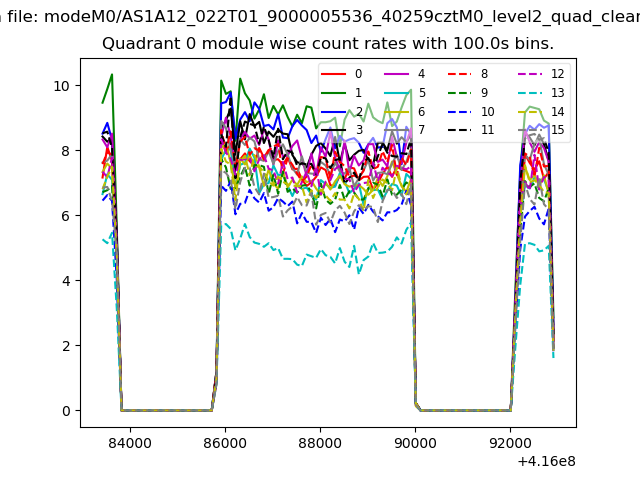 |
 |
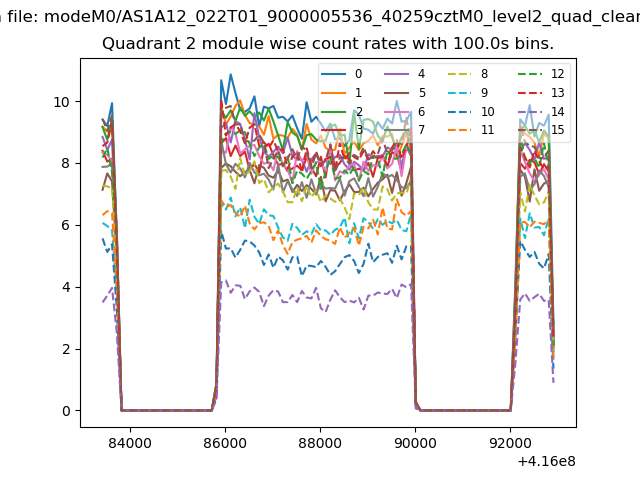
| Module-wise count rates for Quadrant B Data is divided into 100 sec bins |
 |
 |
| Module-wise count rates for Quadrant C Data is divided into 100 sec bins |
 |
 |
| Module-wise count rates for Quadrant D Data is divided into 100 sec bins |
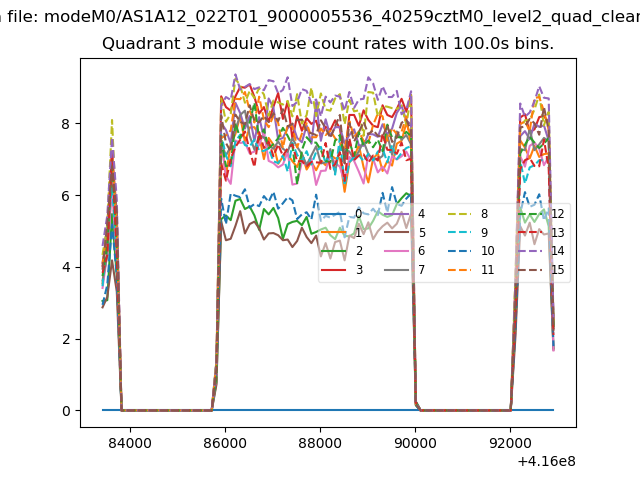 |
 |
| Parameter | Plot |
|---|---|
| CZT HV Monitor | 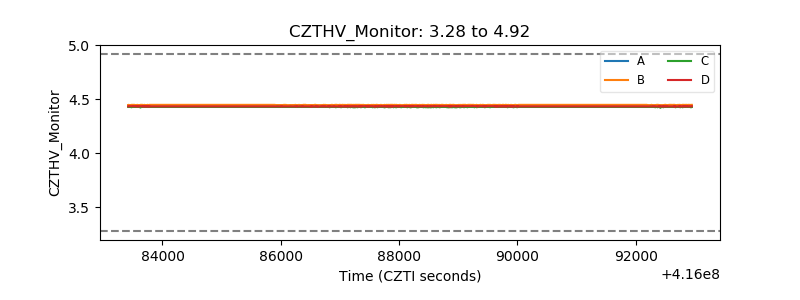 |
| D_VDD | 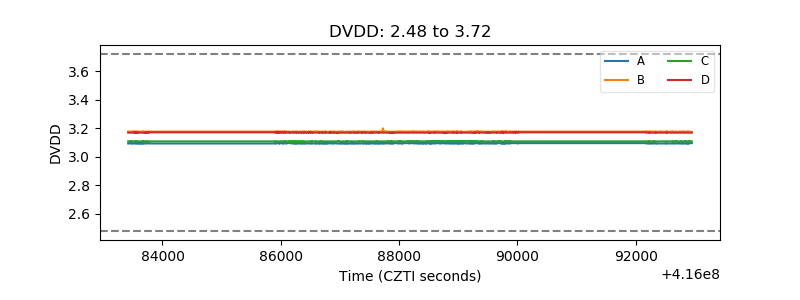 |
| Temperature 1 | 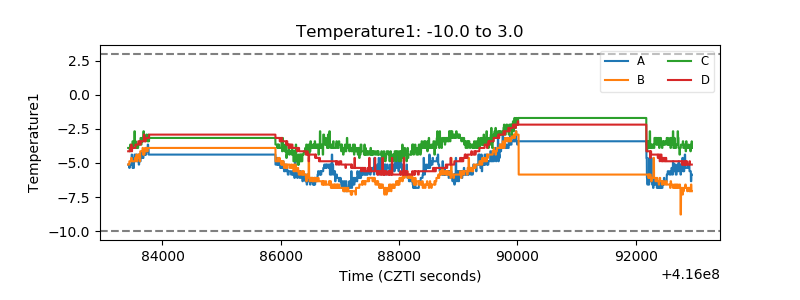 |
| Veto HV Monitor | 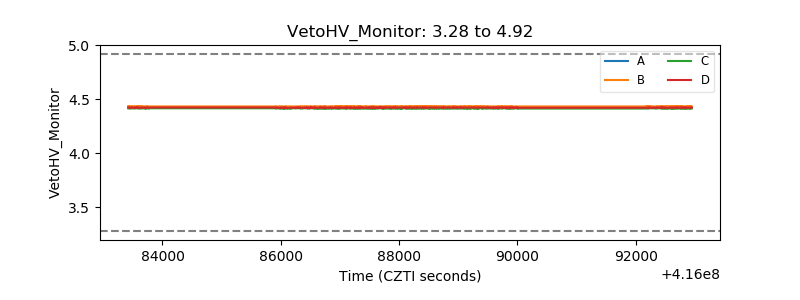 |
| Veto LLD | 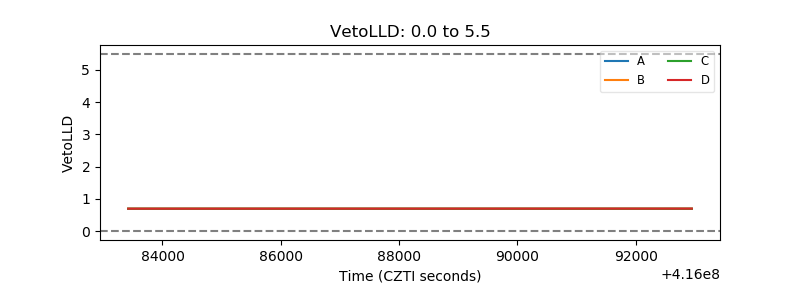 |
| Alpha Counter | 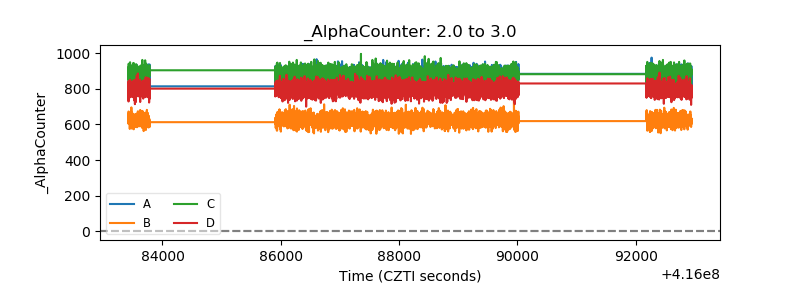 |
| _CPM_Rate | 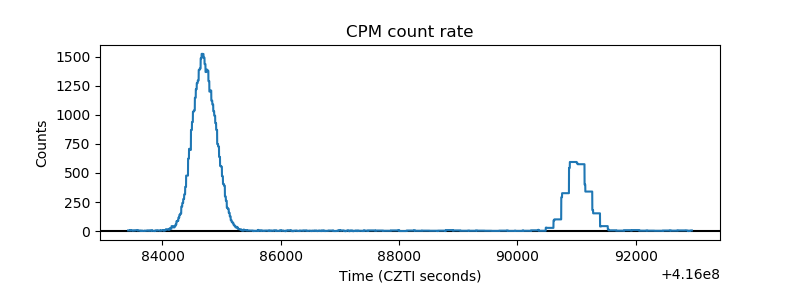 |
| CZT Counter | 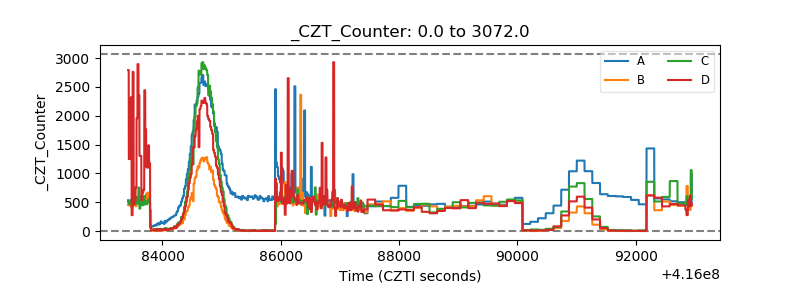 |
| +2.5 Volts monitor | 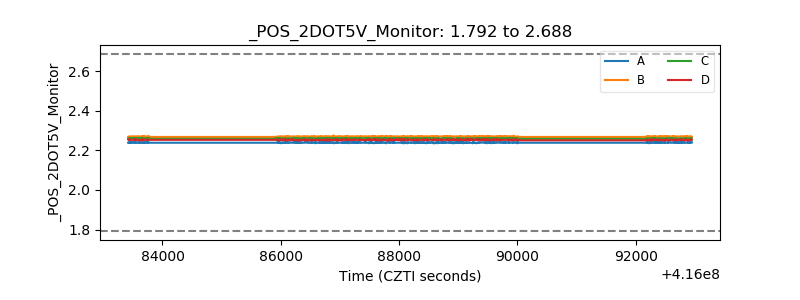 |
| +5 Volts monitor | 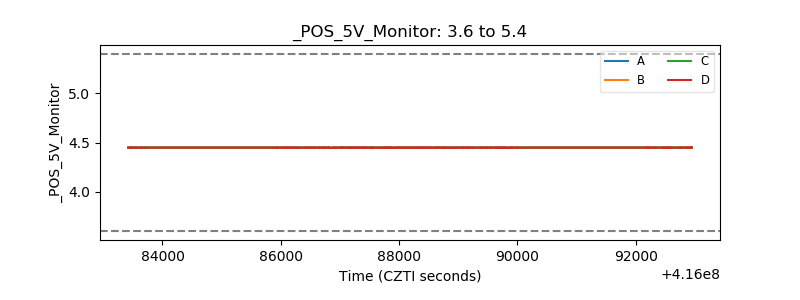 |
| _ROLL_ROT | 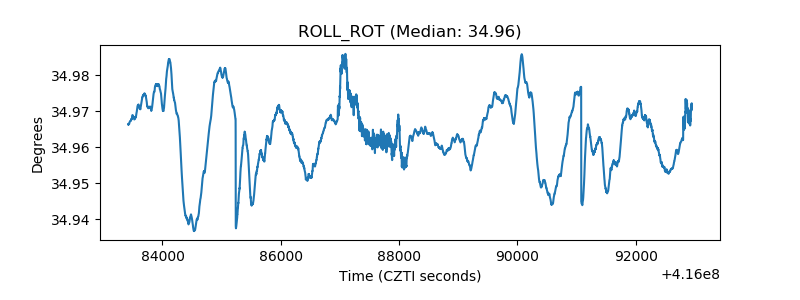 |
| _Roll_DEC | 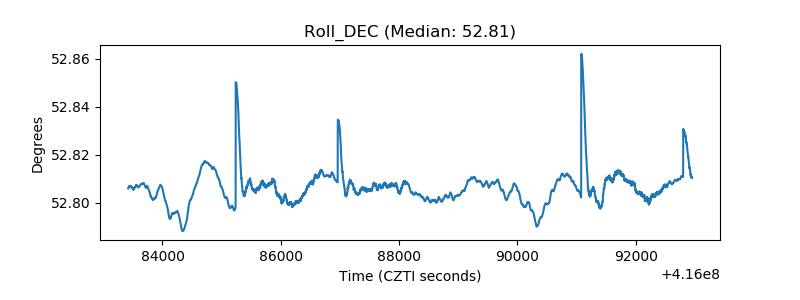 |
| _Roll_RA | 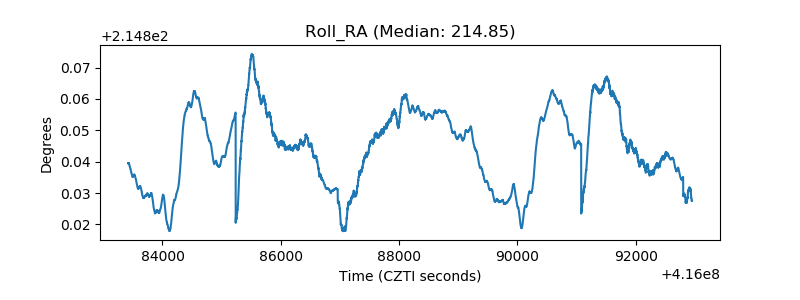 |
| Veto Counter | 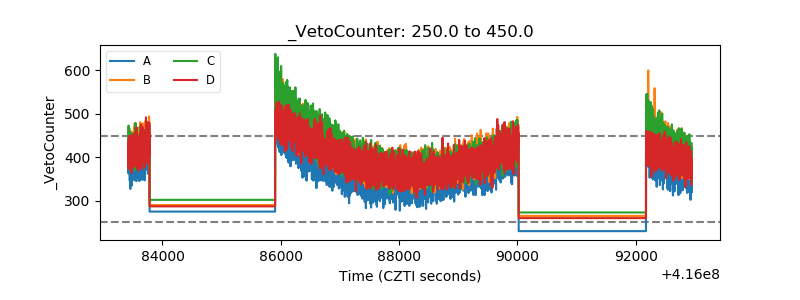 |