| Param | Original file | Final file |
|---|---|---|
| Filename | modeM0/AS1A12_022T01_9000005536_40260cztM0_level2.fits | modeM0/AS1A12_022T01_9000005536_40260cztM0_level2_quad_clean.evt |
| Size (bytes) | 317,278,080 | 83,056,320 |
| Size | 302.6 MB | 79.2 MB |
| Events in quadrant A | 2,607,080 | 554,097 |
| Events in quadrant B | 2,255,757 | 577,576 |
| Events in quadrant C | 2,799,782 | 553,871 |
| Events in quadrant D | 3,697,092 | 483,763 |
| Mode SS | |||
|---|---|---|---|
| Quadrant | BADHDUFLAG | Total packets | Discarded packets |
| A | 0 | 98 | 0 |
| B | 0 | 98 | 0 |
| C | 0 | 98 | 0 |
| D | 0 | 98 | 0 |
| Mode M0 | |||
|---|---|---|---|
| Quadrant | BADHDUFLAG | Total packets | Discarded packets |
| A | 0 | 10912 | 2 |
| B | 0 | 10183 | 1 |
| C | 0 | 11446 | 1 |
| D | 0 | 14482 | 1 |
| Mode M9 | |||
|---|---|---|---|
| Quadrant | BADHDUFLAG | Total packets | Discarded packets |
| A | 0 | 30 | 0 |
| B | 0 | 30 | 0 |
| C | 0 | 30 | 0 |
| D | 0 | 31 | 0 |
| Quadrant | Total seconds | Saturated seconds | Saturation percentage |
|---|---|---|---|
| A | 4936 | 39 | 0.790113% |
| B | 4936 | 15 | 0.303890% |
| C | 4936 | 73 | 1.478930% |
| D | 4936 | 394 | 7.982172% |
Noise dominated data is calculated using 1-second bins in cleaned event files. If a bin has >2000 counts, and if more than 50% of those come from <1% of pixels, then it is considered to be noise-dominated and hence unusable.
| Quadrant | # 1 sec bins | Bins with >0 counts | Bins with >2000 counts | High rate bins dominated by noise | Noise dominated (total time) | Noise dominated (detector-on time) | Marked lightcurve |
|---|---|---|---|---|---|---|---|
| A | 6937 | 4937 | 26 | 26 | 0.37% | 0.53% | 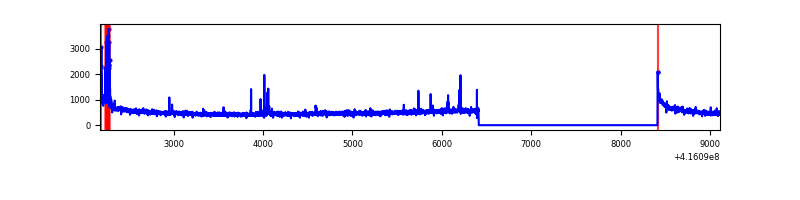 |
| B | 6937 | 4937 | 7 | 7 | 0.10% | 0.14% | 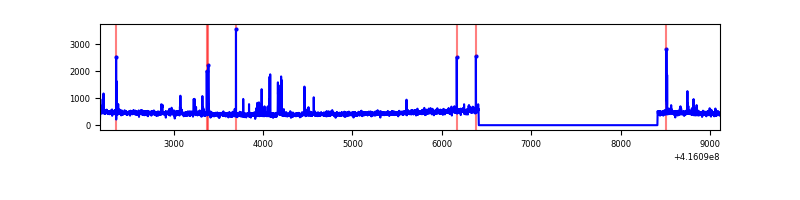 |
| C | 6937 | 4937 | 61 | 61 | 0.88% | 1.24% | 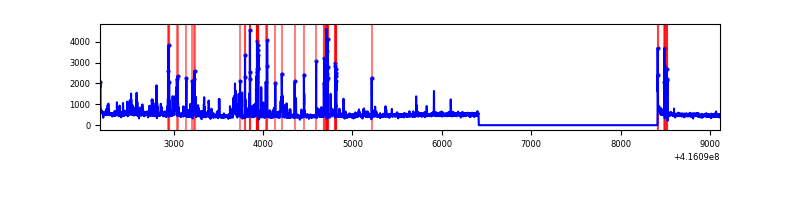 |
| D | 6937 | 4937 | 394 | 394 | 5.68% | 7.98% | 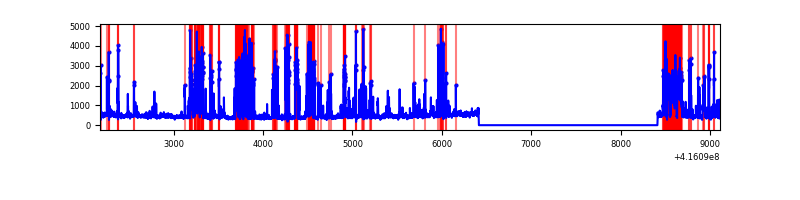 |
Top three noisy pixels from each quadrant. If the there are fewer than three noisy pixels in the level2.evt file, extra rows are filled as -1
| Pixel properties | Quadrant properties | ||||||
|---|---|---|---|---|---|---|---|
| Quadrant | DetID | PixID | Counts | Sigma | Mean | Median | Sigma |
| A | 10 | 83 | 429627 | 3960.73 | 529 | 519 | 108.3 |
| A | 13 | 248 | 108308 | 994.91 | 529 | 519 | 108.3 |
| A | 13 | 6 | 9608 | 83.89 | 529 | 519 | 108.3 |
| B | 0 | 245 | 68360 | 649.08 | 537 | 523 | 104.5 |
| B | 5 | 255 | 57560 | 545.74 | 537 | 523 | 104.5 |
| B | 4 | 171 | 14103 | 129.94 | 537 | 523 | 104.5 |
| C | 14 | 254 | 481394 | 3874.64 | 526 | 528 | 124.1 |
| C | 15 | 214 | 214360 | 1722.98 | 526 | 528 | 124.1 |
| C | 0 | 10 | 23584 | 185.78 | 526 | 528 | 124.1 |
| D | 12 | 227 | 1213052 | 9697.95 | 509 | 495 | 125.0 |
| D | 12 | 79 | 328746 | 2625.33 | 509 | 495 | 125.0 |
| D | 9 | 19 | 56276 | 446.13 | 509 | 495 | 125.0 |
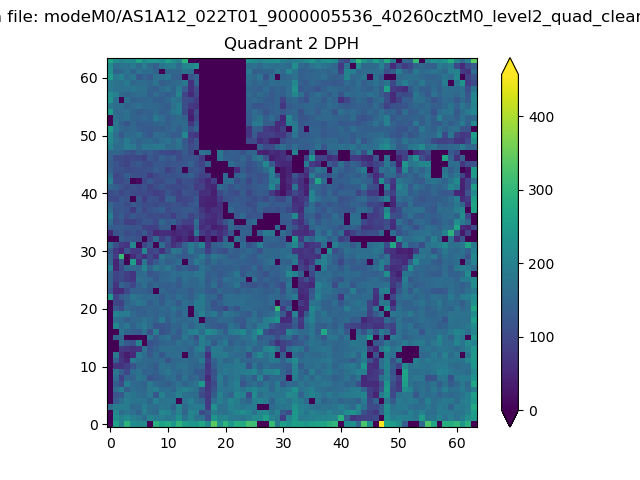
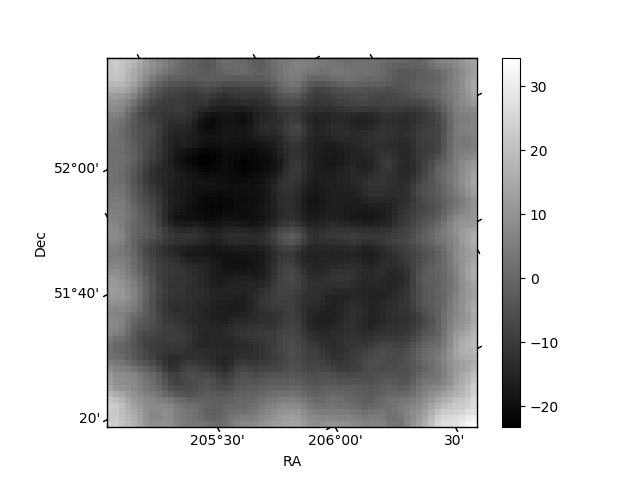
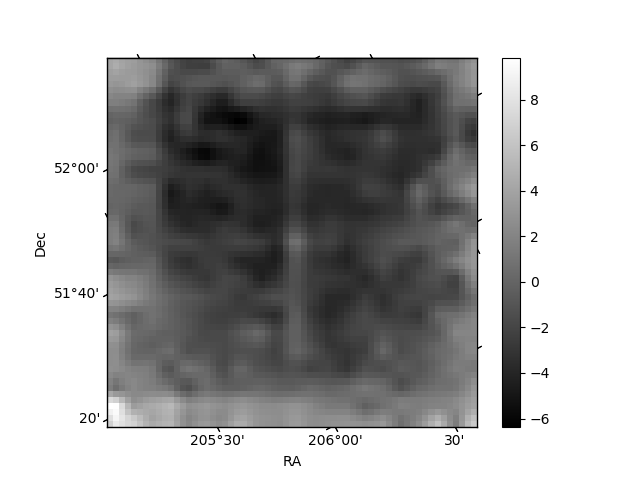
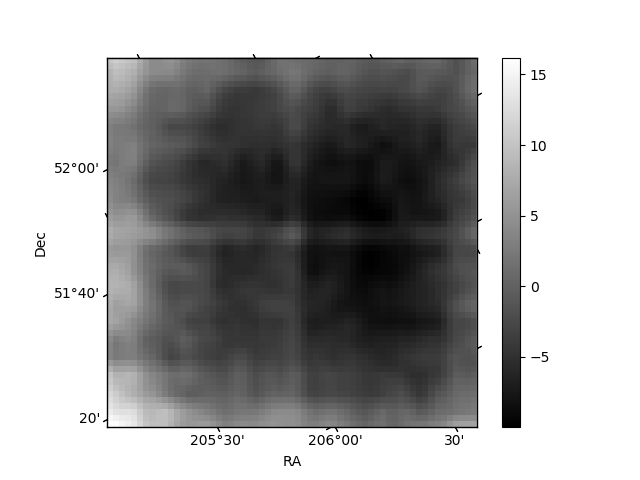
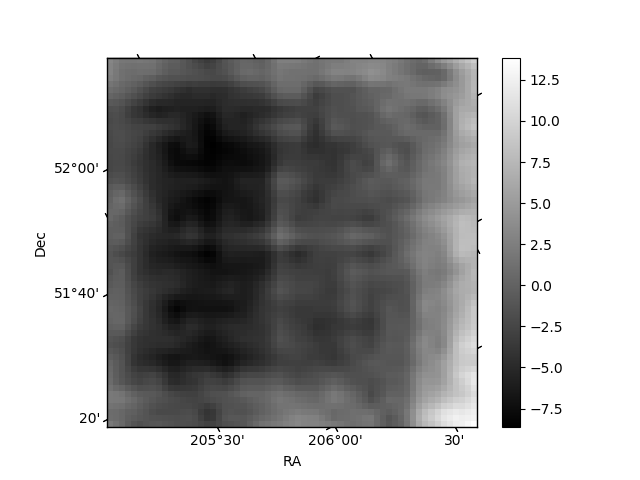
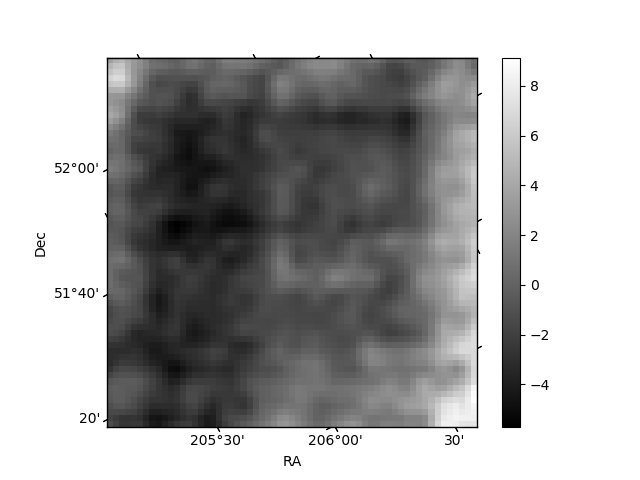
Histogram calculated using DETX and DETY for each event in the final _common_clean file
| Quadrant A | 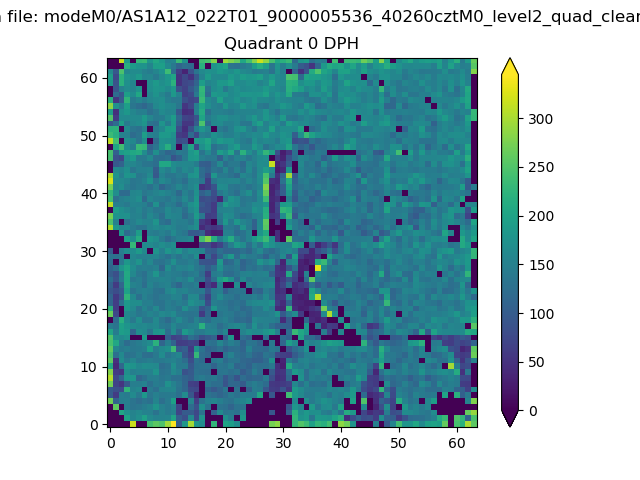 |
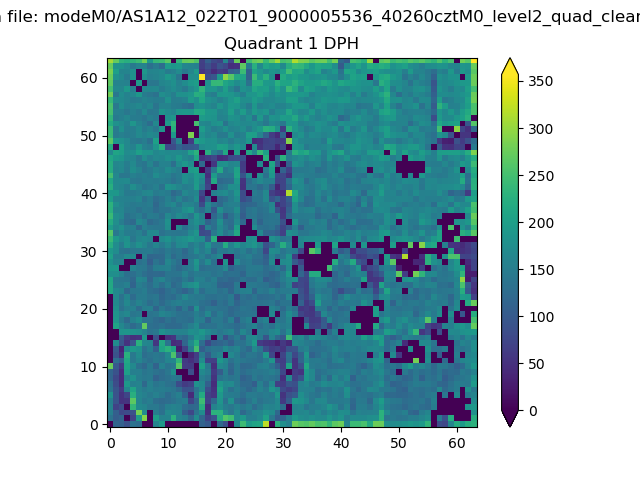 |
Quadrant B |
|---|---|---|---|
| Quadrant D | 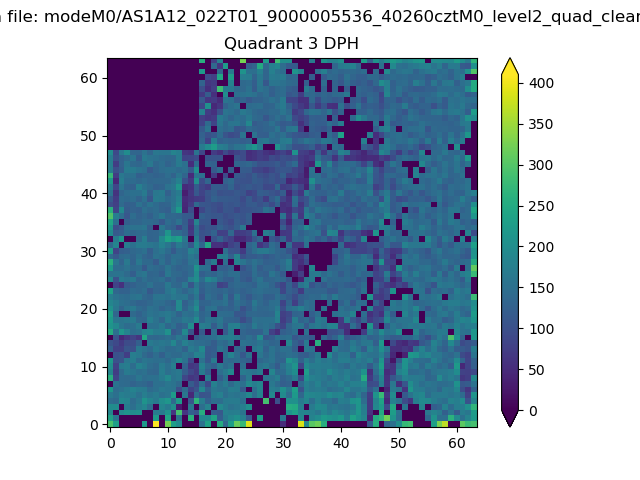 |
 |
Quadrant C |
| Plot type | Count rate plots | Images |
|---|---|---|
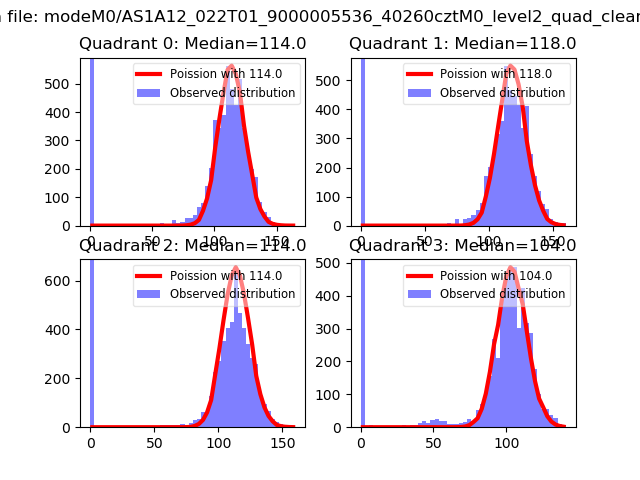
| Comparison with Poisson distribution Blue bars denote a histogram of data divided into 1 sec bins. Red curve is a Poisson curve with rate = median count rate of data. |
 |
 |
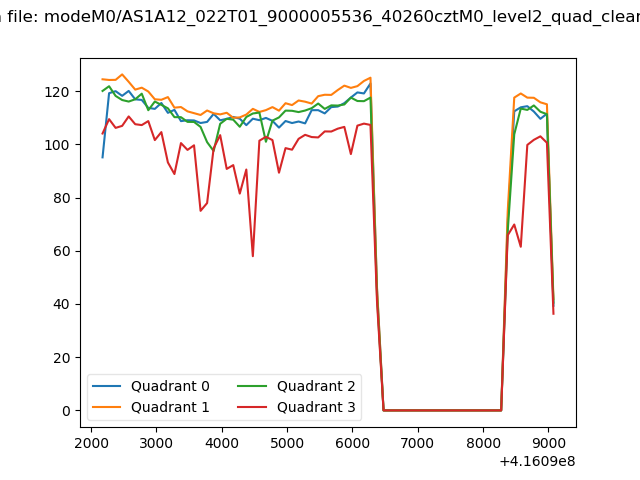
| Quadrant-wise count rates Data is divided into 100 sec bins |
 |
|
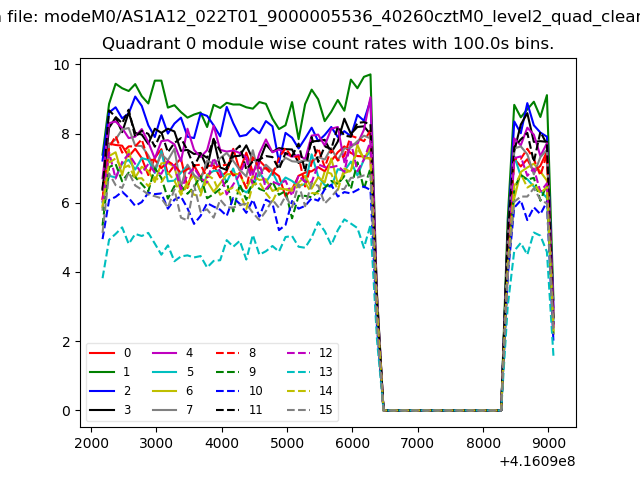
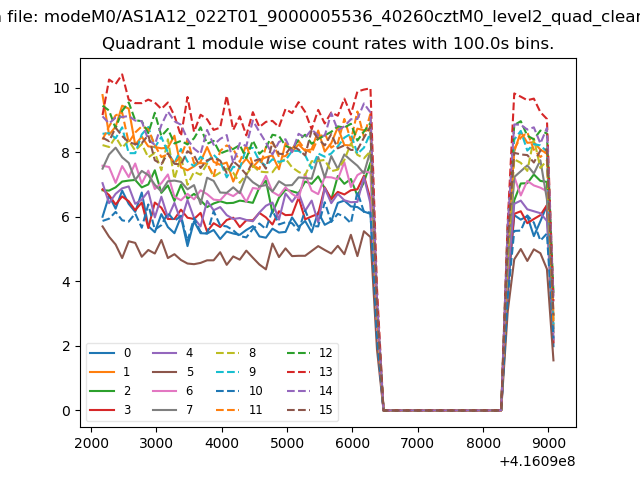
| Module-wise count rates for Quadrant A Data is divided into 100 sec bins |
 |
 |
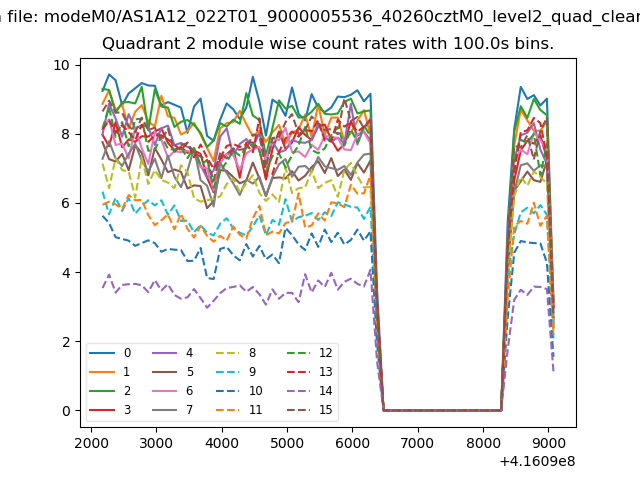
| Module-wise count rates for Quadrant B Data is divided into 100 sec bins |
 |
 |
| Module-wise count rates for Quadrant C Data is divided into 100 sec bins |
 |
 |
| Module-wise count rates for Quadrant D Data is divided into 100 sec bins |
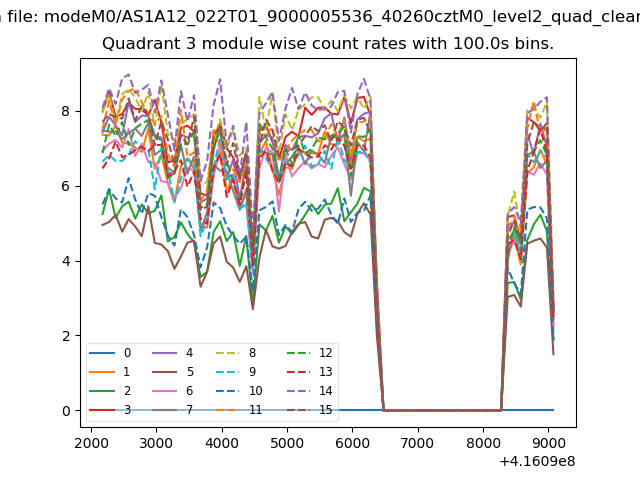 |
 |
| Parameter | Plot |
|---|---|
| CZT HV Monitor | 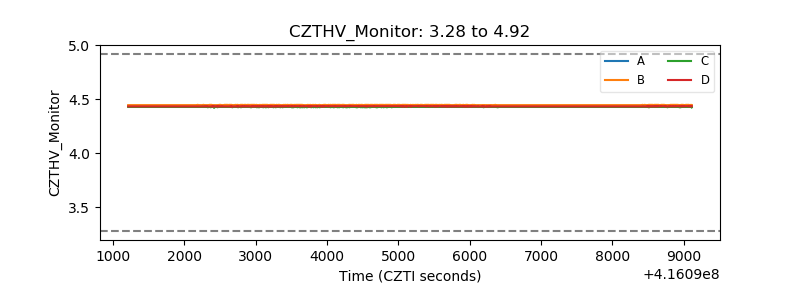 |
| D_VDD | 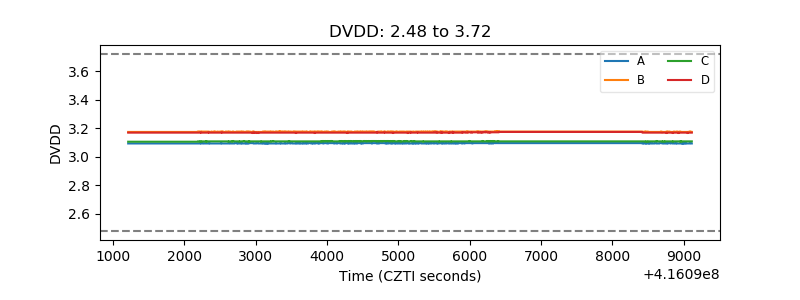 |
| Temperature 1 | 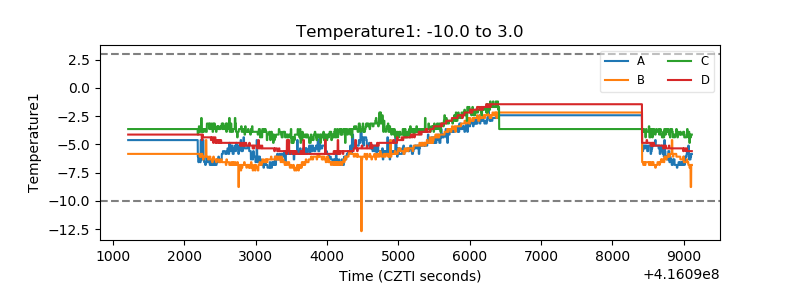 |
| Veto HV Monitor | 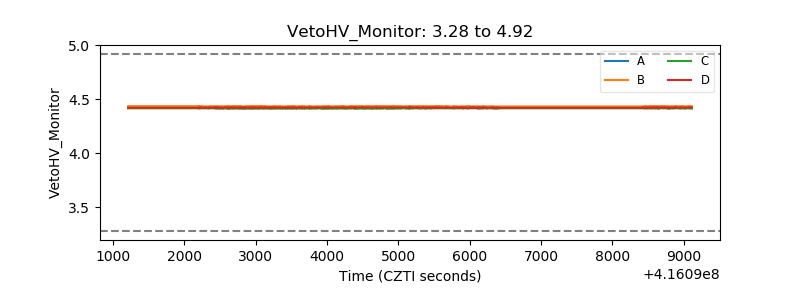 |
| Veto LLD |  |
| Alpha Counter | 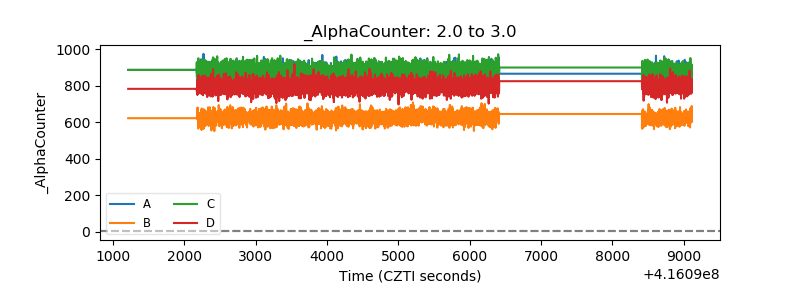 |
| _CPM_Rate | 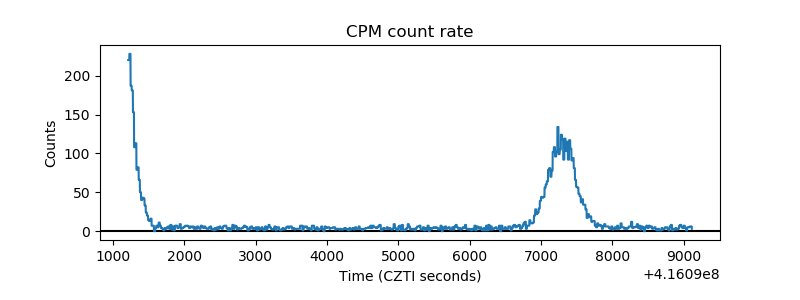 |
| CZT Counter | 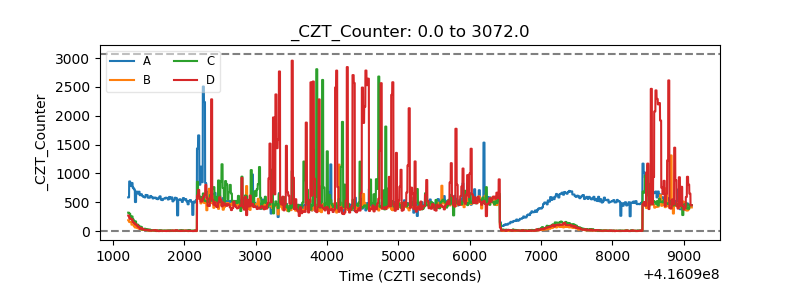 |
| +2.5 Volts monitor |  |
| +5 Volts monitor |  |
| _ROLL_ROT | 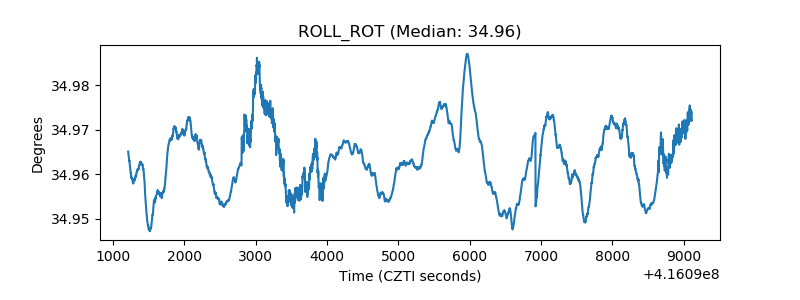 |
| _Roll_DEC | 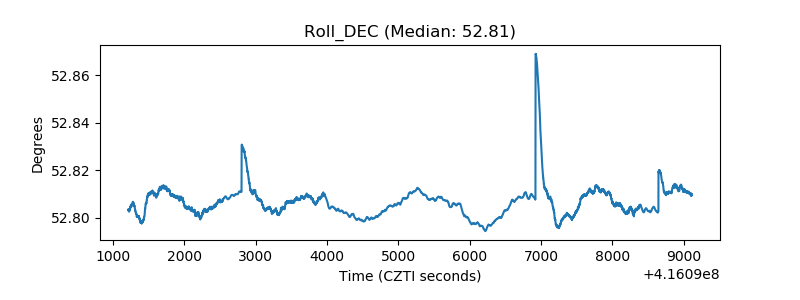 |
| _Roll_RA | 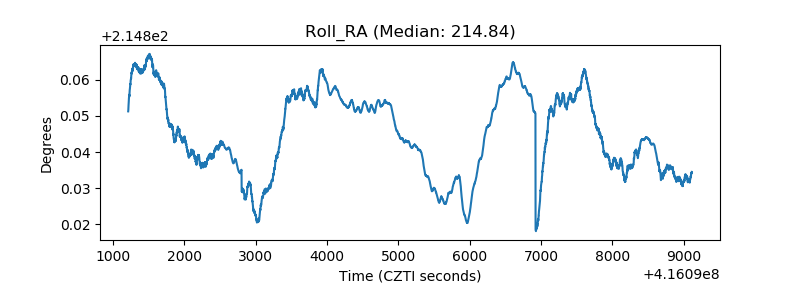 |
| Veto Counter | 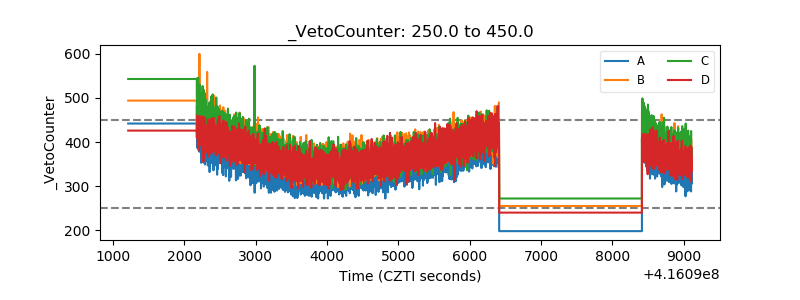 |