| Param | Original file | Final file |
|---|---|---|
| Filename | modeM0/AS1A12_022T01_9000005536_40261cztM0_level2.fits | modeM0/AS1A12_022T01_9000005536_40261cztM0_level2_quad_clean.evt |
| Size (bytes) | 370,031,040 | 87,851,520 |
| Size | 352.9 MB | 83.8 MB |
| Events in quadrant A | 2,914,714 | 591,477 |
| Events in quadrant B | 2,518,275 | 615,000 |
| Events in quadrant C | 3,116,795 | 587,834 |
| Events in quadrant D | 4,725,708 | 486,704 |
| Mode SS | |||
|---|---|---|---|
| Quadrant | BADHDUFLAG | Total packets | Discarded packets |
| A | 0 | 112 | 0 |
| B | 0 | 112 | 0 |
| C | 0 | 112 | 0 |
| D | 0 | 112 | 0 |
| Mode M0 | |||
|---|---|---|---|
| Quadrant | BADHDUFLAG | Total packets | Discarded packets |
| A | 0 | 12175 | 2 |
| B | 0 | 11178 | 1 |
| C | 0 | 12762 | 1 |
| D | 0 | 17939 | 1 |
| Mode M9 | |||
|---|---|---|---|
| Quadrant | BADHDUFLAG | Total packets | Discarded packets |
| A | 0 | 38 | 0 |
| B | 0 | 38 | 0 |
| C | 0 | 38 | 0 |
| D | 0 | 38 | 0 |
| Quadrant | Total seconds | Saturated seconds | Saturation percentage |
|---|---|---|---|
| A | 5416 | 60 | 1.107829% |
| B | 5416 | 22 | 0.406204% |
| C | 5416 | 92 | 1.698671% |
| D | 5416 | 728 | 13.441654% |
Noise dominated data is calculated using 1-second bins in cleaned event files. If a bin has >2000 counts, and if more than 50% of those come from <1% of pixels, then it is considered to be noise-dominated and hence unusable.
| Quadrant | # 1 sec bins | Bins with >0 counts | Bins with >2000 counts | High rate bins dominated by noise | Noise dominated (total time) | Noise dominated (detector-on time) | Marked lightcurve |
|---|---|---|---|---|---|---|---|
| A | 9149 | 5418 | 27 | 27 | 0.30% | 0.50% | 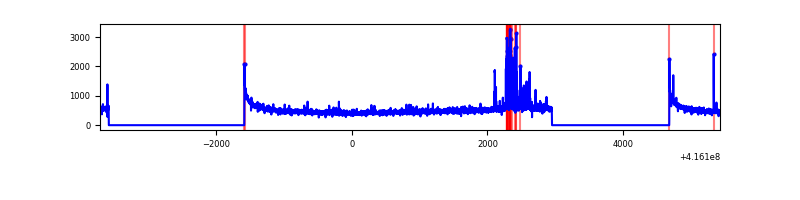 |
| B | 9149 | 5418 | 4 | 4 | 0.04% | 0.07% | 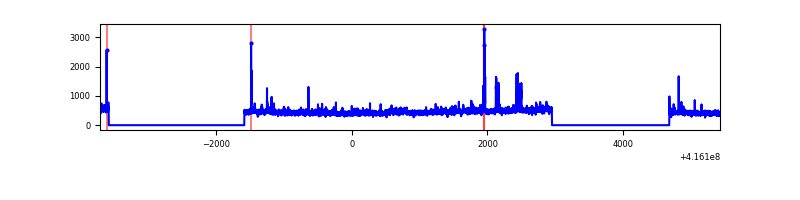 |
| C | 9149 | 5418 | 100 | 100 | 1.09% | 1.85% | 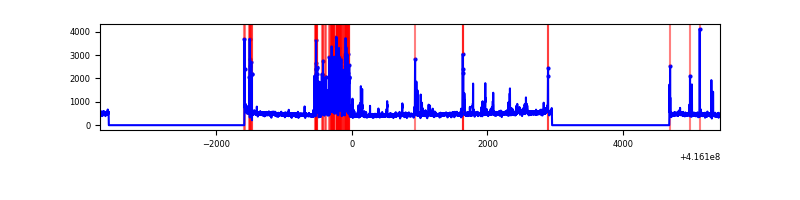 |
| D | 9149 | 5418 | 699 | 699 | 7.64% | 12.90% | 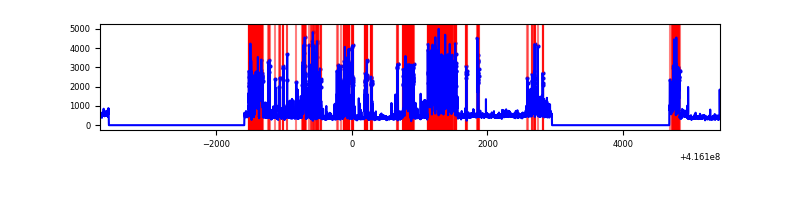 |
Top three noisy pixels from each quadrant. If the there are fewer than three noisy pixels in the level2.evt file, extra rows are filled as -1
| Pixel properties | Quadrant properties | ||||||
|---|---|---|---|---|---|---|---|
| Quadrant | DetID | PixID | Counts | Sigma | Mean | Median | Sigma |
| A | 10 | 83 | 461737 | 3859.29 | 582 | 571 | 119.5 |
| A | 13 | 248 | 175497 | 1463.88 | 582 | 571 | 119.5 |
| A | 13 | 6 | 9602 | 75.58 | 582 | 571 | 119.5 |
| B | 0 | 245 | 142388 | 1244.56 | 584 | 568 | 114.0 |
| B | 5 | 255 | 52501 | 455.74 | 584 | 568 | 114.0 |
| B | 0 | 230 | 17002 | 144.22 | 584 | 568 | 114.0 |
| C | 14 | 254 | 575209 | 4313.66 | 570 | 573 | 133.2 |
| C | 15 | 214 | 231797 | 1735.75 | 570 | 573 | 133.2 |
| C | 15 | 208 | 39204 | 289.99 | 570 | 573 | 133.2 |
| D | 12 | 227 | 1190468 | 9040.9 | 537 | 523 | 131.6 |
| D | 12 | 79 | 744844 | 5655.16 | 537 | 523 | 131.6 |
| D | 1 | 47 | 521100 | 3955.21 | 537 | 523 | 131.6 |
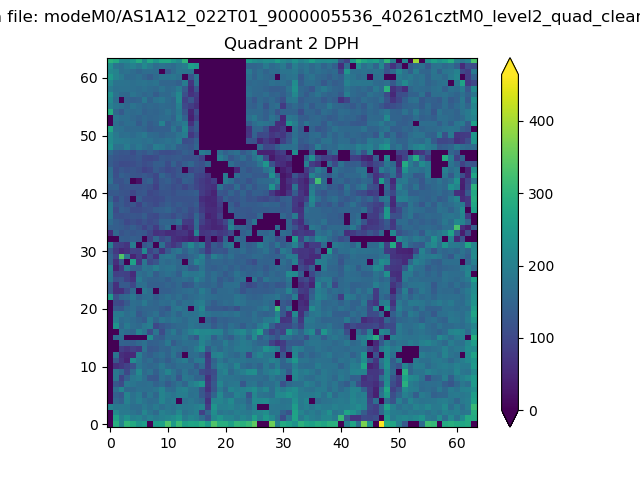
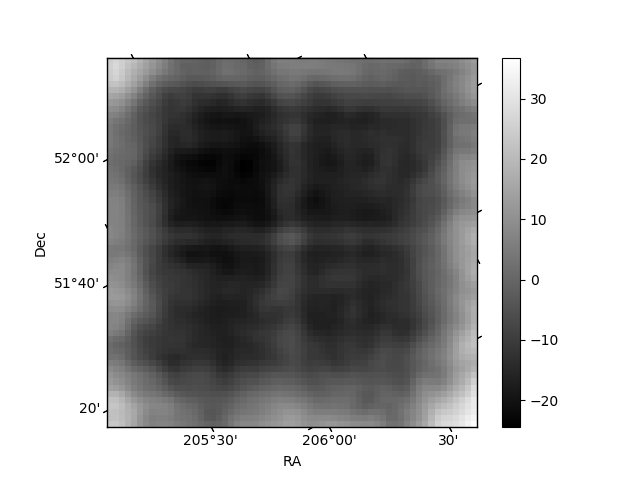
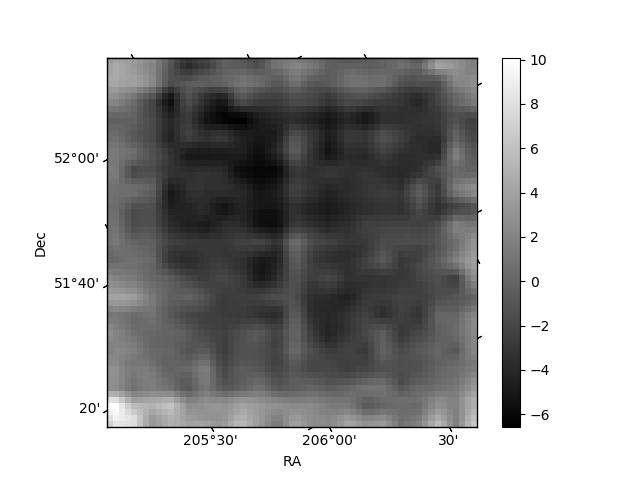
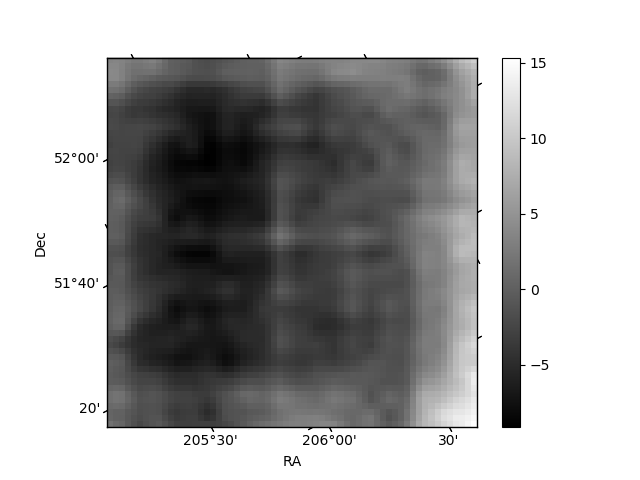
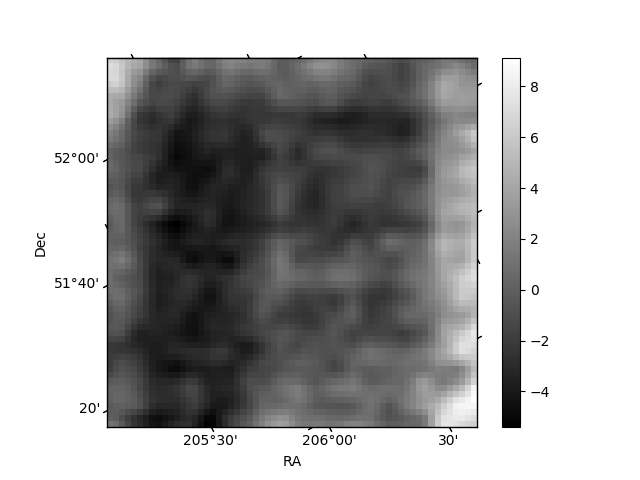
Histogram calculated using DETX and DETY for each event in the final _common_clean file
| Quadrant A | 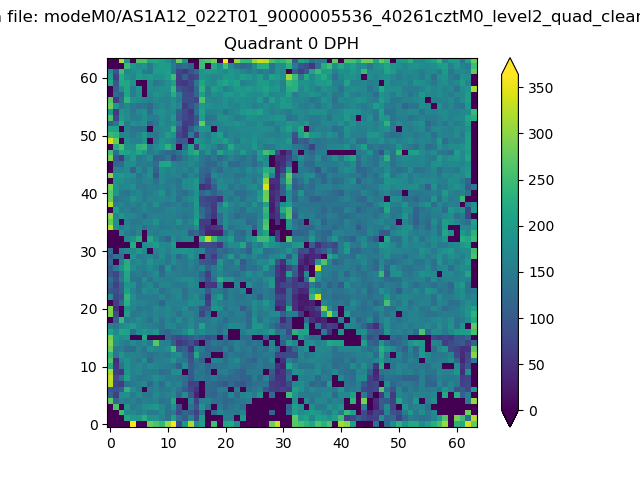 |
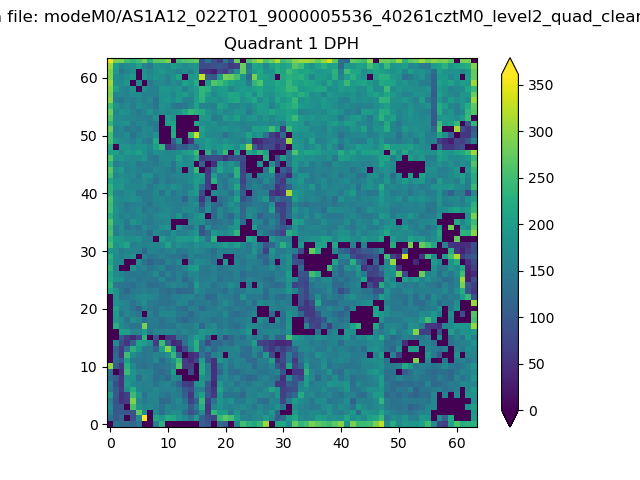 |
Quadrant B |
|---|---|---|---|
| Quadrant D | 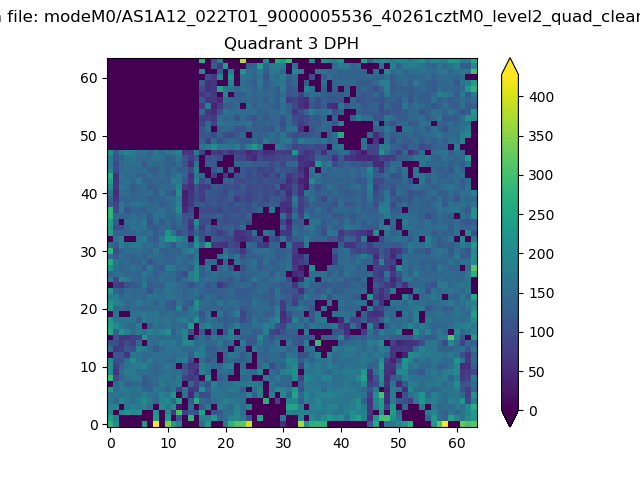 |
 |
Quadrant C |
| Plot type | Count rate plots | Images |
|---|---|---|
| Comparison with Poisson distribution Blue bars denote a histogram of data divided into 1 sec bins. Red curve is a Poisson curve with rate = median count rate of data. |
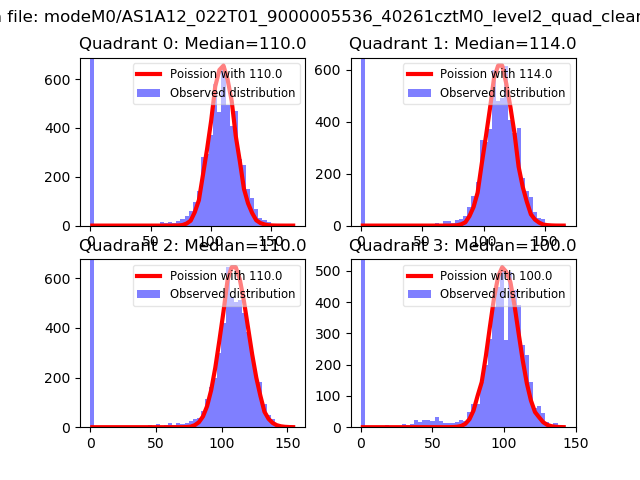 |
 |
| Quadrant-wise count rates Data is divided into 100 sec bins |
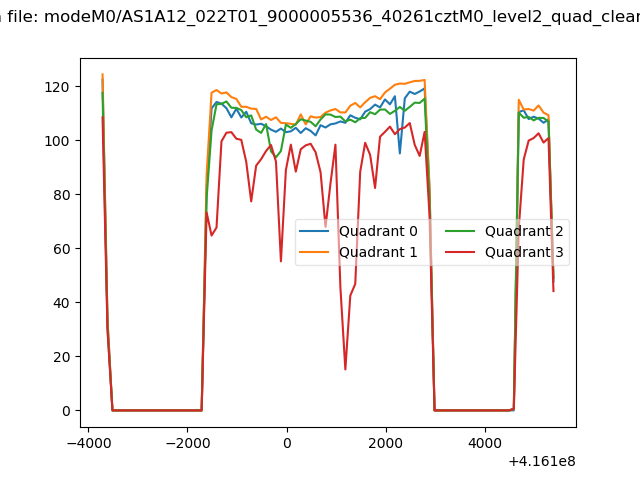 |
|
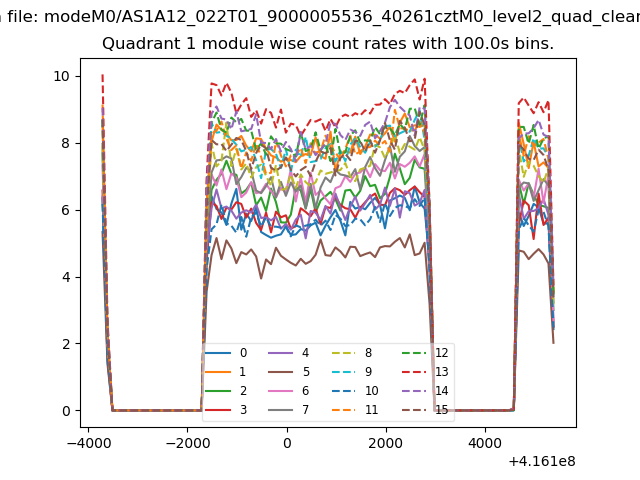
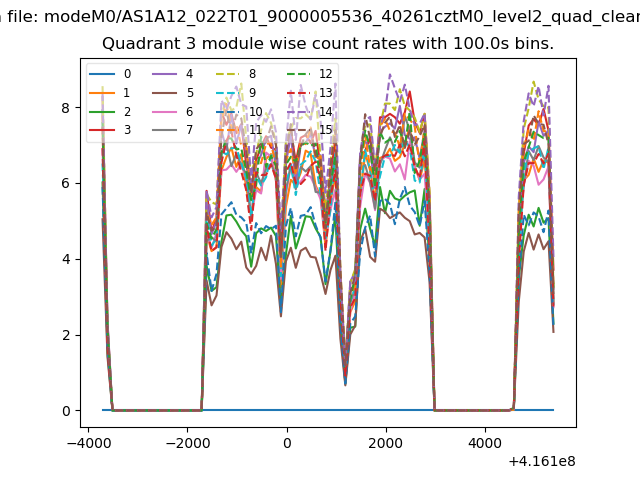
| Module-wise count rates for Quadrant A Data is divided into 100 sec bins |
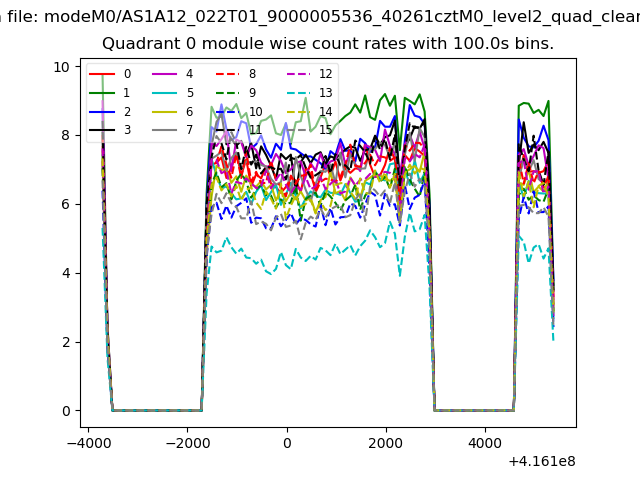 |
 |
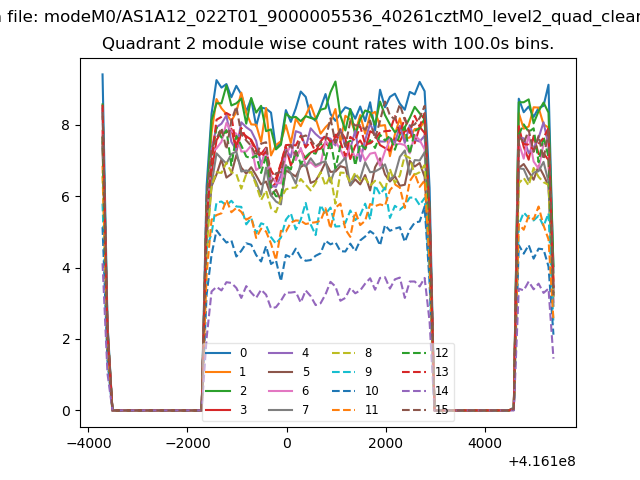
| Module-wise count rates for Quadrant B Data is divided into 100 sec bins |
 |
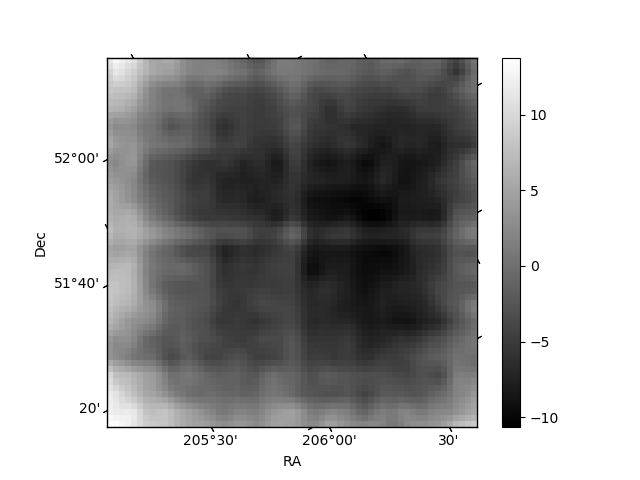 |
| Module-wise count rates for Quadrant C Data is divided into 100 sec bins |
 |
 |
| Module-wise count rates for Quadrant D Data is divided into 100 sec bins |
 |
 |
| Parameter | Plot |
|---|---|
| CZT HV Monitor | 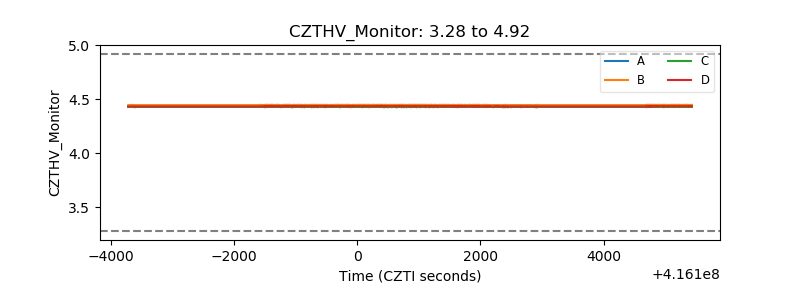 |
| D_VDD | 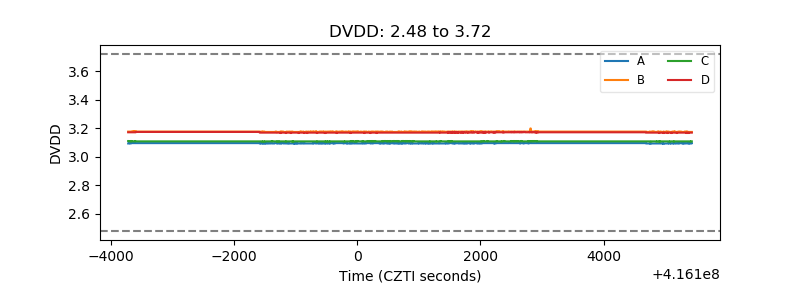 |
| Temperature 1 | 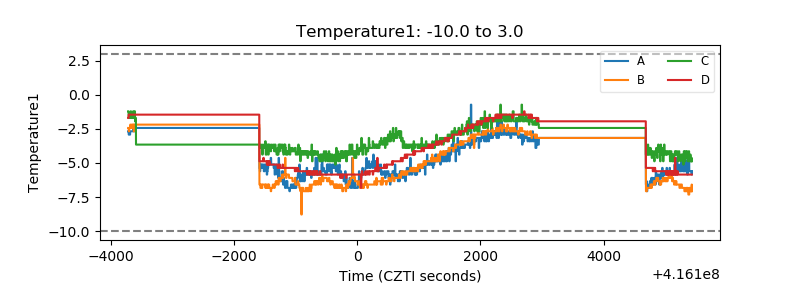 |
| Veto HV Monitor |  |
| Veto LLD | 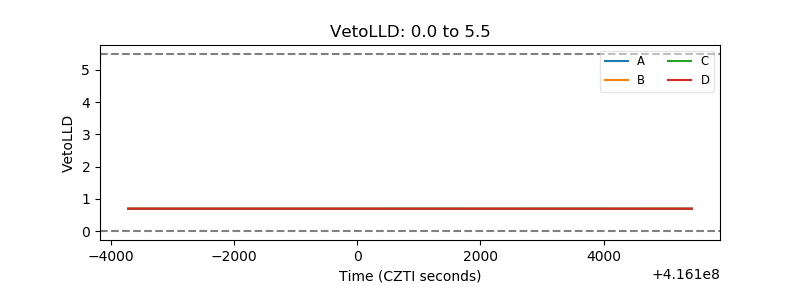 |
| Alpha Counter | 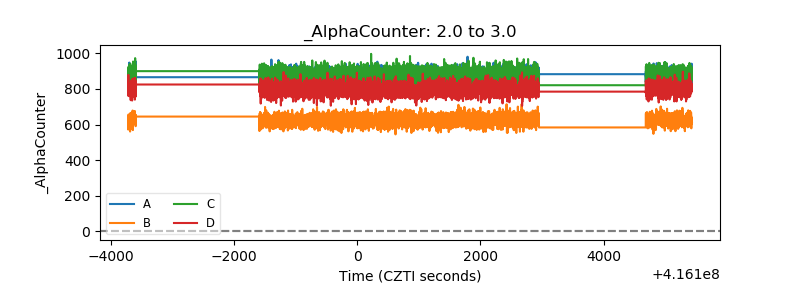 |
| _CPM_Rate | 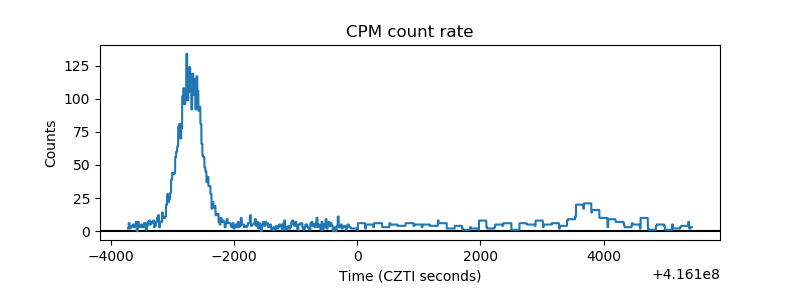 |
| CZT Counter | 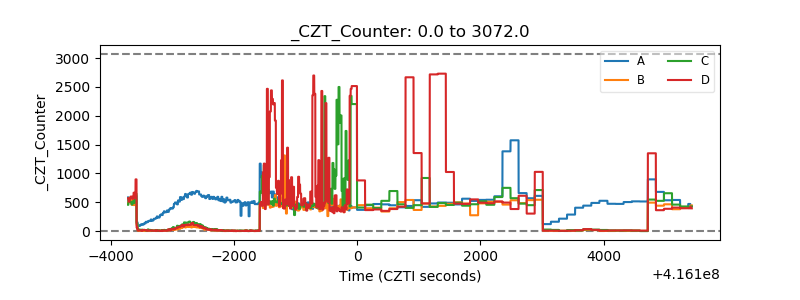 |
| +2.5 Volts monitor | 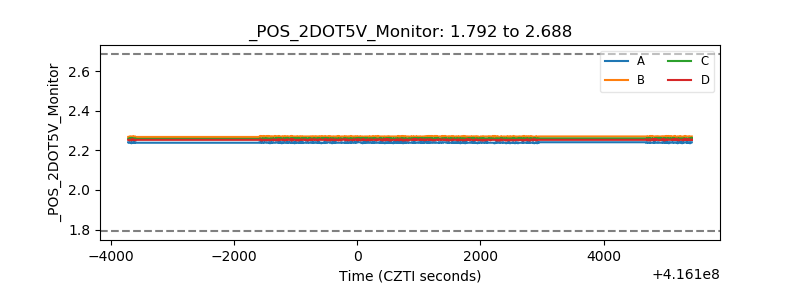 |
| +5 Volts monitor |  |
| _ROLL_ROT | 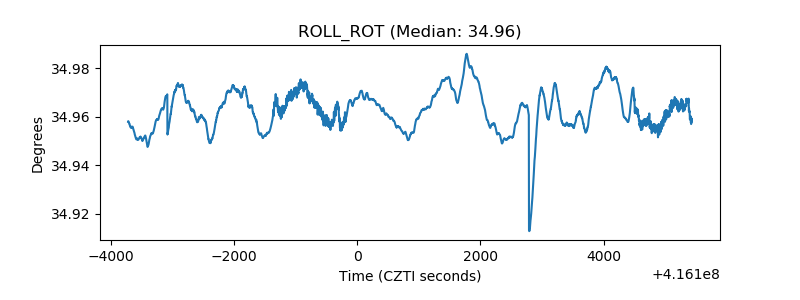 |
| _Roll_DEC | 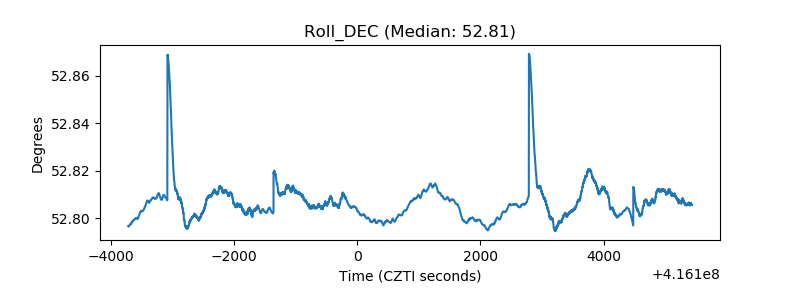 |
| _Roll_RA | 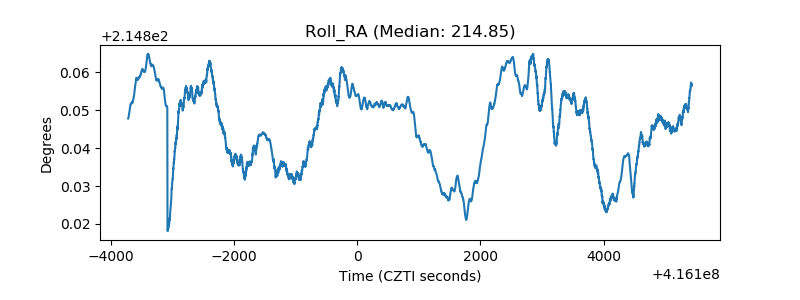 |
| Veto Counter | 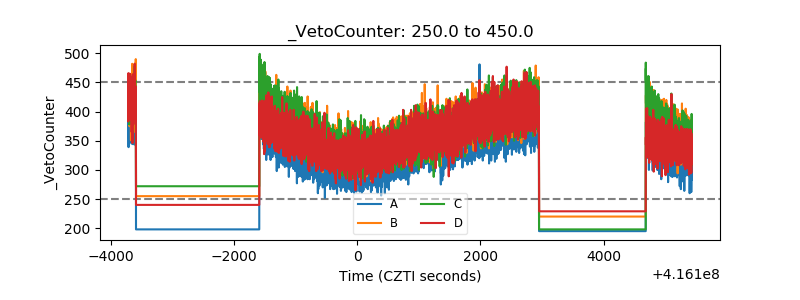 |