| Param | Original file | Final file |
|---|---|---|
| Filename | modeM0/AS1A12_022T01_9000005536_40262cztM0_level2.fits | modeM0/AS1A12_022T01_9000005536_40262cztM0_level2_quad_clean.evt |
| Size (bytes) | 165,072,960 | 44,979,840 |
| Size | 157.4 MB | 42.9 MB |
| Events in quadrant A | 1,375,028 | 294,598 |
| Events in quadrant B | 1,133,548 | 305,936 |
| Events in quadrant C | 1,478,434 | 296,023 |
| Events in quadrant D | 1,901,969 | 264,362 |
| Mode SS | |||
|---|---|---|---|
| Quadrant | BADHDUFLAG | Total packets | Discarded packets |
| A | 0 | 56 | 0 |
| B | 0 | 56 | 0 |
| C | 0 | 56 | 0 |
| D | 0 | 56 | 0 |
| Mode M0 | |||
|---|---|---|---|
| Quadrant | BADHDUFLAG | Total packets | Discarded packets |
| A | 0 | 5990 | 1 |
| B | 0 | 5644 | 1 |
| C | 0 | 6374 | 1 |
| D | 0 | 7825 | 1 |
| Mode M9 | |||
|---|---|---|---|
| Quadrant | BADHDUFLAG | Total packets | Discarded packets |
| A | 0 | 14 | 0 |
| B | 0 | 14 | 0 |
| C | 0 | 14 | 0 |
| D | 0 | 15 | 0 |
| Quadrant | Total seconds | Saturated seconds | Saturation percentage |
|---|---|---|---|
| A | 2815 | 3 | 0.106572% |
| B | 2815 | 2 | 0.071048% |
| C | 2815 | 25 | 0.888099% |
| D | 2815 | 166 | 5.896980% |
Noise dominated data is calculated using 1-second bins in cleaned event files. If a bin has >2000 counts, and if more than 50% of those come from <1% of pixels, then it is considered to be noise-dominated and hence unusable.
| Quadrant | # 1 sec bins | Bins with >0 counts | Bins with >2000 counts | High rate bins dominated by noise | Noise dominated (total time) | Noise dominated (detector-on time) | Marked lightcurve |
|---|---|---|---|---|---|---|---|
| A | 2815 | 2815 | 2 | 2 | 0.07% | 0.07% | 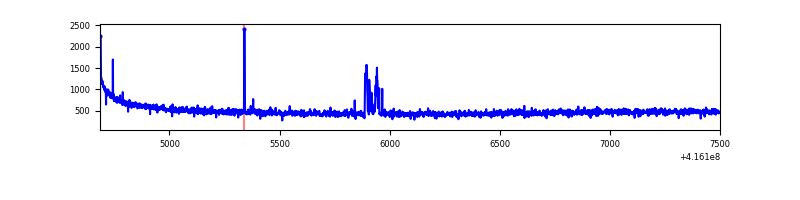 |
| B | 2815 | 2815 | 0 | 0 | 0.00% | 0.00% | 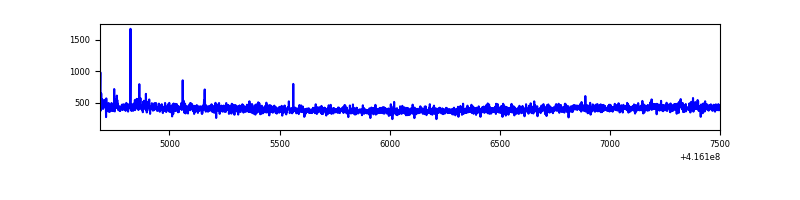 |
| C | 2815 | 2815 | 21 | 21 | 0.75% | 0.75% | 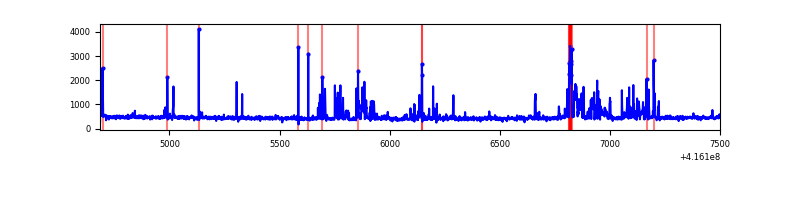 |
| D | 2815 | 2815 | 158 | 158 | 5.61% | 5.61% | 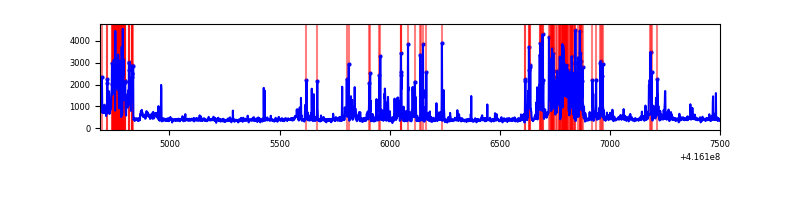 |
Top three noisy pixels from each quadrant. If the there are fewer than three noisy pixels in the level2.evt file, extra rows are filled as -1
| Pixel properties | Quadrant properties | ||||||
|---|---|---|---|---|---|---|---|
| Quadrant | DetID | PixID | Counts | Sigma | Mean | Median | Sigma |
| A | 10 | 83 | 235986 | 4009.72 | 281 | 275 | 58.8 |
| A | 2 | 79 | 32285 | 544.53 | 281 | 275 | 58.8 |
| A | 13 | 6 | 8135 | 133.71 | 281 | 275 | 58.8 |
| B | 5 | 255 | 8021 | 137.05 | 284 | 275 | 56.5 |
| B | 0 | 245 | 8000 | 136.68 | 284 | 275 | 56.5 |
| B | 12 | 111 | 7083 | 120.46 | 284 | 275 | 56.5 |
| C | 14 | 254 | 168340 | 2551.77 | 276 | 277 | 65.9 |
| C | 15 | 214 | 120841 | 1830.57 | 276 | 277 | 65.9 |
| C | 15 | 208 | 99276 | 1503.14 | 276 | 277 | 65.9 |
| D | 12 | 0 | 535658 | 8094.8 | 265 | 258 | 66.1 |
| D | 12 | 227 | 306298 | 4627.07 | 265 | 258 | 66.1 |
| D | 2 | 250 | 23335 | 348.9 | 265 | 258 | 66.1 |
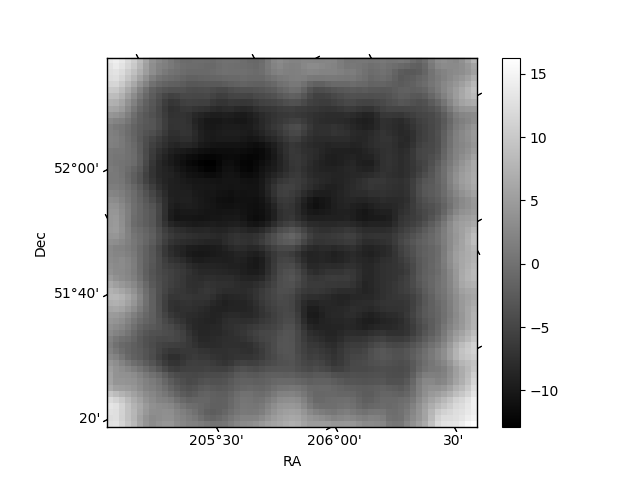
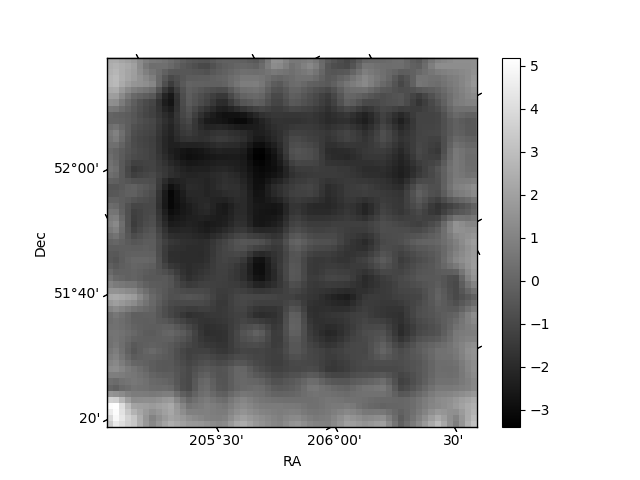
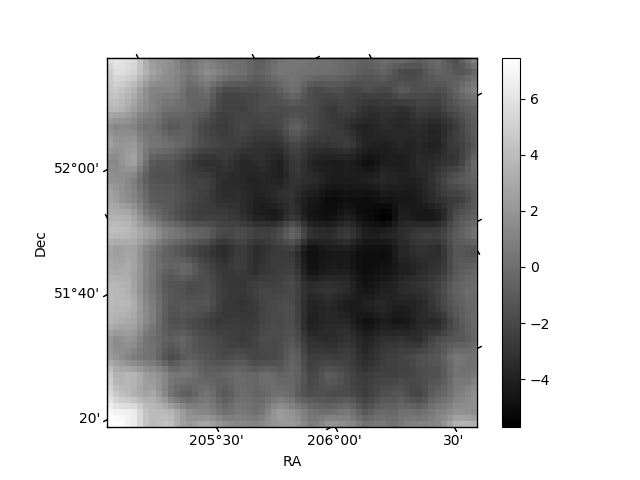
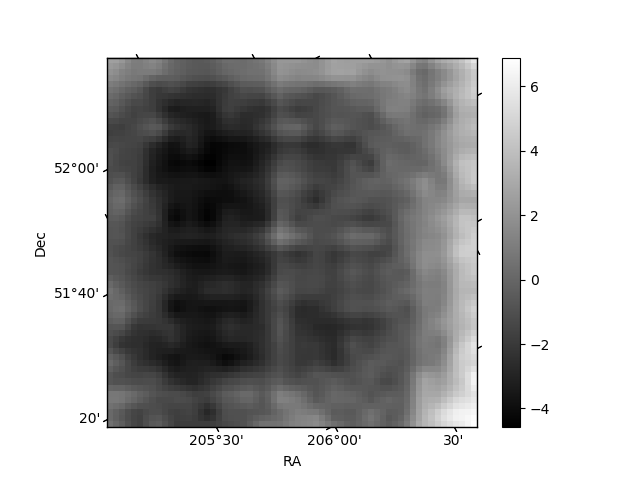
Histogram calculated using DETX and DETY for each event in the final _common_clean file
| Quadrant A | 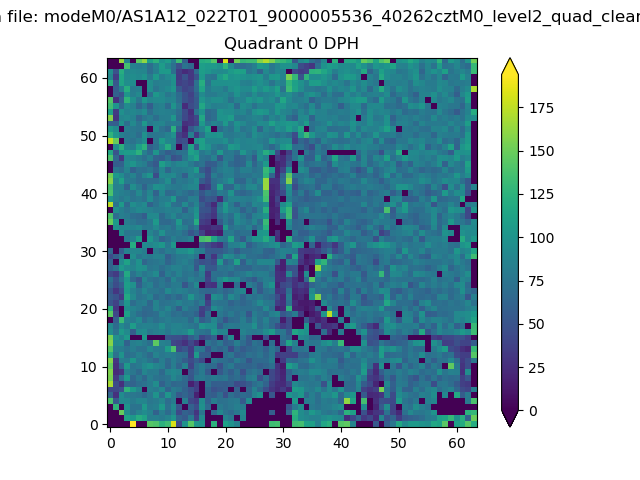 |
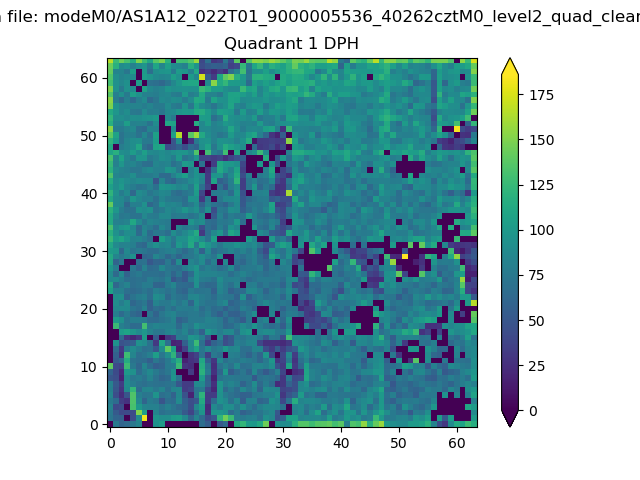 |
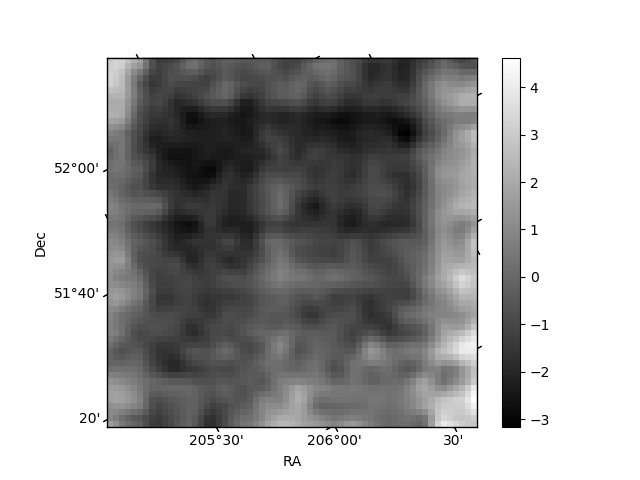
Quadrant B |
|---|---|---|---|
| Quadrant D | 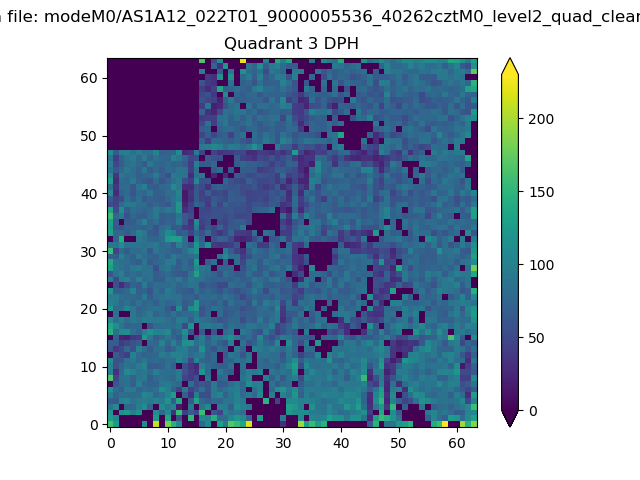 |
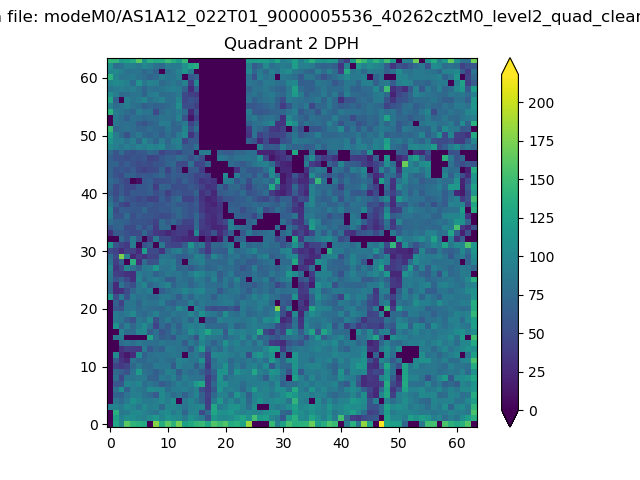 |
Quadrant C |
| Plot type | Count rate plots | Images |
|---|---|---|
| Comparison with Poisson distribution Blue bars denote a histogram of data divided into 1 sec bins. Red curve is a Poisson curve with rate = median count rate of data. |
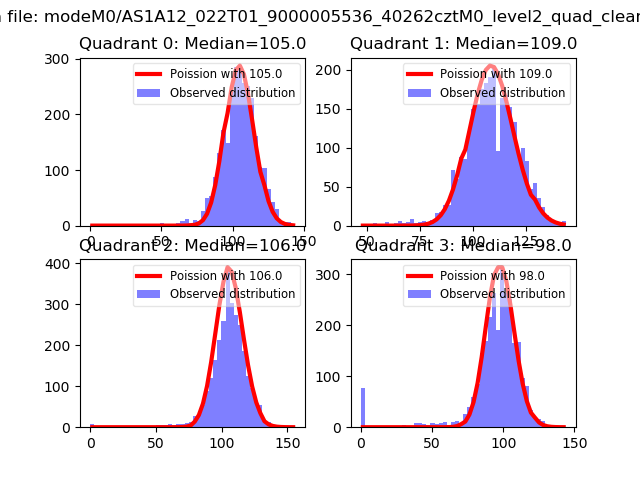 |
 |
| Quadrant-wise count rates Data is divided into 100 sec bins |
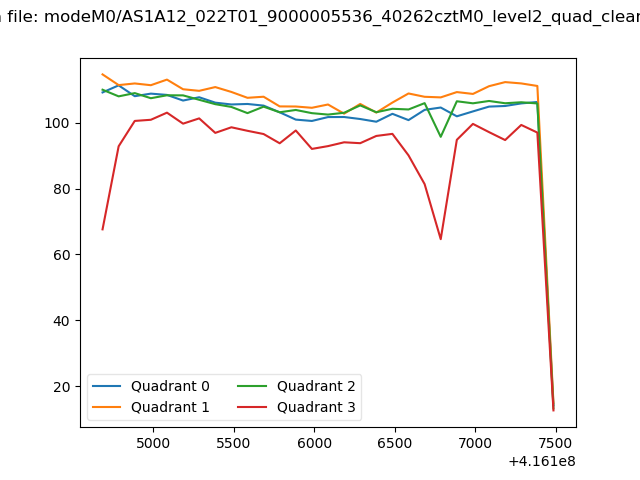 |
|
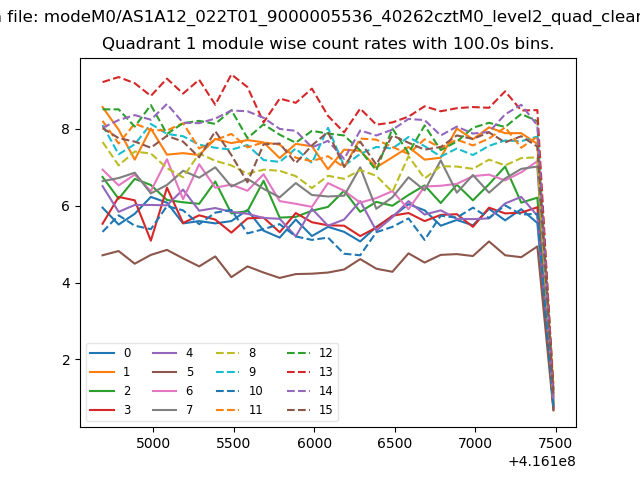
| Module-wise count rates for Quadrant A Data is divided into 100 sec bins |
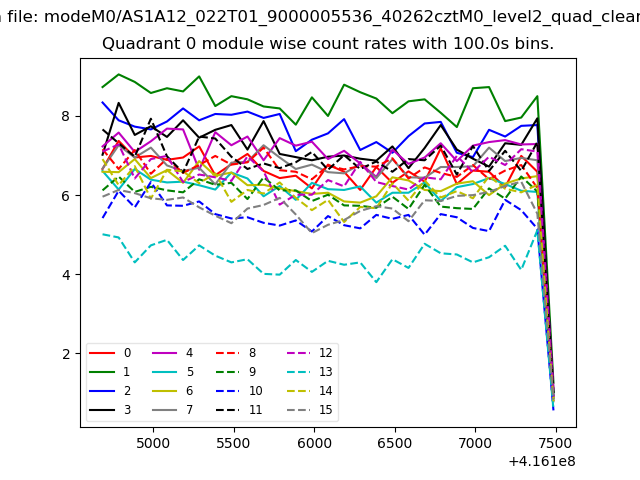 |
 |
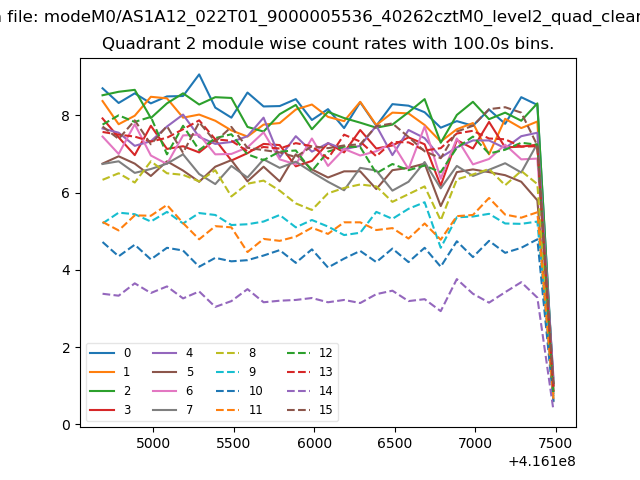
| Module-wise count rates for Quadrant B Data is divided into 100 sec bins |
 |
 |
| Module-wise count rates for Quadrant C Data is divided into 100 sec bins |
 |
 |
| Module-wise count rates for Quadrant D Data is divided into 100 sec bins |
 |
 |
| Parameter | Plot |
|---|---|
| CZT HV Monitor | 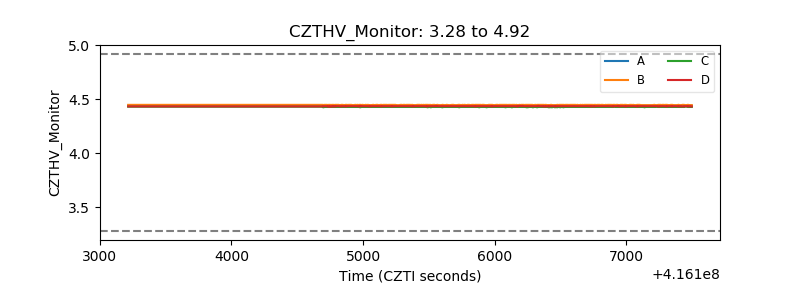 |
| D_VDD | 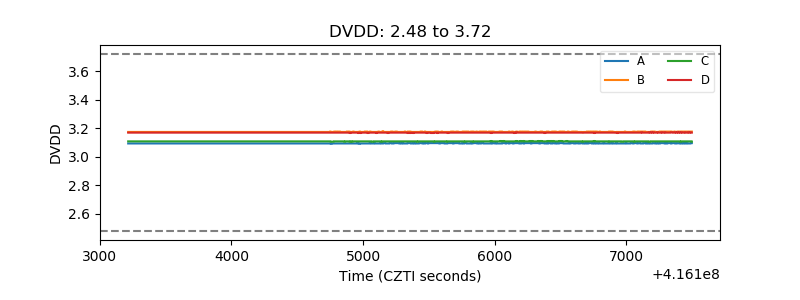 |
| Temperature 1 | 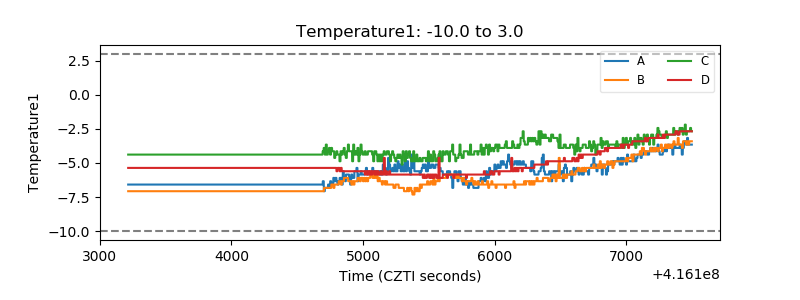 |
| Veto HV Monitor | 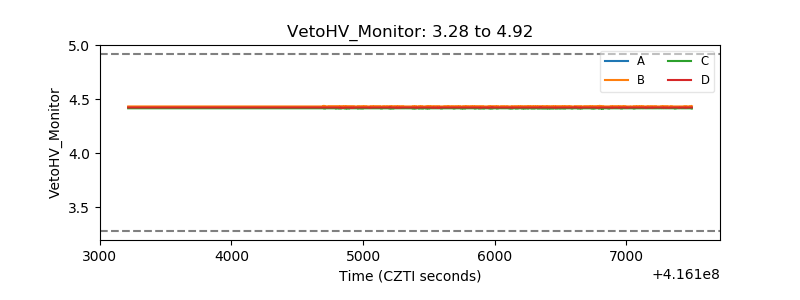 |
| Veto LLD | 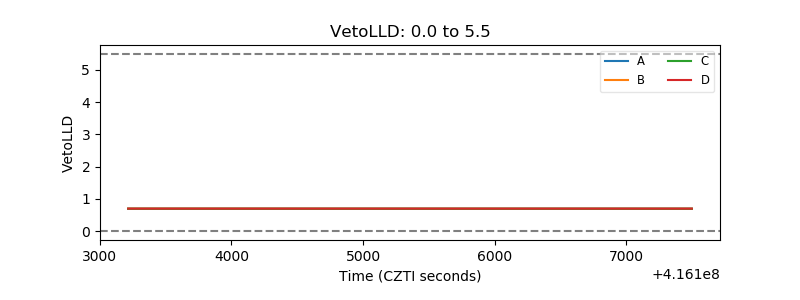 |
| Alpha Counter | 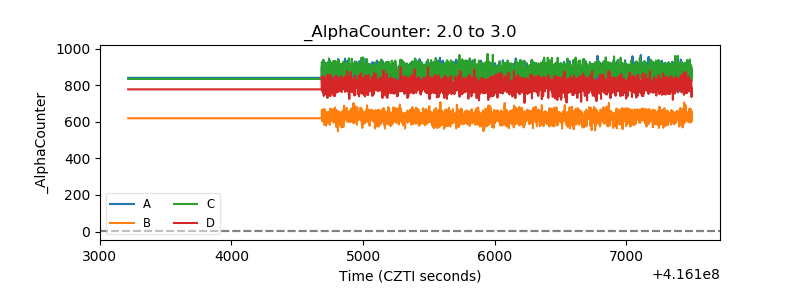 |
| _CPM_Rate | 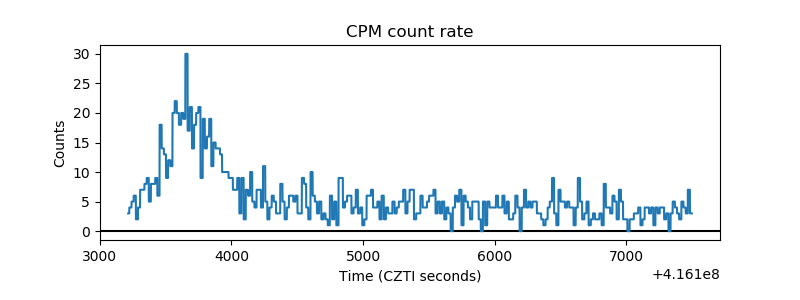 |
| CZT Counter | 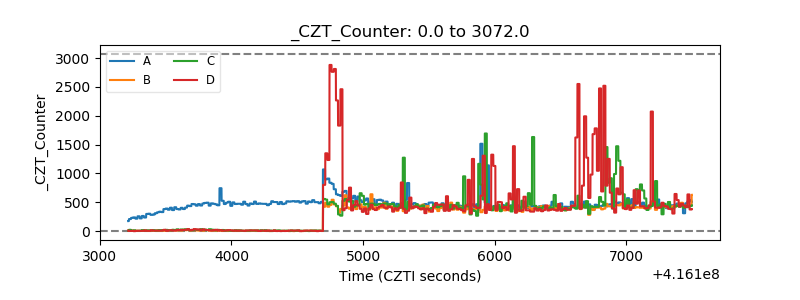 |
| +2.5 Volts monitor |  |
| +5 Volts monitor | 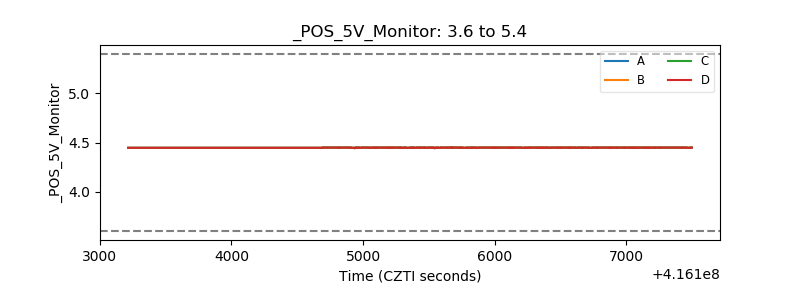 |
| _ROLL_ROT | 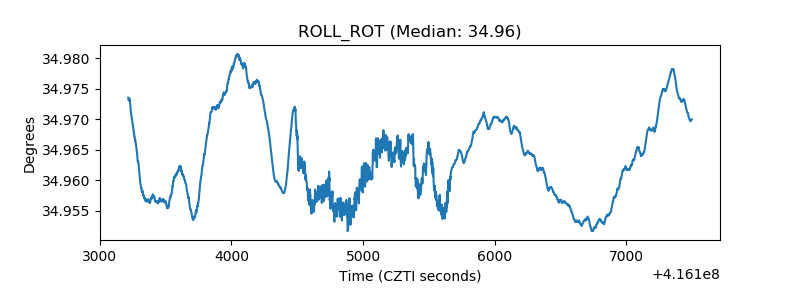 |
| _Roll_DEC | 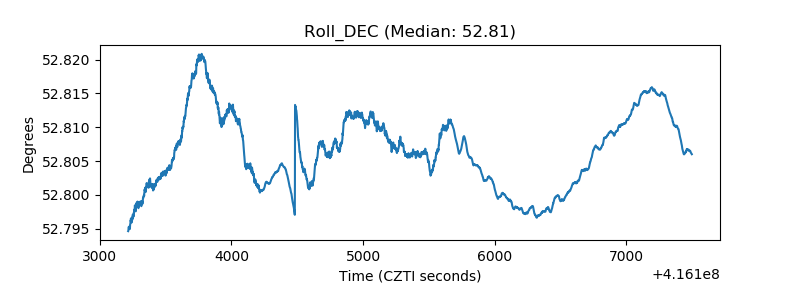 |
| _Roll_RA | 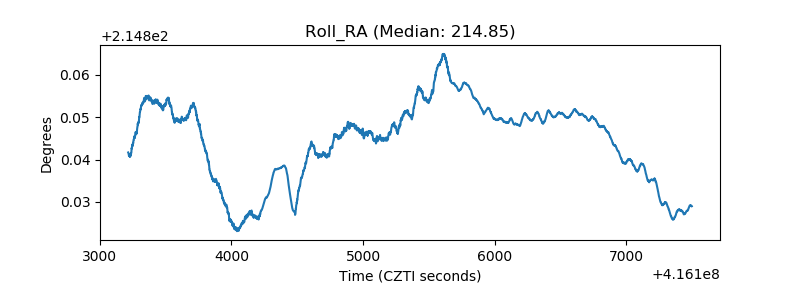 |
| Veto Counter | 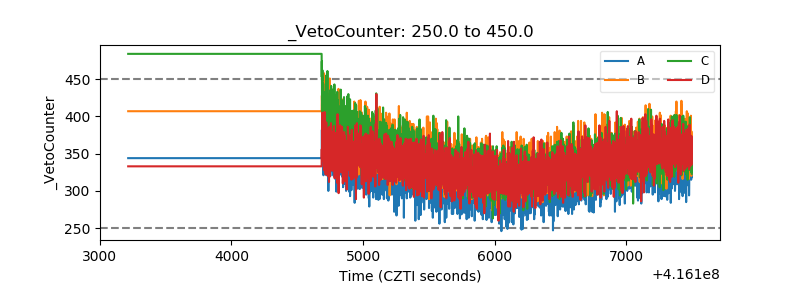 |